���Ͻ�AA1050����Ħ��������������ѧ���ֲܾ���������
��Դ�ڿ����й���ɫ����ѧ��(Ӣ�İ�)2020���9��
�������ߣ���С�� ����Ǭ ����� ��־�� �º��� ��ΰ ������
����ҳ�룺2369 - 2380
�ؼ��ʣ�����Ħ���������������������ֲ��������ԣ���ѧ���ܣ�֯��
Key words��friction stir welding; face-centered cubic metal; local inhomogeneity; mechanical properties; micro-texture
ժ Ҫ�������Ͻ�AA1050Ϊ�����о������Ա��ι����о��ж��ػ���ϵ������������������Ħ��������������ѧ���ֲܾ��������ԡ����ñ��Ϊ1 mm��С���������������������ѧ���ܵľֲ��������ԣ�ͨ�����ӱ�ɢ�����似���Խ������ھֲ��ľ����ߴ硢ȡ���Ƿֲ���֯���Ƚṹ�������������������ۺϷ���ģ�ͽ�ʾ����֯����ѧ���ܵĹ�ϵ��ʵ�����������ֲ��ĵ��������������ź�����ȷ����������仯������ǿ�ȵ����ֵ�����ڽ��������ģ��ﵽ99.0 MPa����Сֵλ�ڽ����������ࡣ����ǿ��֮�������ֵ��14.9 MPa��Ϊ����ǿ�����ֵ��15%�����ڽṹ-��ѧ���ܹ�ϵ�ķ�����֪��������ת�����������γɵ���λ�ñ仯��֯���ǵ��¾ֲ���ѧ���ܲ������Ե���Ҫ���ء�
Abstract: The local inhomogeneity of the stir zone in friction stir welded face-centered cubic metal was investigated, which has multiple activated slip systems during plastic deformation, by selecting commercial AA1050 aluminum alloy as an ideal experimental material. The local inhomogeneity was evaluated by uniaxial tensile tests using small samples with a 1 mm gauge length. The corresponding microstructural parameters such as grain size, misorientation angle distribution, and micro-texture, were quantified by the backscattered electron diffraction technique. A comprehensive model was used to reveal the microstructure-mechanical property relationship. The experimental results showed that the uniaxial tensile property changes significantly across the weld. The maximum ultimate tensile strength (UTS) occurred in the center of the stir zone, which was 99.0 MPa. The weakest regions were located at the two sides of the stir zone. The largest difference value in UTS reached 14.9 MPa, accounting for 15% of the maximum UTS. The analysis on the structure-mechanical property relationship suggests that the micro-texture change with the location formed during the rotational material flow is the main reason for the local inhomogeneity.
Trans. Nonferrous Met. Soc. China 30(2020) 2369-2380
Xiao-chao LIU1,2,3, Yun-qian ZHEN1, Yu-feng SUN4, Zhi-kang SHEN1,2,3, Hai-yan CHEN1,2,3, Wei GUO1, Wen-ya LI1,2,3
1. School of Materials Science and Engineering, Northwestern Polytechnical University, Xi��an 710072, China;
2. State Key Laboratory of Solidification Processing, Northwestern Polytechnical University, Xi��an 710072, China;
3. Shaanxi Key Laboratory of Friction Welding Technologies, Xi��an 710072, China;
4. School of Materials Science and Engineering, Zhengzhou University, Zhengzhou 450001, China
Received 31 December 2019; accepted 4 June 2020
Abstract: The local inhomogeneity of the stir zone in friction stir welded face-centered cubic metal was investigated, which has multiple activated slip systems during plastic deformation, by selecting commercial AA1050 aluminum alloy as an ideal experimental material. The local inhomogeneity was evaluated by uniaxial tensile tests using small samples with a 1 mm gauge length. The corresponding microstructural parameters such as grain size, misorientation angle distribution, and micro-texture, were quantified by the backscattered electron diffraction technique. A comprehensive model was used to reveal the microstructure-mechanical property relationship. The experimental results showed that the uniaxial tensile property changes significantly across the weld. The maximum ultimate tensile strength (UTS) occurred in the center of the stir zone, which was 99.0 MPa. The weakest regions were located at the two sides of the stir zone. The largest difference value in UTS reached 14.9 MPa, accounting for 15% of the maximum UTS. The analysis on the structure-mechanical property relationship suggests that the micro-texture change with the location formed during the rotational material flow is the main reason for the local inhomogeneity.
Key words: friction stir welding; face-centered cubic metal; local inhomogeneity; mechanical properties; micro-texture
1 Introduction
Fine-grained metals and their alloys have been fabricated by many different techniques in the last decades [1,2]. However, their weldability had always been poor until the friction stir welding (FSW) technique was invented [3-8]. It has been generally accepted that the FSW is a thermo-mechanical coupling solid-state joining process [9-11]. Compared with conventional fusion welding, the heat input in the FSW is much lower [12-14]. However, to further reduce the heat input in the FSW of fine-grained materials, smaller sizes of the tool and thinner workpieces [4,5] or larger loads combined with lower rotating speeds [15,16] should be adopted. Rapid cooling friction stir welding (RCFSW) is another promising method to obtain fine grains under conventional welding conditions. In RCFSW, the cooling medium is jetted on the tool and the workpiece. In this way, the heat effect can be reduced to the minimum, and even eliminated [17-21]. Therefore, the stir zone (SZ) is forced to be the key factor for the whole joint quality. In this background, much attention should be paid to the local inhomogeneity of the SZ.
The inhomogeneity in the mechanical properties of the FSW joint has been widely concerned. Much attention was paid to the close-packed hexagonal (HCP) metals subjected to the FSW, such as magnesium, titanium, and their alloys [22-26]. PARK et al [22] reported that the micro-texture with {0001} plane parallel to the surface of the tool pin was formed in the FSW of AZ61 Mg alloy. Under the influence of this micro-texture, the joints fractured at the transition zone between the SZ and the base metal (BM) during the uniaxial tensile tests perpendicular to the welding direction (WD). WANG et al [24] pointed out that the {0001} micro-texture was formed by the basal slip during the simple shear deformation because the basal slip is most easily to be activated during the deformation of Mg alloys. For the titanium and its alloys, owing to the fact that the prismatic slip is more easily to be activated than the basal slip, the  simple shear texture was formed in the SZ of titanium [25]. LIU et al [26] found that the texture gave rise to the inhomogeneous deformation during the tensile deformation of pure titanium FSW joint. In summary, for the HCP metals, the inhomogeneity in the mechanical properties of FSW joints is mainly caused by the strong texture formed due to the activated single slip system during the material flow.
However, for the face-centered cubic (FCC) and body-centered cubic (BCC) metals (Al, Cu, Fe, etc.), which have multiple activated slip systems during the plastic deformation, the previous studies mainly focused on the inhomogeneity caused by different strains, thermal history or dissimilar materials in the joint of FSW [27-39] or friction stir spot welding [40,41]. For example, the SZ, the thermo-mechanically affected zone (TMAZ), and the heat affected zone (HAZ) have always different mechanical properties for various materials [27-34]. SIMAR et al [27] investigated the local and global mechanical properties of the FSW joint of aluminum alloy 6005A-T6. It was found that although the hardness was similar in the SZ and the HAZ, the strain hardening capacity of the weld center was larger than that of the HAZ, and thus fracture occurred in the HAZ of the joint. SHEN et al [29] reported that the fracture location varied with the welding speed in the FSW of copper. The average hardness in the SZ first decreased and then increased with the increase in welding speed, but it was nearly constant in other regions within the joint, and thus the weakest region in the joint varied.
The dissimilar materials joining also gives rise to inhomogeneous mechanical properties within the joint [35-41]. DONATUS et al [35] investigated the variation in elemental compositions across the weld zones of a dissimilar friction stir weld between AA5083-O and AA6082-T6 alloys to illuminate the inhomogeneous microhardness distribution in the SZ and the TMAZ. KANGAZIAN and SHAMANIAN [36] investigated the mechanical behavior of the dissimilar FSW joints between the SAF 2507 super duplex stainless steel and the Incoloy 825 Ni-based superalloy and found that the joint owned the similar strength to the Incoloy 825 parent metal.
In summary, little attention was paid to the inhomogeneous mechanical properties in the SZ of FCC and BCC metals with multiple activated slip systems during the plastic deformation. In this study, a simple FCC metal, aluminum alloy, was used as an ideal experimental material to investigate the inhomogeneity of the SZ in the FSW of FCC metal.
2 Experimental
The cold-rolled plates of commercial AA1050 with dimensions of 300 mm �� 60 mm �� 3 mm were butt-welded by RCFSW using liquid carbon dioxide as a cooling medium. A FSW tool containing a concave shoulder of 12 mm in diameter and a smooth cylindrical probe of 2.8 mm in length and 4 mm in diameter was used. To avoid the kissing bond and tunnel defects, the welding speed and rotating speed were 200 mm/min and 1200 r/min, respectively. The welding temperature was estimated to be ~0.7Tm (Tm is the melting point) [42,43]. The tool tilt angle was 2.5��. After welding, the welds were cut to small non-standard tensile samples by spark cutting. The dimensions of the tensile samples are shown in Fig. 1(a). Such small-size tensile specimens were also used in the determination of the joint quality of laser beam welded and diffusion bonded joints [44-46]. To highlight the local inhomogeneity, the parallel length of the tensile samples is only 1 mm and the width is 1.7 mm, about 10 times the revolutionary pitch. The samples were cut every 1 mm from the weld center to the advancing side (AS) and the retreating side (RS) and marked as ��Center, AS-1 to AS-5 and RS-1 to RS-5��, respectively. The samples were first thinned from the weld bottom to ~1.2 mm in thickness and then thinned from the top surface to ~1 mm in thickness by heavy-grade sandpaper. Finally, the samples were polished by finer-grade sandpaper to a very good surface finish. The entire process was finished in flowing water. The tensile tests were conducted at room temperature using an Instron-type testing machine at a constant cross- head speed of 3.3��10-4 mm/s.
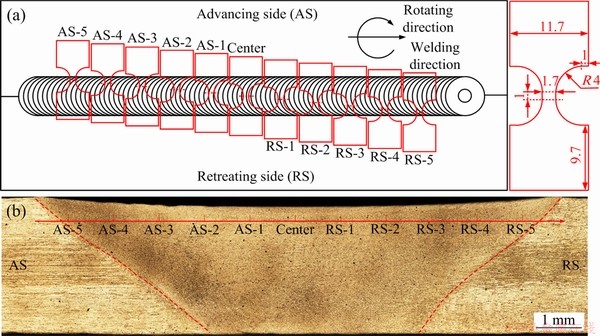
Fig. 1 Relative locations of small tensile samples to weld and their dimensions (a) and locations of EBSD measurements on weld cross-section (b) (unit: mm)
The microstructural parameters such as grain size, misorientation angle distribution, and micro- texture at different locations corresponding to the small tensile samples were characterized and quantified by the electron back-scattered diffraction (EBSD) technique. For the EBSD measurement, the specimens were firstly ground by sandpaper in anhydrous ethanol, and then mechanically polished by using Al2O3 polishing paste to the mirror finish. At last, the electrolytic polishing with a solution of V(HClO4):V(C2H5OH)=1:4 at 20 V and 0 ��C was conducted. The EBSD measurements were carried out on a JEM-7001F field-emission scanning electron microscope (FE-SEM) operated at 15 kV using the TSL OIMTM system. The measured positions were along the line with 0.5 mm from the top surface and arranged every 1 mm from the center to the AS and the RS on the weld transverse cross-section, as shown in Fig. 1(b). The step size of the EBSD scanning was 0.3 ��m. More than 5000 grains (enclosed by boundaries with misorientation angle higher than 2��) were calculated by EBSD software automatically to obtain the microstructural parameters. A 15�� criterion was used to differentiate the low angle boundary (LAB) and high angle boundary (HAB). The Vickers hardness of the corresponding positions was measured with a load of 50 g and a dwell time of 15 s.
3 Results
3.1 Tensile properties
Figure 2 shows the uniaxial tensile test results. The stress-displacement curves of different samples scatter to a great extent. The sample ��Center�� has the highest ultimate tensile strength (UTS) and the tensile displacement. From the center to the AS and the RS, the UTS and tensile displacement show a trend of gradual decline. At the same time, the samples with the same distance to the weld center have similar stress-displacement curves.
The detailed yield stress (��0.2) and UTS of the samples are listed in Table 1. The yield stress ranges from 62.8 MPa (RS-5) to 71.9 MPa (RS-1). The maximum difference is 9.1 MPa, which is ~12.7% of the maximum yield stress. The UTS ranges from 84.1 MPa (RS-5) to 99.0 MPa (Center). The maximum difference reaches 14.9 MPa, which is 15% of the maximum UTS. These differences values indicate that the local inhomogeneity in the mechanical properties of the SZ should be concerned.

Fig. 2 Tensile engineering stress curves at different locations of weld
Table 1 Yield stress and ultimate tensile strength at different locations of weld

3.2 Microstructure
To understand the above inhomogeneous mechanical properties in the SZ, the microstructures at different locations were characterized by the EBSD technique. Figure 3 shows the grain microstructures at the locations from AS-5 to Center and then to RS-5. The black and white lines in the EBSD inverse pole figure (IPF) maps denote the HABs and LABs, respectively. Different colors stand for different grain orientations under the specimen coordinate system. From Fig. 3(a) to Fig. 3(k), the dominant hue changes gradually with the locations from AS-5 to RS-5. This means that the micro-textures vary greatly at different locations. This phenomenon has been widely reported in previous studies [47-49]. The grain size, HAB and LAB fractions, and misorientation angle distribution from AS-5 to RS-5 were summarized and shown in Fig. 4. The average grain size is nearly constant at different locations, i.e. ~2.5 ��m. The number fraction of LAB presents a gradually decreasing trend from AS-5 to RS-5. At AS-5, due to the mixing with the TMAZ (Fig. 3(a)), the LAB fraction is significantly higher than that at the other locations. The lowest LAB fraction occurs at RS-5, which is only 19%. All the misorientation angle distributions at different locations present a two-peak distribution with one peak at 2�� and the other peak at ~50��. Such a bimodal misorientation distribution is like that of aluminum alloy subjected to severe cold deformation and subsequent annealing [50,51]. This indicated that the full recrystallization occurred in the SZ during the RCFSW [52,53].
Figure 5 shows the (111) pole figures at the locations from AS-5 to RS-5. In the pole figure, the vertical direction stands for the normal direction (ND) of the workpiece, and the horizontal direction is in accord with the transverse direction (TD) of the workpiece. The pole figures vary regularly from AS-5 to RS-5. This should be attributed to the rotational material flow during the FSW [54-56], which results in different shear directions and shear planes at different locations.
The detailed micro-texture changes from AS-5 to RS-5 are shown in Fig. 6. As shown in Fig. 6(a), the original pole figures can be divided into several single-components. The orientation of a single-component can be read from the orientation distribution function (ODF). The number fraction of every single-component was calculated using a tolerant misorientation angle of 15�� by the EBSD analysis software. Four main components, their number fractions and Taylor factors are summarized and listed in Table 2. The remnant part was considered as a random orientation. Their distributions in the space of (0 �� ��1, ��, ��2 �� ��/2) are shown in Fig. 6(b). The three-dimensional coordinate position of the colorful symbol denotes the Bunge Euler angles of the corresponding single-component. The area of the symbol stands for its relative fraction. Two orientations dominated the micro-texture at a specific location. Both rotated from the RS to the AS, and their intensity increased gradually, as shown by the dotted arrows in Fig. 6(b). It should be emphasized that some rotations cannot be seen intuitively only in the space of (0 �� ��1, ��, ��2 �� ��/2) due to the multi- symmetry of FCC crystal. These micro-textures are known as  simple shear texture after rotating around the TD axis [57]. These rotational micro- textures are formed by rotational material flow. This is a typical phenomenon occurring in the FSW.

Fig. 3 EBSD IPF maps showing grain microstructures at different locations of stir zone

Fig. 4 Changes of microstructure parameters at locations from AS-5 to RS-5

Fig. 5 (111) pole figures at locations from AS-5 to RS-5
4 Discussion
4.1 Strengthening mechanisms
To reveal the relationship between the local mechanical properties and the corresponding microstructures, the following discussion tries to use a comprehensive model to calculate the contribution of different strengthening mechanisms.

Fig. 6 Micro-texture changes from As-5 to RS-5
For polycrystalline aluminum alloy, it has been generally accepted that the boundary strengthening and dislocation strengthening are the main strengthening mechanisms [50,51] and the orientation factor M cannot be neglected especially for textured samples. The yield stress ��y or flow stress ��f is usually described by the following formula [50]:
��y(or ��f)= ��gb+��dis+M��tot (1)
where ��gb and ��dis represent the contributions of grain boundary strengthening and dislocation strengthening, respectively. The orientation factor M is often referred to as the Taylor factor which is significantly dependent on the crystalline texture and the direction of the tensile axis. ��tot is the critical resolved shear stress (CRSS), which consists of intrinsic CRSS, solid solution strengthening, and precipitation strengthening. For commercial AA1050, the CRSS mainly refers to the intrinsic CRSS due to its low alloy elements. In this study, the CRSS of fully annealed AA1050 is taken as ��tot and it is about ~9 MPa [58,59]. ��gb can be described by Hall-Petch relationship [60]:
 (2)
(2)
where k is a constant and dgb is the average grain size. KAMIKAWA et al [50] suggested that the LABs with misorientation angles above 2�� act as conventional grain boundaries in terms of strength contribution and thus the parameter dgb in Hall-Petch relationship is the average value of the grain and subgrain sizes (i.e. enclosed by boundaries with misorientation angles above 2��). The remnant boundaries with misorientation angles below 2�� and grain interior dislocations are considered to contribute to the dislocation strengthening. ��dis can be described by the following formula [50]:
 (3)
(3)
�� is a constant (0.24) [50,61], G is the shear modulus (26 GPa for aluminum), b is the Burgers vector component (0.286 nm for aluminum), and ��dis is the dislocation density. In this study, owing to the full recrystallization occurring in the SZ, the dislocation density in the grain interior was very low [62].
4.2 Grain boundary strengthening
The slope k of Hall-Petch relationship for grain boundaries strengthening at a given strain can be obtained from the relationship between the hardness and the square root of the grain size [62].
Table 2 Four main single-components of micro-texture, their number fractions and Taylor factors (along with TD) at corresponding locations from AS-5 to RS-5

Generally, the slope k is obtained by fitting the linear relationship between the yield stress and the square root of the grain size. However, in this study, as the yield stress test is easily influenced by the local micro-texture, the hardness was used to calculate the slope k. In the hardness test, the applied stress is in multiple directions and thus the influence of micro-texture can be ignored. As shown in Fig. 7, the circle symbols stand for the data obtained in the RCFSW of AA1050 in this study and our previous study [52]. The square symbols denote the data obtained in the conventional FSW of AA1050 [62]. Through fitting the data, the slope k is ~24.8 HV/��m-1/2 in the RCFSW of AA1050. This value can be converted to ~81 MPa/��m-1/2 using the equation H��3��, where H is the diamond pyramid hardness and �� is the stress at a strain of 8% during a tensile test [63]. This equation is workable when the material is without appreciable work hardening [62,64]. The slope k in the RCFSW is a little higher than that of the conventional FSW. SATO et al [62] suggested that a higher value of k corresponds to the higher dislocation density. This indicates that the dislocation density in the RCFSW is a little higher than that in conventional FSW. This is because the rapid cooling suppresses the annealing during the cooling stage [52,55,65]. It is worth mentioning that when the slope k is calculated by using the hardness, the contribution of the dislocation strengthening has been included in the slope k. Therefore, dislocation strengthening should not be considered separately again.
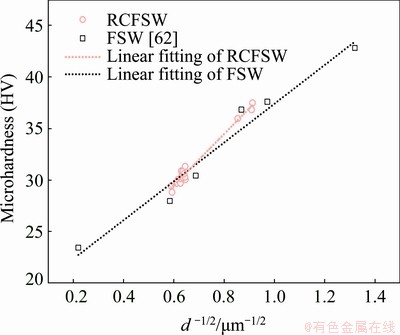
Fig. 7 Hall-Petch relationship between microhardness and square root of grain size in RCFSW of AA1050
In this study, the measured hardness at different locations and the corresponding tensile stress at 8% strain are summarized and listed in Table 3. They roughly match the equation H��3��. The small deviation between them may be caused by the higher dislocation density in the RCFSW. These results indicate that the above approximate treatment of which the slope k in the Hall-Petch relationship is converted to ~81 MPa/��m-1/2 from ~24.8 HV/��m-1/2 is acceptable.
Table 3 Comparison between diamond pyramid hardness (H) and tensile stress (��) at strain of 8%

4.3 CRSS strengthening
For the orientation factor M, the classical Taylor model is used to calculate the values of M at different locations, in which five slip systems are as summed to be active. For texture free FCC metals, the Taylor factor Mtf=3.07 [66]. As for the present textured samples, M can be calculated by the following equation:
 (4)
(4)
where fi is the number fraction of the grain with the same orientation, Mi is the corresponding Taylor factor. The remnant fraction of the grains is assumed as random orientation and the corresponding Taylor factor is Mtf. Mi is dominated by the specific orientation (��1, ��, ��2) and the tensile stress axes. For FCC metal, the detailed calculation of Mi refers to Ref. [66]. In this study, M was calculated by the EBSD analysis software directly. The calculated results have been listed in Table 2.
4.4 Comparison of flow stress
As the equation H��3�� works when the strain is 8%, the following discussion will focus on the comparison between the calculated flow stress and the experimental value at the strain of 8%.
Figure 8 shows the comparison of the calculated flow stresses at the strain of 8% with the experimental values at different locations. Here, the experimental flow stress is expressed by the engineering stress with a strain of 8%. This is reasonable because the true tress is roughly equal to the engineering stress at such a small strain. For comparison, the corresponding UTS and the microhardness of the SZ are also presented in Fig. 8. Notably, the microhardness in the SZ is nearly uniform. However, the UTS and the flow stress present an obvious unimodal distribution. The stress values in the SZ center are significantly higher than those on the two sides. The variation trends of the calculated and experimental flow stresses match each other very well from AS-5 to RS-5 with a maximum error of ~2.3 MPa (~ 3%).
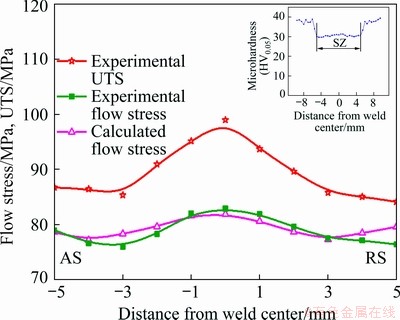
Fig. 8 Comparison between calculated flow stress and experimental value at 8% strain
Figure 9 shows the contributions of the grain boundary strengthening and the CRSS strengthening. According to the results, the grain boundary strengthening is the main strengthening mechanism for fine-grain aluminum produced by the RCFSW. However, the grain boundary strengthening at different locations is almost the same. The difference in the flow stress is mainly caused by CRSS strengthening. This indicates that the variation of the orientation factor M caused by the rotational micro-texture plays a very important role in the local inhomogeneity of the SZ. Therefore, it can be inferred that for any fine-grain FCC metals fabricated by FSW, the larger the CRSS is, the moreremarkable the local inhomogeneity of the SZ is.

Fig. 9 Contributions of grain boundary strengthening and CRSS strengthening to calculated flow stress and experimental flow stress
The phenomenon that the microhardness at different locations in the SZ is nearly the same is a typical feature in the fine-grain aluminum alloy weld fabricated by the FSW [4,5]. According to the microstructure investigation, the grain size and misorientation angle distribution also have no significant difference at different locations of the SZ. However, the local inhomogeneity of the mechanical properties in the SZ is nonnegligible. Taking the UTS as an example, the highest value (in the center of the SZ) is 15% larger than the lowest value (on the two sides of the SZ). This phenomenon should be concerned when fabricating fine-grain FCC materials by the FSW. Also, it is worth mentioning that the local inhomogeneity of mechanical properties in the SZ of the FSW is greatly different from that in the fine-grain materials fabricated by other deformation processing methods, such as equal channel angular pressing and high-pressure torsion [59,67]. The latter two arise from the locally non-uniform plastic deformation and are reflected in the hardness, grain size, and dislocation density. However, in the FSW, the local inhomogeneity is mainly caused by rotational micro-texture. Therefore, if the micro- texture intensity in the SZ can be weakened, the local inhomogeneity will be reduced and even eliminated. MIRONOV et al [42] found that lower rotating speed is beneficial for the weakening of the micro-texture intensity in the SZ. LIU et al [52] suggested that rapid cooling can suppress the micro-texture sharpening during the cooling stage. These methods can be considered to relieve the local inhomogeneity of mechanical properties in the SZ caused by the rotational micro-texture.
5 Conclusions
(1) The tensile strength of friction stir welded AA1050 in the center of the SZ is significantly higher than that on the two sides of the SZ. The maximum difference is 14.9 MPa, accounting for 15% of the local maximum UTS.
(2) The grain size and misorientation angle distribution have no obvious change at different locations. However, the micro-texture presents an obvious rotational trend around the tool axis (normal direction of the workpieces).
(3) The flow stress at a strain of 8% during the tensile tests is successfully predicated by taking the grain boundary strengthening and the CRSS strengthening into consideration, which agrees well with the experimental value.
(4) The local inhomogeneity of mechanical properties in the SZ originates from the CRSS strengthening, which is determined by the rotational micro-texture at different locations to the tensile direction.
References
[1] Valiev R Z, Langdon T G. Principles of equal-channel angular pressing as a processing tool for grain refinement [J]. Progress in Materials Science, 2006, 51(7): 881-981.
[2] Saito Y, Utsunomiya H, Tsuji N, Sakai T. Novel ultra-high straining process for bulk materials�� Development of the accumulative roll-bonding (ARB) process [J]. Acta Materialia, 1999, 47(2): 579-583.
[3] Ito R, Shiga C, Kawaguchi Y, Nakamura T, Hiraoka K, Hayashi T, Torizuka S. Controlling of the softened region in weld heat affected zone of ultra fine grained steels [J]. ISIJ International, 2000, 40(S): s29-s33.
[4] Sato Y S, Urata M, Kokawa H, Ikeda K, Enomoto M. Retention of fine grained microstructure of equal channel angular pressed aluminum alloy 1050 by friction stir welding [J]. Scripta Materialia, 2001, 45(1): 109-114.
[5] Sato Y S, Kurihara Y, Park S H C, Kokawa H, Tsuji N. Friction stir welding of fine grained Al alloy 1100 produced by accumulative roll-bonding [J]. Scripta Materialia, 2004, 50(1): 57-60.
[6] KASHAEV N, VENTZKE V, CAM G. Prospects of laser beam welding and friction stir welding processes for aluminum airframe structural applications [J]. Journal of Manufacturing Processes, 2018, 36: 571-600.
[7] CAM G, IPEKOGLU G. Recent developments in joining of aluminium alloys [J]. The International Journal of Advanced Manufacturing Technology, 2017, 91: 1851-1866.
[8] CAM G. Friction stir welded structural materials: Beyond Al-alloys [J]. International Materials Reviews, 2011, 56(1): 1-48.
[9] Zhao Wen-zhen, Wu Chuan-song. Constitutive equation including acoustic stress work and plastic strain for modeling ultrasonic vibration assisted friction stir welding process [J]. International Journal of Machine Tools and Manufacture, 2019, 145: 103434.
[10] Wu chuan-song, Su Hao, Shi Lei. Numerical simulation of heat generation, heat transfer and material flow in friction stir welding [J]. Acta Metallurgica Sinica, 2018, 54(2): 265-277. (in Chinese)
[11] Chen Gao-qiang, Zhang Shuai, Zhu Yu-can, Yang Cheng-le, Shi Qing-yu. Thermo-mechanical analysis of friction stir welding: A review on recent advances [J]. Acta Metallurgica Sinica (English Letters), 2020, 33(1): 3-12.
[12] CAM G, VENTZKE V, dos SANTOS J F, KOCAK M, JENNEQUIN G, GONTHIER-MAURIN P, PENASA M, RIVEZLA C. Characterization of laser and electron beam welded Al-alloys [J]. Practical Metallography, 1999, 36(2): 59-89.
[13] CAM G, VENTZKE V, dos SANTOS J F, KOCAK M, JENNEQUIN G, GONTHIER-MAURIN P. Characterization of electron beam welded aluminium alloys [J]. Science and Technology of Welding and Joining, 1999, 4(5): 317-323.
[14] von STROMBECK A, CAM G, dos SANTOS J F, VENTZKE V, KOCAK M. A comparison between microstructure, properties, and toughness behavior of power beam and friction stir welds in Al-alloys [C]//Proc of the TMS 2001 Annual Meeting Aluminum. Warrendale, PA: TMS, 2001: 249-264.
[15] Xu Nan, Song Qi-ning, Bao Ye-feng, Jiang Yong-feng, Shen Jun. Achieving good strength-ductility synergy of friction stir welded Cu joint by using large load with extremely low welding speed and rotation rate [J]. Materials Science and Engineering A, 2017, 687: 73-81.
[16] Xu N, Song Q N, Fujii H, Bao Y F, Shen J. Mechanical properties�� modification of large load friction stir welded AZ31B Mg alloy joint [J]. Materials Letters, 2018, 219: 93-96.
[17] Xue P, Xiao B L, Zhang Q, Ma Z Y. Achieving friction stir welded pure copper joints with nearly equal strength to the parent metal via additional rapid cooling [J]. Scripta Materialia, 2011, 64(11): 1051-1054.
[18] Xu W F, Liu J H, Chen D L, Luan G H, Yao J S. Improvements of strength and ductility in aluminum alloy joints via rapid cooling during friction stir welding [J]. Materials Science and Engineering A, 2012, 548: 89-98.
[19] Xu N, Ueji R, Fujii H. Enhanced mechanical properties of 70/30 brass joint by rapid cooling friction stir welding [J]. Materials Science and Engineering A, 2014, 610: 132-138.
[20] Imam M, Ueji R, Fujii H. Effect of online rapid cooling on microstructure and mechanical properties of friction stir welded medium carbon steel [J]. Journal of Materials Processing Technology, 2016, 230: 62-71.
[21] Zeng X H, Xue P, Wang D, Ni D R, Xiao B L, Ma Z Y. Realising equal strength welding to parent metal in precipitation-hardened Al�CMg�CSi alloy via low heat input friction stir welding [J]. Science and Technology of Welding and Joining, 2018, 23(6): 478-486.
[22] Park S H C, Sato Y S, Kokawa H. Effect of micro-texture on fracture location in friction stir weld of Mg alloy AZ61 during tensile test [J]. Scripta Materialia, 2003, 49(2): 161-166.
[23] Woo W, Choo H, Brown D W, Liaw P K, Feng Z. Texture variation and its influence on the tensile behavior of a friction-stir processed magnesium alloy [J]. Scripta Materialia, 2006, 54(11): 1859-1864.
[24] Wang Wen, Han Peng, Peng Pai, Zhang Ting, Liu Qiang, Yuan Shen-Nan, Huang Li-ying. Yu Hai-liang, Qiao Ke, Wang Kuai-she. Friction stir processing of magnesium alloys: A review [J]. Acta Metallurgica Sinica (English letters), 2020, 33(1): 43-57.
[25] Mironov S, Sato Y S, Kokawa H. Development of grain structure during friction stir welding of pure titanium [J]. Acta Materialia, 2009, 57: 4519-4528.
[26] Liu F C, Liao J, Gao Y, Nakata K. Influence of texture on strain localization in stir zone of friction stir welded titanium [J]. Journal of Alloys and Compounds, 2015, 626: 304-308.
[27] Simar A, Brechet Y, de Meester B, Denquin A, Pardoen T. Microstructure, local and global mechanical properties of friction stir welds in aluminium alloy 6005A-T6 [J]. Materials Science and Engineering A, 2008, 486(1): 85-95.
[28] Starink M J, Deschamps A, Wang S C. The strength of friction stir welded and friction stir processed aluminium alloys [J]. Scripta Materialia, 2008, 58(5): 377-382.
[29] Shen J J, Liu H J, Cui F. Effect of welding speed on microstructure and mechanical properties of friction stir welded copper [J]. Materials & Design, 2010, 31(8): 3937-3942.
[30] Sato Y S, Nelson T W, Sterling C J, STEEL R J, DETTERSSON C O. Microstructure and mechanical properties of friction stir welded SAF 2507 super duplex stainless steel [J]. Materials Science and Engineering A, 2005, 397(1): 376-384.
[31] Zhang Z H, Li W Y, Li J L, Chao Y J, Vairis A. Microstructure and anisotropic mechanical behavior of friction stir welded AA2024 alloy sheets [J]. Materials Characterization, 2015, 107: 112-118.
[32] CAM G, MISTIKOGLU S, PAKDIL M. Microstructural and mechanical characterization of friction stir butt joint welded 63%Cu-37%Zn brass plate [J]. Welding Journal, 2009, 88(11): 225-232.
[33] K��C��KOMEROGLU T, SENTURK E, KARA L, IPEKOGLU G, CAM G. Microstructural and mechanical properties of friction stir welded nickel-aluminum bronze (NAB) Alloy [J]. Journal of Materials Engineering and Performance, 2016, 25(1): 320-326.
[34] Liu X C, Sun Y F, Nagira T, Fujii H. Investigation of temperature dependent microstructure evolution of pure iron during friction stir welding using liquid CO2 rapid cooling [J]. Materials Characterization, 2018, 137(1): 24-38.
[35] Donatus U, Thompson G E, Momoh M I, MALEDI N B, TSAI I L, FERREIRA R O, LIU Z. Variations in stir zone and thermomechanically affected zone of dissimilar friction stir weld of AA5083 and AA6082 alloys [J]. Transactions of Nonferrous Metals Society of China, 2018, 28(12): 2410-2418.
[36] KANGAZIAN J, SHAMANIAN M. Microstructure and mechanical characterization of Incoloy 825 Ni-based alloy welded to 2507 super duplex stainless steel through dissimilar friction stir welding [J]. Transactions of Nonferrous Metals Society of China, 2019, 29(8): 1677-1688.
[37] Li S H, Chen Y H, Zhou X W, Kang J D, Huang Y D, Deng H B. High-strength titanium alloy/steel butt joint produced via friction stir welding [J]. Materials Letters, 2019, 234: 155-158.
[38] Wang T H, Sidhar H, Mishra R S, Hovanski Y, Upadhyay P, Carlson B. Effect of hook characteristics on the fracture behaviour of dissimilar friction stir welded aluminium alloy and mild steel sheets [J]. Science and Technology of Welding and Joining, 2019, 24(2): 178-184.
[39] HE B, CUI L, WANG D P, LI H J, LIU C X. Microstructure and mechanical properties of RAFM-316L dissimilar joints by friction stir welding with different butt joining modes [J]. Acta Metallurgica Sinica, 2020, 33(1): 135-146.
[40] SHEN Z, DING Y, GERLICH A P. Advances in friction stir spot welding [J]. Critical Reviews in Solid State and Materials Sciences, 2019. 1671799. http://doi.org/10.1080/ 10408436.
[41] SHEN Z, DING Y, CHEN J, AMIRKHIZ B S, WEN J Z, FU L, GERLICH A P. Interfacial bonding mechanism in Al/coated steel dissimilar refill friction stir spot welds [J]. Journal of Materials Science & Technology, 2019, 35(6): 1027-1038.
[42] MIRONOV S, INAGAKI K, SATO Y S, KOKAWA H. Effect of welding temperature on microstructure of friction-stir welded aluminum alloy 1050 [J]. Metallurgical and Materials Transactions A, 2015, 46(2): 783-790.
[43] YI D, MIRONOV S, SATO Y, KOKAWA H. Effect of cooling rate on microstructure of friction-stir welded AA1100 aluminum alloy [J]. Philosophical Magazine, 2016, 96(18): 1965-1977.
[44] CAM G, YENI C, ERIM S, VENTZKE V, KOCAK M. Investigation into properties of laser welded similar and dissimilar steel joints [J]. Science and Technology of Welding and Joining, 1998, 3(4): 177-189.
[45] CAM G, M��LLAUER J, KOCAK M. Diffusion bonding of two- phase ��-TiAl alloys with duplex microstructure [J]. Science and Technology of Welding and Joining, 1997, 2(5): 213-219.
[46] CAM G, BOHM K H, M��LLAUER J, KOCAK M. The fracture behavior of diffusion-bonded duplex gamma TiAl [J]. JOM, 1996, 48(11): 66-68.
[47] Ahmed M M Z, Wynne B P, Rainforth W M, Threadgill P L. Quantifying crystallographic texture in the probe-dominated region of thick-section friction-stir- welded aluminium [J]. Scripta Materialia, 2008, 59(5): 507-510.
[48] Davies P S, Wynne B P, Rainforth W M, Thomas M J, Threadgill P L. Development of microstructure and crystallographic texture during stationary shoulder friction stir welding of Ti-6Al-4V [J]. Metallurgical & Materials Transactions A, 2011, 42(8): 2278-2289.
[49] Ahmed M M Z, Wynne B P, Rainforth W M, Addison A, Martin J P, Threadgill P L. Effect of tool geometry and heat input on the hardness, grain structure, and crystallographic texture of thick-section friction stir- welded aluminium [J]. Metallurgical and Materials Transactions A, 2019, 50(1): 271-284.
[50] Kamikawa N, Huang X, Tsuji N, Hansen N. Strengthening mechanisms in nanostructured high-purity aluminium deformed to high strain and annealed [J]. Acta Materialia, 2009, 57(14): 4198-4208.
[51] Liu Q, Huang X, Lloyd D J, Hansen N. Microstructure and strength of commercial purity aluminium (AA1200) cold-rolled to large strains [J]. Acta Materialia, 2002, 50(15): 3789-3802.
[52] Liu X C, Sun Y F, Fujii H. Clarification of microstructure evolution of aluminum during friction stir welding using liquid CO2 rapid cooling [J]. Materials & Design, 2017, 129: 151-163.
[53] Xu W F, Luo Y X, Fu M W. Microstructure evolution in the conventional single side and bobbin tool friction stir welding of thick rolled 7085-T7452 aluminum alloy [J]. Materials Characterization, 2018, 138: 48-55.
[54] Liu X C, Sun Y F, Morisada Y, Fujii H. Dynamics of rotational flow in friction stir welding of aluminium alloys [J]. Journal of Materials Processing Technology, 2018, 252: 643-651.
[55] Liu X C, Sun Y F, Nagira T, Ushioda K, Fujii H. Evaluation of dynamic development of grain structure during friction stir welding of pure copper using a quasi in situ method [J]. Journal of Materials Science & Technology, 2019, 35(7): 1412-1421.
[56] Liu X C, Sun Y F, Nagira T, Ushioda K, Fujii H. Experimental evaluation of strain and strain rate during rapid cooling friction stir welding of pure copper [J]. Science and Technology of Welding and Joining, 2019, 24(4): 352-359.
[57] Fonda R W, Bingert J F. Texture variations in an aluminum friction stir weld [J]. Scripta Materialia, 2007, 57(11): 1052-1055.
[58] DAVIS J R. ASM handbook [M]. 10th ed. New York: ASM International, 1991.
[59] Qiao X G, Starink M J, Gao N. Hardness inhomogeneity and local strengthening mechanisms of an Al1050 aluminium alloy after one pass of equal channel angular pressing [J]. Materials Science and Engineering A, 2009, 513: 52-58.
[60] Hansen N. Hall�CPetch relation and boundary strengthening [J]. Scripta Materialia, 2004, 51(8): 801-806.
[61] Hansen N, Huang X. Microstructure and flow stress of polycrystals and single crystals [J]. Acta Materialia, 1998, 46(5): 1827-1836.
[62] Sato Y S, Urata M, Kokawa H, Ikeda K. Hall�CPetch relationship in friction stir welds of equal channel angular- pressed aluminium alloys [J]. Materials Science and Engineering A, 2003, 354(1): 298-305.
[63] Cahoon J R, Broughton W H, Kutzak A R. The determination of yield strength from hardness measurements [J]. Metallurgical Transactions, 1971, 2(7): 1979-1983.
[64] Ashby M F, Jones D R H. Engineering Materials (I) [M]. Oxford: Pergamon Press, 1980: 105.
[65] Liu X C, Sun Y F, Nagira T, Ushioda K, Fujii H. Microstructure evolution of Cu-30Zn during friction stir welding [J]. Journal of Materials Science, 2018, 53(14): 10423-10441.
[66] Starink M J, Wang S C. A model for the yield strength of overaged Al-Zn-Mg-Cu alloys [J]. Acta Materialia, 2003, 51(17): 5131-5150.
[67] Xu C, Horita Z, Langdon T G. The evolution of homogeneity in processing by high-pressure torsion [J]. Acta Materialia, 2007, 55(1): 203-212.
��С��1,2,3������Ǭ1�������4����־��1,2,3���º���1,2,3���� ΰ1��������1,2,3
1. ������ҵ��ѧ ����ѧԺ������ 710072��
2. ������ҵ��ѧ ���̼��������ص�ʵ���ң����� 710072��
3. ����ʡĦ�����ӹ��̼����ص�ʵ���ң����� 710072��
4. ֣�ݴ�ѧ ���Ͽ�ѧ�빤��ѧԺ��֣�� 450001
ժ Ҫ�������Ͻ�AA1050Ϊ�����о������Ա��ι����о��ж��ػ���ϵ������������������Ħ��������������ѧ���ֲܾ��������ԡ����ñ��Ϊ1 mm��С���������������������ѧ���ܵľֲ��������ԣ�ͨ�����ӱ�ɢ�����似���Խ������ھֲ��ľ����ߴ硢ȡ���Ƿֲ���֯���Ƚṹ�������������������ۺϷ���ģ�ͽ�ʾ����֯����ѧ���ܵĹ�ϵ��ʵ�����������ֲ��ĵ��������������ź�����ȷ����������仯������ǿ�ȵ����ֵ�����ڽ��������ģ��ﵽ99.0 MPa����Сֵλ�ڽ����������ࡣ����ǿ��֮�������ֵ��14.9 MPa��Ϊ����ǿ�����ֵ��15%�����ڽṹ-��ѧ���ܹ�ϵ�ķ�����֪��������ת�����������γɵ���λ�ñ仯��֯���ǵ��¾ֲ���ѧ���ܲ������Ե���Ҫ���ء�
�ؼ��ʣ�����Ħ���������������������ֲ��������ԣ���ѧ���ܣ�֯��
(Edited by Wei-ping CHEN)
Foundation item: Project (51905437) supported by the National Natural Science Foundation of China; Project (2019M653726) supported by the China Postdoctoral Science Foundation; Project (3102019QD0407) supported by the Fundamental Research Funds for the Central Universities, China
Corresponding author: Zhi-kang SHEN; Tel: +86-29-88495240; E-mail: zhikangshen@nwpu.edu.cn
DOI: 10.1016/S1003-6326(20)65385-7

