Abstract: The twinning process in a magnesium AZ31 alloy with initial texture is quantitatively analyzed during plane-strain compression by means of orientation mapping based on EBSD technique. The results indicate that the {101-2} twinning of c-axis tension is the main deformation mechanism if c-axes of most grains in initial sample are parallel to the rolling direction. The strong basal texture of 〈0001〉ND will be resulted. As the strain increases, the number of twin relationship of 86.3°〈112-0〉 increases to a maximum and then reduces. It is indicated that the amount of twins is proportional to the basal-oriented grains and not to the number of twin relationship detected. A quantitative relationship of strain and twin amount is given and the related errors are discussed.
Investigation of twinning process in magnesium alloy by means of orientation mapping
Abstract:
The twinning process in a magnesium AZ31 alloy with initial texture is quantitatively analyzed during plane-strain compression by means of orientation mapping based on EBSD technique. The results indicate that the {1012} twinning of c-axis tension is the main deformation mechanism if c-axes of most grains in initial sample are parallel to the rolling direction. The strong basal texture of <0001>∥ND will be resulted. As the strain increases, the number of twin relationship of 86.3°<1120> increases to a maximum and then reduces. It is indicated that the amount of twins is proportional to the basal-oriented grains and not to the number of twin relationship detected. A quantitative relationship of strain and twin amount is given and the related errors are discussed.
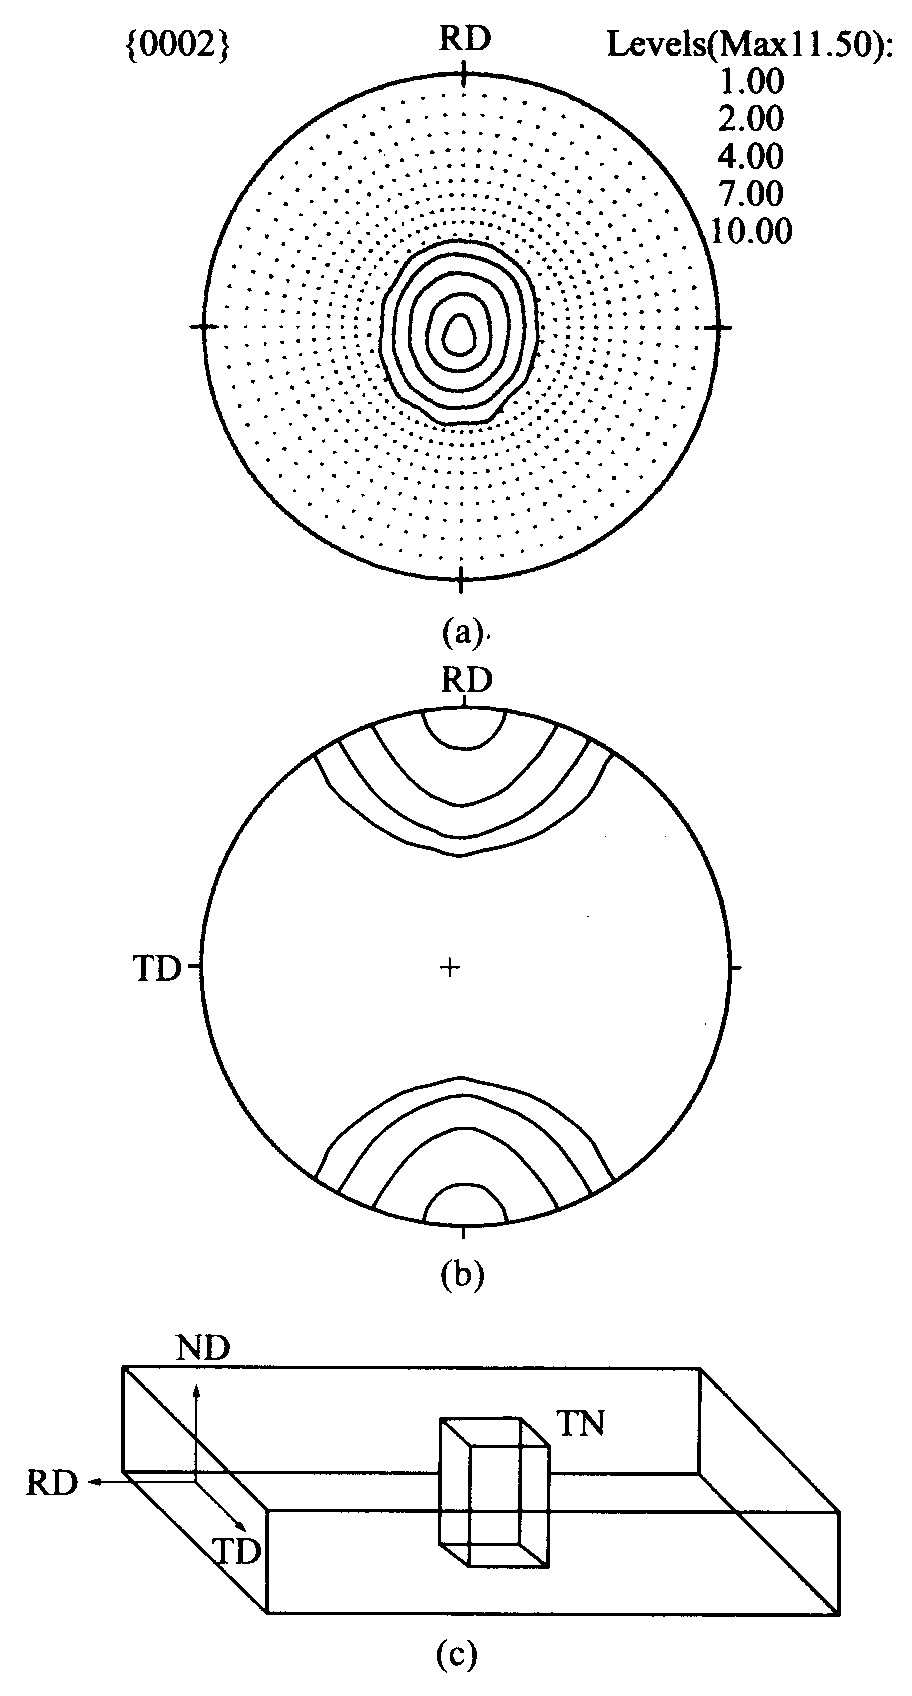
Fig.1 Initial texture and acquirement of initial sample from hot rolled plate (a)―Texture in hot rolled plate; (b)―Sample acquirement from hot rolled plate; (c)―Texture of initial sample before plane-strain compression
Fig.2 Microstructures at different strains (a)―Strained by 0.9%; (b)―Strained by 1.9%; (c)―Strained by 9.3%
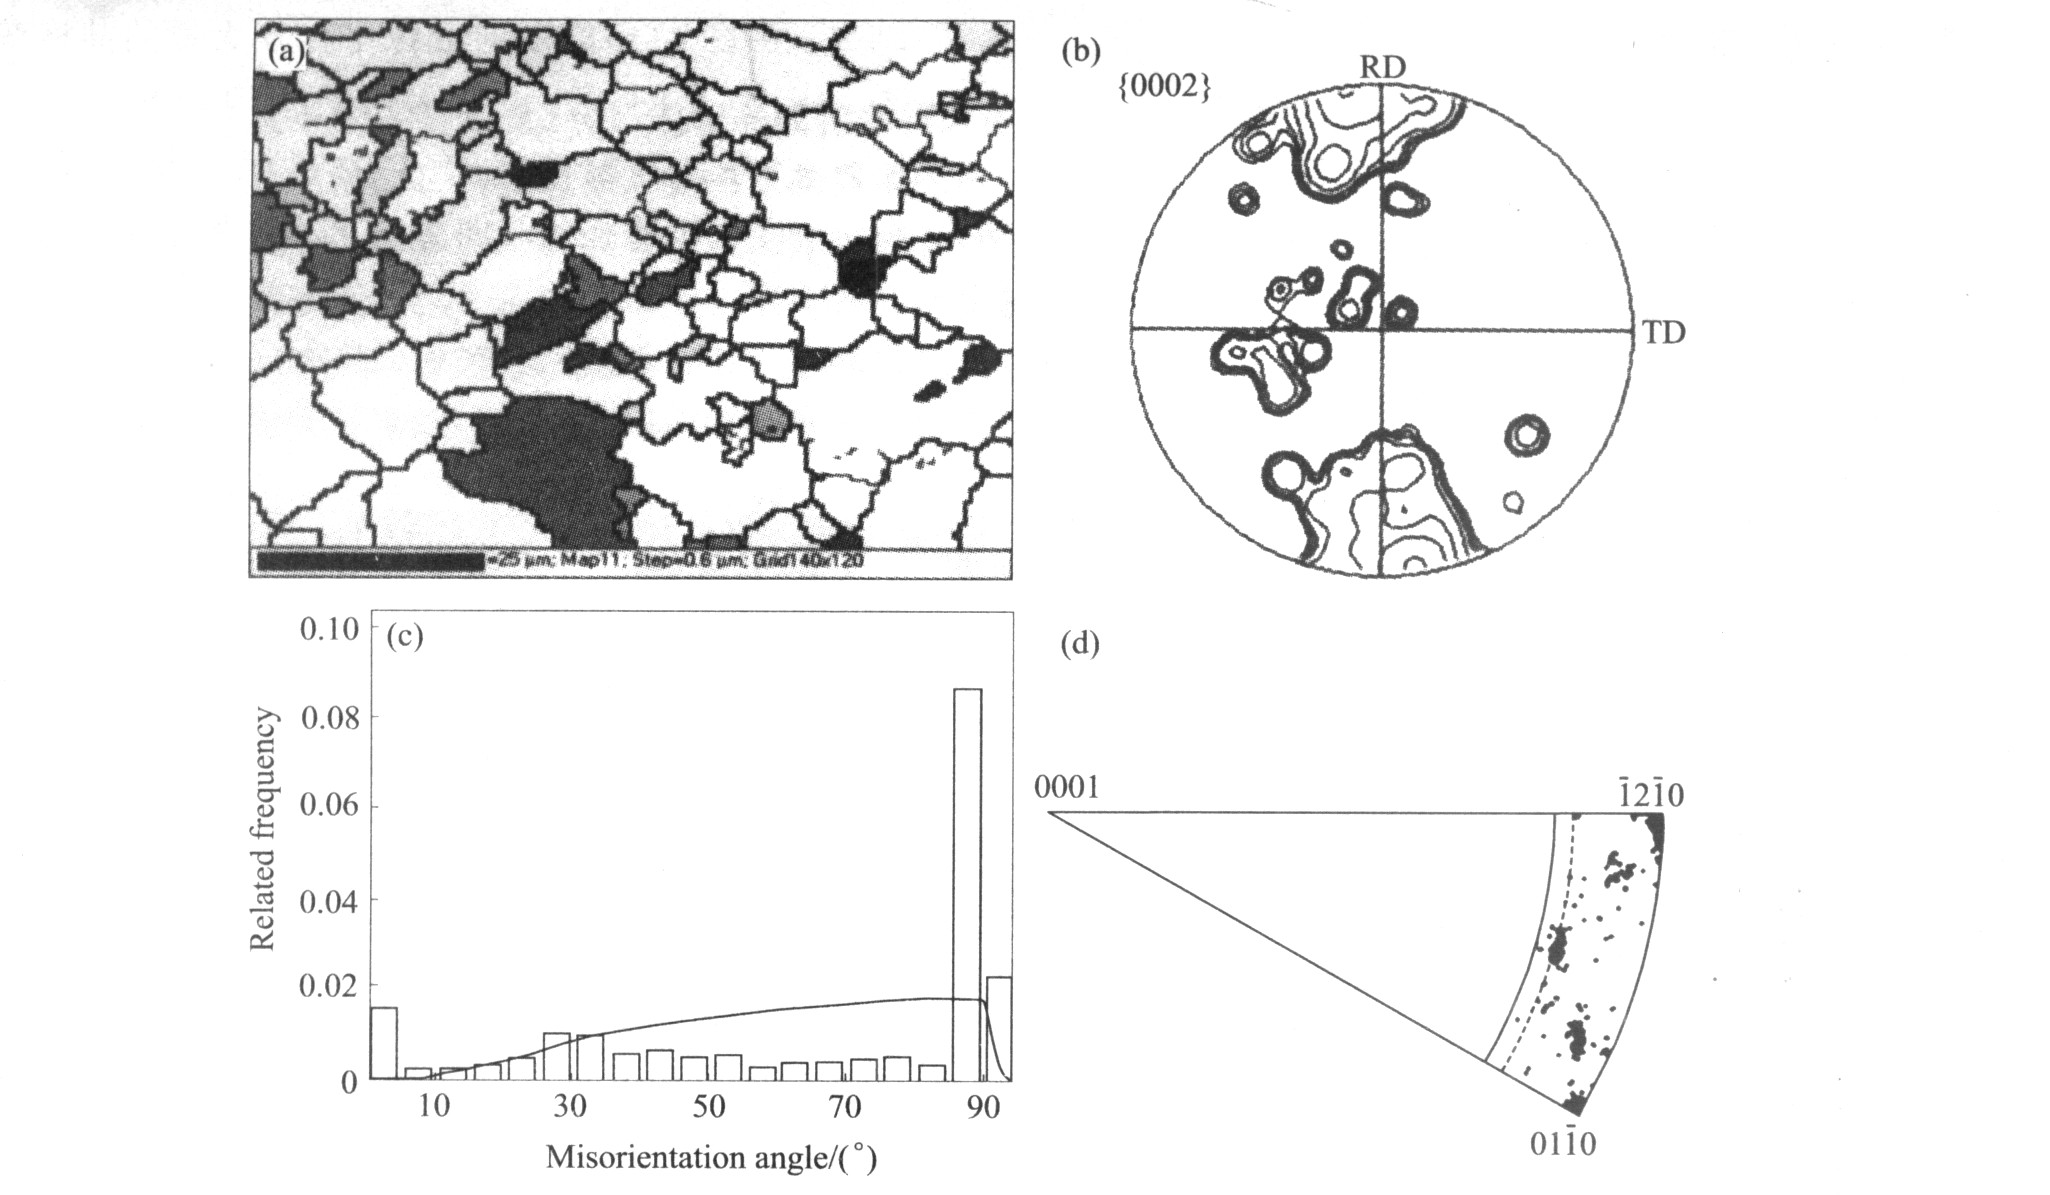
图3 应变0.5%后的取向成像分析
Fig.3 Orientation mapping on 0.5% strained sample (a)―Orientation mapping; (b)―{0002} pole figure; (c)―Misorientation distribution; (d)―Distribution of rotation axes at 80°~90°
图4 样品应变为1.9%时的取向成像分析
Fig.4 Orientation mapping on 1.9% strained sample (a)―Orientation mapping; (b)―{0002} pole figure; (c)―Misorientation distribution; (d)―Distribution of rotation axes at 80°~90°
图5 样品应变9.3%时的取向成像分析
Fig.5 Orientation mapping on 9.3% strained sample (a)―Orientation mapping; (b)―{0002} pole figure; (c)―Misorientation distribution; (d)―Distribution of rotation axes at 80°~90°
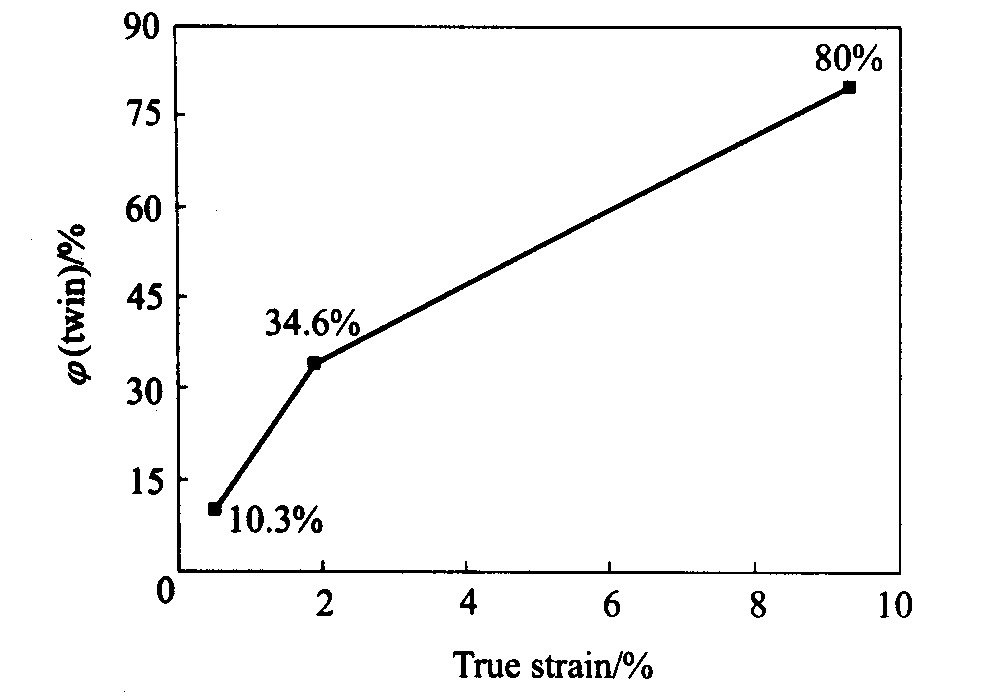
图6 应变量与基面织构所占比例的关系
Fig.6 Relationship of strain amount with volume fraction of basal-oriented grains