

Trans. Nonferrous Met. Soc. China 22(2012) 1064-1072
Correlation between welding and hardening parameters of friction stir welded joints of 2017 aluminum alloy
Hassen Bouzaiene, Mohamed-Ali Rezgui, Mahfoudh Ayadi, Ali Zghal
Research Unit in Solid Mechanics, Structures and Technological Development (99-UR11-46),
Higher School of Sciences and Techniques of Tunis, Tunisia
Received 7 September 2011; accepted 1 January 2011
Abstract: An experimental study was undertaken to express the hardening Swift law according to friction stir welding (FSW) aluminum alloy 2017. Tensile tests of welded joints were run in accordance with face centered composite design. Two types of identified models based on least square method and response surface method were used to assess the contribution of FSW independent factors on the hardening parameters. These models were introduced into finite-element code ��Abaqus�� to simulate tensile tests of welded joints. The relative average deviation criterion, between the experimental data and the numerical simulations of tension-elongation of tensile tests, shows good agreement between the experimental results and the predicted hardening models. These results can be used to perform multi-criteria optimization for carrying out specific welds or conducting numerical simulation of plastic deformation of forming process of FSW parts such as hydroforming, bending and forging.
Key words: friction stir welding; response surface methodology; face centered central composite design; hardening; simulation; relative average deviation criterion
1 Introduction
Friction stir welding (FSW) is initially invented and patented at the Welding Institute, Cambridge, United Kingdom (TWI) in 1991 [1] to improve welded joint quality of aluminum alloys. FSW is a solid state joining process which was therefore developed systematically for material difficult to weld and then extended to dissimilar material welding [2], and underwater welding [3]. It is a continuous and autogenously process. It makes use of a rotating tool pin moving along the joint interface and a tool shoulder applying a severe plastic deformation [4].
The process is completely mechanical, therefore welding operation and weld energy are accurately controlled. Basing on the same welding parameters, welding joint quality is similar from a weld to another.
Approximate models show that FSW could be successfully modeled as a forging and extrusion process [5]. The plastic deformation field in FSW is compared with that in metal cutting [6-8]. The predominant deformation during FSW, particularly in vicinities of the tool, is expected to be simple shear, and parallel to the tool surface [9]. When the workpiece material sticks to the tool, heat is generated at the tool/workpiece contact due to shear deformation. The material becomes in paste state favoring the stirring process within the thermomechanically affected zone, causing a large plastic deformation which alters micro and macro structure and changes properties in polycrystalline materials [10].
The development of the mechanical behavior model, of heterogeneous structure of the welded zone, is based on a composite material approach, therefore it must takes into account material properties associated with the different welded regions [11]. The global mechanical behavior of FSW joint was studied through the measurement of stress strain performed in transverse [12,13] and longitudinal [14] directions compared with the weld direction. Finite element models were also developed to study the flow patterns and the residual stresses in FSW [15]. Based on all these models, numerical simulations were performed in order to investigate the effects of welding parameters and tool geometry on welded material behaviors [16] to predict the feasibility of the process on various shape parts [17].
However, the majority of optimization studies of the FSW process were carried out without being connected to FSW parameters.
In the present study, from experimental and modeling standpoint, the mechanical behavior of FSW aluminum alloy 2017 was examined by performing tensile tests in longitudinal direction compared with the weld direction. It is a matter of identifying the material parameters of Swift hardening law [18] according to the FSW parameters, so mechanical properties could be predicted and optimized under FSW operating conditions. The strategy carried out rests on the response surface method (RSM) involving a face centered central composite design to fit an empirical models of material parameters of Swift hardening law. RSM is a collection of mathematical and statistical technique, useful for modeling and analysis problems in which response of interest is influenced by several variables; its objective is to optimize this response [19]. The diagnostic checking tests provided by the analysis of variance (ANOVA) such as sequential F-test, Lack-of-Fit (LoF) test, coefficient of determination (R2), adjusted coefficient of determination ( ) are used to select the adequacy models [20].
2 Experimental
2.1 Welding process
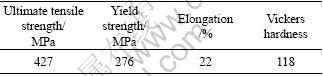
The aluminum alloy 2017 chosen for investigation has good mechanical characteristics (Table 1), excellent machinability and formability, and is mostly used in general mechanics applications from high strength suitable for heavy-duty structural parts.
Table 1 Mechanical properties of aluminum alloy 2017
The experimental set up used in this study was designed in Kef Institute of Technology (Tunisia). A 7.5 kW powered universal mill (Momac model) with 5 to 1700 r/min and welding feed rate ranging from 16 to 1080 mm/min was used. Aluminum alloy 2017 plate of 6 mm in thickness was cut and machined into rectangular welding samples of 250 mm��90 mm. Welding test was performed using two samples in butt-configuration, in contact along their larger edge, fixed on a metal frame which was clamped on the machine milling table.
To ensure the repeatability of the FSW process, clamping torque and flatness surface of the plates to be welded are controlled for each welding test. At the end of welding operation, around 80 s are respected before the withdrawal of the tool and the extracting of the welded parts.
In this experimental study, we purpose to screen the effects of three operating factors, i.e. tool rotational speed N, tool welding feed F and diameter ratio r, on hardening parameters from Swift��s hardening law such as strength coefficient (k), initial yield strain (��0) and hardening exponent (n). The ratio (r=d/D) of pin diameter (d) to shoulder diameter (D), is intended to optimize the tool geometry [21-23]. The welding tool is manufactured from a high alloy steel (Fig. 1).
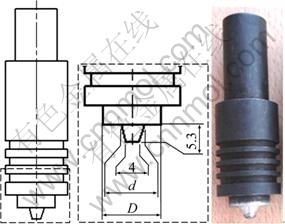
Fig. 1 FSW tool geometry (mm)
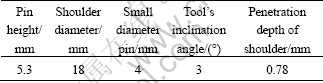
Preliminary welding tests were performed to identify both higher and lower levels of each considered factors. These limits are fixed from visual inspections of the external morphology and cross sections of the welded joints with no macroscopic defects such as surface irregularities, excessive flash, and lack of penetration or surface-open tunnels. However, among these limits one is not sure to have a safe welded joint so often, but they show great potential on defect avoidance. Figure 2 shows some external macroscopic defects observed beyond the limit levels established for each factor. Table 2 lists the processing factors as well as levels assigned to each, and Table 3 shows the fixed levels for other factors needed to success the welding tests.
A face centered central composite design, which comes under the RSM approach, with three factors was used to characterize the nature of the welded joints by determining hardening parameters. In this design the star points are at the center of each face of the factorial space (��=��1), all factors are run at three levels, which are -1, 0, +1 in term of the coded values (Table 4). The experiment plan has been run in random way to avoid systematic errors.
2.2 Tensile tests
The tensile tests are performed on a Testometric��s universal testing machines FS-300 kN. The tensile test specimens (ASME E8M-04) proposed for characterizing the mechanical behavior of the FSW joint, were cut in longitudinal direction compared with the weld direction, so that active zone is enclosed in the central weld zone (Fig. 3). Figure 4 shows the tensile specimens after fracture.
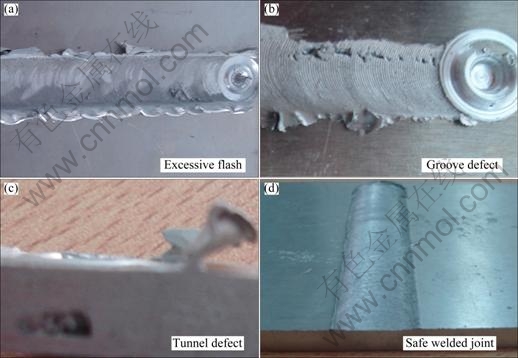
Fig. 2 Types of macroscopic defects
Table 2 Levels for operating parameters for FSW process
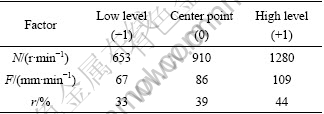
Table 3 Welding parameters
Ultimately, it is a matter of experimental evaluation of hardening parameters of the behavior of FSW joints (k, ��0, n) according to Swift��s hardening law:
 (1)
(1)
These parameters are required to identify the plastic deformation aptitude of the FSW joints. They are also needed for numerical simulations of forming operations on welded plates. The hardening parameters have been calculated by least square method (LSM) from the stress��strain curves data. Table 4 shows the experimental design as well as dataset performance characteristics according to the FSW parameters of aluminum Alloy 2017.
3 Experimental results
3.1 Development of mathematical models
Although the basic principles of FSW are very simple, it involves complex phenomena related to thermo-mechanical and metallurgical transformation that causes strong microstructural heterogeneities in the welded zone. From an energy standpoint, welding process is generated by converting mechanical energy provided by FSW tool into other types of energy such as heat, plastic deformation and microstructural transformations. The nonlinear character of these different dissipation forms can justify research for nonlinear prediction models whose accuracy generally depends on the order of the models relating the responses to welding parameters. For this reason, we chose the RSM which is helpful in developing a suitable approximation for the true functional relationships between quantitative factors (x1, x2, ��, xk) and the response surface or response functions Y (k, ��0, n) that may characterize the nature of the welded joints as follows:
 (2)
(2)
Table 4 Face centered central composite design for FSW of aluminum alloy 2017
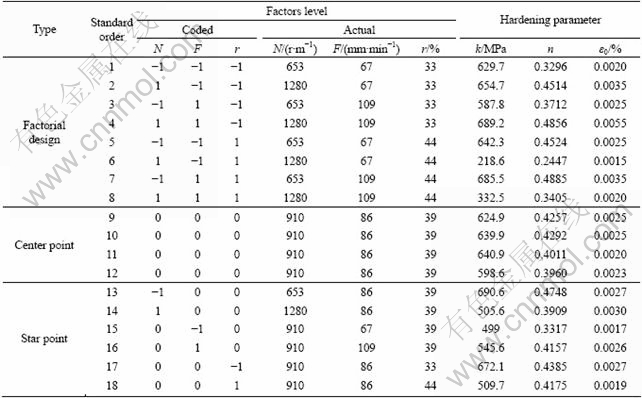
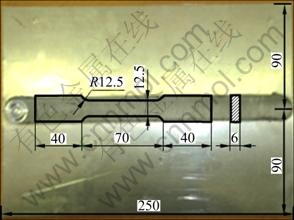
Fig. 3 Tensile test specimens (ASME E8M-04) cut in longitudinal direction compared with weld direction (mm)
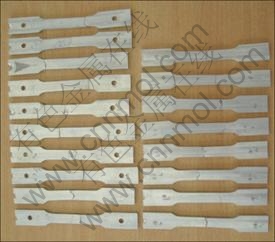
Fig. 4 Tensile specimens after fracture
The residual error term (er) measures the experimental errors. Such relationship was developed as quadratic polynomial under multiple regression form [19,20]:
 (3)
(3)
where b0 is an intercept or the average of response; bi, bii, and bij represent regression coefficients. For the three factors, the selected polynomial could be expressed as:

 (4)
(4)
In applying the RSM, the independent variable Y was viewed as surface to which a mathematical model was fitted. The adequacy of the developed model was tested using the analysis of variance (ANOVA) which quantifies the amount of variation in a process and determines if it is significant or is caused by random noise.
3.2 Mathematic model of hardening parameters
Table 5 lists the coefficients of the best linear regression models. All selected parameters (N, F, r) for k and ��0 are statistically significant (P-value less than 0.05) at the 95% confidence level. However, for the response n, the term b3r having a P-value=0.0654>0.05 is not statistically significant at the 95% confidence level even though the term b13Nr is statistically significant. Consequently, b3(r) is kept in the model to improve the Lack-of-Fit test (Table 6). Furthermore, only the interaction (N-r) is statistically significant on the three responses (Fig. 5). According to the adjusted R2 statistic, the selected models explain 94.19%, 89.21% and 89.86% of the variability in k, n and ��0 respectively.
Table 5 Coefficients of regression models for hardening parameters
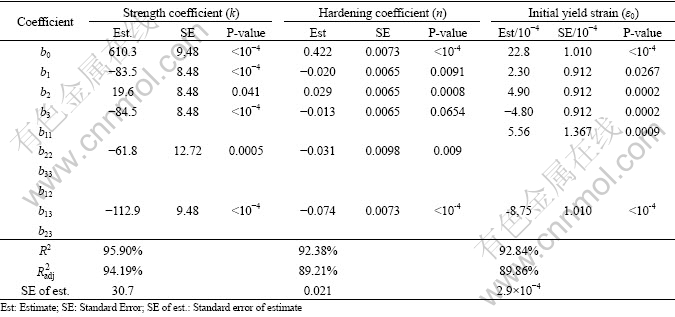
Table 6 ANOVA for hardening parameters

The ANOVA (Table 6) for the hardening parameter shows that all models (k, n, ��0) represent statistically significant relationships between the variables in each model at the 99% confidence level (P-value<10-4). The Lack-of-Fit test confirms that these models (k, n, ��0) are adequate to describe the observed data (P-value>0.05) at the 95% confidence level. The DW statistic test indicates that there is probably not any serious autocorrelation in their residuals (DW-value>1.4). The normal probability plots of the residuals suggest that the error terms, for these models, are indeed normally distributed (Fig. 6). The response surface models in terms of coded variables (Eqs. (5)-(7)) are shown in Fig. 7.
k=610.3�C83.5 N+19.6 F�C84.5 r �C61.8 F2�C112.9 Nr (5)
n=0.422�C0.020 N+0.029 F�C0.013 r�C0.031 F2�C0.074 Nr(6)
��0=22.8+2.3 N+4.90 F�C4.80 r+5.56 N2�C8.75 Nr (7)
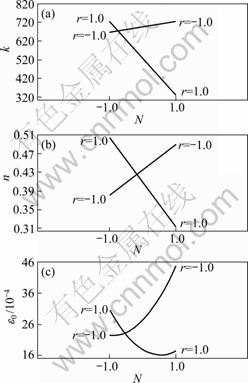
Fig. 5 Interaction plots of N-r (rotational speed-diameter ratio): (a) Strength coefficient k; (b) Hardening coefficient n; (c) Initial yield strain ��0
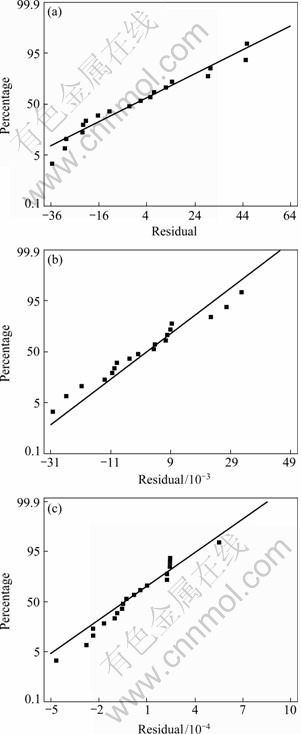
Fig. 6 Normal probability plots for residual: (a) Strength coefficient k; (b) Hardening coefficient n; (c) Initial yield strain ��0
4 Validation of identified models
Validation tests of the identified models were performed through comparative study between the experimental models (EM) of tensile tests and the computed responses given by numerical simulations of the same tests (Fig. 8). The computed responses, expressed in the form of tension and elongation, were established by examining welded joints having an elastoplastic behavior in accordance with the Swift hardening law (Eq. (1)). These computed responses were deduced from the numerical simulations using the finite element code Abaqus/Implicit, in which the introduced elastoplastic behavior was obtained from the least square hardening models (LSHM) (Table 4) and the response surface hardening models (RSHM) (Table 5). The highest deviations (<10%), between EM and computed response, were recorded with the RSHM. Increasing deviations, as shown in Fig. 8, is due to the effect of combining damage with plastic strains accumulated during the onset of localized necking.
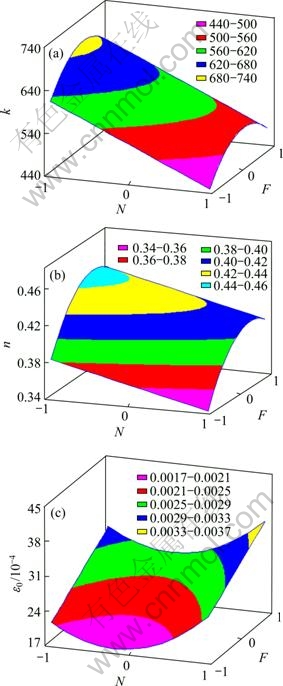
Fig. 7 Response surfaces plots: (a) Strength coefficient k; (b) Hardening coefficient n; (c) Initial yield strain ��0
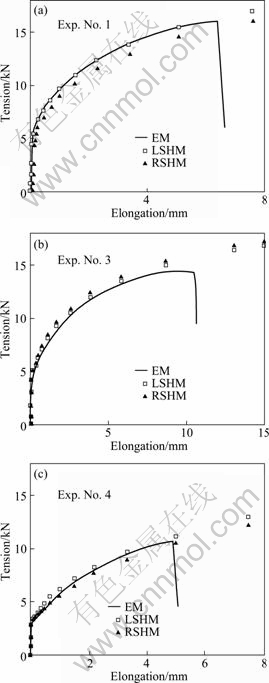
Fig. 8 Relationship between tension and elongation: Confrontation between experimental model (EM), and computed responses (LSHM, RSHM) for three experimental tests
The relative average deviation criterion ( ) between the experimental data and the numerical predictions of tensions, was used to assess the quality of the identified models.
 (8)
(8)
where N is the number of experimental measurements, Fexp(��Li) and Fnum(��Li) are respectively the experimental and predicated tensions relating to the i-th elongation ��Li. Figure 9 illustrates that the relative average deviation of EM/LSHM () ranges between 1.64% and 6.75% while the relative average deviation of EM/RSHM ( ) ranges between 4.52% and 9.32%.
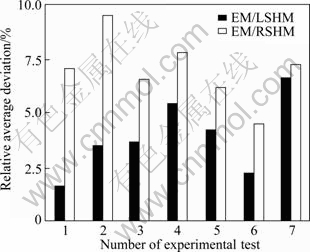
Fig. 9 Distribution of relative average deviations for most representative experimental tests
For the deviation within limits fluctuating between 4.52% and 6.75% the estimated models (LSHM and RSHM) are comparable. This applies particularly to welded joints characterized by a strength coefficient (k), ranging from 520 to 610 MPa and a hardening exponent (n) ranging between 0.30 and 0.45.
5 Discussion
In this study we evaluated, using RSM, the effect of FSW parameters such as tool rotational speed, welding feed rate and diameter ratio of pin to shoulder on the plastic deformation aptitudes of welded joints. The performed analysis highlights the incontestable significant effects of rotational speed (N), welding feed rate (F) and the interaction (N-r) between rotational speed and diameters ratio on hardening parameters (k, n, ��0) according to Swift law. The established models show that tool diameter ratio has a linear effect only on (k) and (��0), it does not have any quadratic effect. They also show that rotational speed has a quadratic effect solely on (��0); while welding feed rate has a quadratic effect on both (k) and (n).
In addition, numerical simulation of tensile tests of welded joints has been made possible through the predictive models (LSHM and RSHM) of Swift��s hardening parameters. To judge whether the models represent correctly the data, a comparative study between the experimental response and the computed response, expressed in terms of tension-elongation, was carried out. It was found that the relative average deviation between experimental model and numerical models is less than 9.5% in all cases.
Moreover, correlation between welding and hardening parameters provided has many benefits. The correlation relationships can solve inverse problem relating to optimal choice of parameters linked up with the desired welded joints properties to produce welds having tailor-made mechanical properties. The correlation predictions offer the possibility to identify the behavior of friction stir welded joints necessary for finite element simulations of various forming processes while minimizing experimental cost and time. Ultimately, understanding correlations can be useful for studies on reliability of welded assemblies in service life expectancy.
6 Conclusions
1) Rotational speed and welding feed rate are the factors that have greater influence on hardening parameters (k, n, ��0), followed by diameter ratio that has no influence on the hardening coefficient (n).
2) The numerical models RSHM were compared with those through LSHM and confronted to the experimental results. Indeed, within the limit of a relative average deviation of about 9.3%, between the experimental model and numerical models expressed in terms of tension-elongation, the validity of these models is acceptable.
3) The predictive models of work-hardening coefficients, established taking into account the FSW parameters, have made possible the numerical simulation of tensile tests of FSW joints. These results can be used to perform multi-criteria optimization for producing welds with specific mechanical properties or conducting numerical simulation of plastic deformation of forming process of friction stir welded parts such as hydroforming, bending and forging.
References
[1] THOMAS W M, NICHOLAS E D, NEEDHAM J C, MURCH M G, TEMPLE-SMITH P, DAWES C J. Friction stir butt welding, PCT/GB92/ 02203 [P]. 1991.
[2] Xue P, Ni D R, Wang D, Xiao B L, Ma Z Y. Effect of friction stir welding parameters on the microstructure and mechanical properties of the dissimilar Al-Cu joints[J]. Materials Science and Engineering A, 2011, 528: 4683-4689.
[3] Liu H J, Zhang H J, Yu L. Effect of welding speed on microstructures and mechanical properties of underwater friction stir welded 2219 aluminum alloy [J]. Materials and Design, 2011, 32: 1548-1553.
[4] Mishra R S, Ma Z Y. Friction stir welding and processing [J]. Materials Science and Engineering R, 2005, 50: 1-78.
[5] Arbegast W J. A flow-partitioned deformation zone model for defect formation during friction stir welding [J]. Scripta Materialia, 2008, 58: 372-376.
[6] LEWIS N P. Metal cutting theory and friction stir welding tool design [M]. NASA Faculty Fellowship Program Marshall Space Flight Center, University of ALABAMA, NASA/MSFC Directorate: Engineering (ED-33), 2002.
[7] Arbegast W J. Modeling friction stir welding joining as a metalworking process, hot deformation of aluminum alloys III [C]. San Diego: TMS Annual Meeting, 2003: 313-327.
[8] Arthur C N Jr. Metal flow in friction stir welding [R]. NASA marshall space flight center, EM30. Huntsville, AL 35812.
[9] Fonda R W, Bingert J F, Colligan K J. Development of grain structure during friction stir welding [J]. Scripta Materialia, 2004, 51: 243-248.
[10] Nandan R, DebRoy T, Bhadeshia H K D H. Recent advances in friction stir welding��Process, weldment structure and properties [J]. Progress in Materials Science, 2008, 53: 980-1023.
[11] Lockwood W D, Tomaz B, Reynolds A P. Mechanical response of friction stir welded AA2024: Experiment and modeling [J]. Materials Science and Engineering A, 2002, 323: 348-353.
[12] Salem H G, Reynolds A P, Lyons J S. Microstructure and retention of superplasticity of friction stir welded superplastic 2095 sheet [J]. Scripta Materialia, 2002, 46: 337-342.
[13] Lockwood W D, Reynolds A P. Simulation of the global response of a friction stir weld using local constitutive behavior [J]. Materials Science and Engineering A, 2003, 339: 35-42.
[14] Sutton M A, Yang B, Reynolds A P, Yan J. Banded microstructure in 2024�CT351 and 2524-T351 aluminum friction stir welds, Part II. Mechanical characterization [J]. Materials Science and Engineering A, 2004, 364: 66-74.
[15] Zhang H W, Zhang Z, Chen J T. The finite element simulation of the friction stir welding process [J]. Materials Science and Engineering A, 2005, 403: 340-348.
[16] Zhang Z, Zhang H W. Numerical studies on controlling of process parameters in friction stir welding [J]. Journal of Materials Processing Technology, 2009, 209: 241-270.
[17] Buffa G, Fratini L, Shivpuri R. Finite element studies on friction stir welding processes of tailored blanks [J]. Computers and Structures, 2008, 86: 181-189.
[18] Swift H W. Plastic instability under plane stress [J]. Journal of the Mechanics and Physics of Solids, 1952, 1: 1-18.
[19] Montgomery D C. Design and analysis of experiments [M]. Fifth Edition. New York: John Wiley & Sons, 2001: 684.
[20] Myers R H, Montgomery D C, Anderson-Cook C M. Response surface methodology: Process and product optimization using designed experiment [M]. 3rd Edition. New York: John Wiley & Sons, 2009: 680.
[21] Vijay S J, Murugan N. Influence of tool pin profile on the metallurgical and mechanical properties of friction stir welded Al�C10% TiB2 metal matrix composite [J]. Materials and Design, 2010, 31: 3585-3589.
[22] Elangovan K, Balasubramanian V. Influences of tool pin profile and tool shoulder diameter on the formation of friction stir processing zone in AA6061 aluminum alloy [J]. Materials and Design, 2008, 29: 362-373.
[23] Palanivel R, Koshy Mathews P, Murugan N. Development of mathematical model to predict the mechanical properties of friction stir welded AA6351 aluminum alloy [J]. Journal of Engineering Science and Technology Review, 2011, 4(1): 25-31.
2017���Ͻ����Ħ������ͷ����
������Ӳ�������Ĺ�ϵ
Hassen Bouzaiene, Mohamed-Ali Rezgui, Mahfoudh Ayadi, Ali Zghal
Besearch Unit in Solid Mechanics, Structures and Technological Development (99-UR11-46),
Higher School of Sciences and Techniques of Tunis, Tunisia
ժ Ҫ����2017���Ͻ���н���Ħ�����ӣ�����SwiftӲ�����ɡ��������ĸ�����Ʒ������к��ӽ�ͷ������ʵ����ơ����û�����С���˷�����Ӧ�淨��2��ģ����������Ħ�������������ض�Ӳ��������Ӱ�졣���õ�����Ԫ����Abaqus��ģ�⺸�ӽ�ͷ������Խ�������ƽ��ƫ���оݽ��������ʵ������ģ�����ǺϽϺá���Щ���������ʵ���Ŀ���Ż���ʵ�о��庸�ӻ���ɽ���Ħ������������ι��������Ա��ε���ֵģ�⣬��Һѹ���Ρ������ȺͶ��졣
�ؼ��ʣ�����Ħ�����ӣ���Ӧ�淽�����������ĸ�����ƣ�Ӳ����ģ�⣻���ƽ��ƫ���о�
(Edited by LI Xiang-qun)
Corresponding author: Mohamed-Ali REZGUI; E-mail: mohamedali.rezgui@gmail.com
DOI: 10.1016/S1003-6326(11)61284-3

