J. Cent. South Univ. Technol. (2009) 16: 0558-0562
DOI: 10.1007/s11771-009-0093-4

Alkaline treatment kinetics of calcium phosphate by piezoelectric quartz crystal impedance
ZENG Li-ping(曾丽萍)1, 2, HE De-liang(何德良)1, 2, XU Chao(许 超)2, LUO Sheng-lian(罗胜联)1, 2
(1. State Key Laboratory for Chemo/Biological Sensing and Chemometrics,
Hunan University, Changsha 410082, China;
2. College of Chemistry and Chemical Engineering, Hunan University, Changsha 410082, China)
Abstract: Calcium phosphate film was prepared by electrochemical deposition technology. Subsequently, the alkaline treatment process of calcium phosphate film in 0.1 mol/L NaOH solution was monitored on real time by the piezoelectric quartz crystal impedance (PQCI) technique. The variations of morphology and composition for the alkaline treatment products were characterized by scanning electron microscopy (SEM), Fourier transform infrared (FT-IR) and X-ray diffraction (XRD), respectively. The dynamic variations of calcium phosphate can be characterized by the change of equivalent circuit parameters. The results show that the forming process of hydroxyapatite (HA) is composed of three stages: (1) acidic calcium phosphate dissolution; (2) phase transformation; and (3) HA formation. Furthermore, the correlative kinetic equations and parameters are obtained by fitting the static capacitance (Cs)―time curves.
Key words: hydroxyapatite; calcium phosphate; piezoelectric quartz crystal impedance; alkaline treatment; kinetics
1 Introduction
Calcium phosphate coating is an important bioceramic material in biomedical application. Hydroxyapatite (HA, Ca10(PO4)6(OH)2) mineral component is similar to bone and teeth of the human body. Due to its biocompatibility and bioactivity, the porous HA has been used as a scaffold in bone tissue engineering for the rapid repair in larger defects [1-3]. A few methods were developed, in which calcium phosphate was converted into hydroxyapatite, such as hydrothermal treatment [4-5], sintering [6-8] and alkaline treatment [9-10]. The alkaline treatment has been investigated in recent years, as a low temperature, simple process and easy application. SILVA et al [9] reported the conversion from monetite to hydroxyapatite in different alkaline solutions, and pointed out the transformation was a dissolution-reprecipitation process. SHIH et al [10] studied the effect of NaOH solution treatment on the phase transformation and morphology of calcium phosphate, and found that calcium phosphate deposit could be converted into HA phase by NaOH treatment. LIU et al [11] investigated the kinetics of hydroxyapatite precipitation at pH 10 to 11 by FT-IR and XRD, and inferred that the process of transformation from amorphous calcium phosphate (ACP) to HA was a surface control process.
However, the transformation of calcium phosphates is a complicated process. The traditional evaluation of transformation is mainly based on the static characterization structure and morphologies of calcium phosphates by FT-IR, and XRD and SEM, and a few real time kinetic investigations have been reported before. The main objective of this work is to investigate the real time kinetic process of the phase transformation of calcium phosphates in NaOH solution. The piezoelectric quartz crystal impedance (PQCI) was used to determine the phase transformation during the alkaline treatment of calcium phosphates film, thereby various parameters of the PQCI were obtained and used to analyze the kinetics of the alkaline treatment process. And variations of the morphology and composition of calcium phosphates film were characterized by using SEM, FT-IR and XRD, respectively.
2 Experimental
Calcium phosphate film was electrodeposited on one gold electrode of the AT-cut quartz crystals (8 MHz, d=8 mm). Electrodeposition was carried out at 0.6 mA/cm2 and 60 ℃ for 1 h. The electrolyte was 4.2 mmol/L of Ca(NO3)2 and 2.5 mmol/L of (NH4)2HPO4 with the molar ratio of Ca to P as 1.67. The pH of the electrolyte was adjusted to 4.4 by acetic acid solution (1% acetic acid, 1% chitosan (Mw=2×10⁵)) and hydro-
chloric acid solution. After deposition, the sample was washed with distilled water, and then air-dried.
To study the alkaline treatment process of calcium phosphates, the coated sample was immerged into NaOH solution (0.1 mol/L) at 60 ℃ for 3 h, and the PQCI system was used to measure the resonant frequency ( f ) and the equivalent circuit parameters on-line during the alkaline treatment process. As shown in Fig.1, the PQCI system included a HP4395A network spectrum impedance analyzer, and an IBM personal computer. A user’s program was written in visual basic (VB) 5.0 to control the HP4395A, which could measure f of the PQCI simultaneously, and could also fit the values of the Butterworth-van Dyke (BVD) equivalent circuit parameters by Gauss-Newton nonlinear least-squares. In this work, the BVD equivalent circuit parameters were obtained in 30 s intervals, including motional resistance (Rm) and static capacitance (Cs). SEM, FT-IR and XRD were used to characterize the variation of composition and morphology during the alkaline treatment of calcium phosphates.
3 Results and discussion
3.1 Changes of Df and DRm during alkaline treatment
In order to clarify the alkaline treatment process of calcium phosphate, the PQCI technique was applied to obtaining the multidimensional dynamic information. Fig.2 shows the typical responses of Df and DRm obtained simultaneously during the calcium phosphates film immersing into the NaOH solution. In Fig.2, a large increase in Df and a slight decrease in DRm can be seen during the first stage (from 0 to 40 min). Sauerbrey equation describes the frequency―mass relationship on the load and removal of a rigid and thin film, which can be used when the influence of the viscosity of solution is negligible [12-14]. A net liquid-loading effect for piezoelectric quartz crystal (PQC) with one side contacting solution can be characterized by the following equation [15]:
 (1)
(1)
where DRmL and DfL are changes in solution, and fL (the resonant frequency, and fL=1/[2π(LmCm)1/2]), μQ (2.947×10¹¹ g?cm-1?s-2) is the shear modulus of quartz, fg is the resonant in air, Lq is the motional inductance of the quartz crystal in air,  is the lossy piezoelectrically stiffened quartz elastic constant (2.957×10¹¹ g?cm-1?s-2). According to this equation, the slope of Df/DRm for a net density/viscosity effect on the 8MHz PQC resonant is about -10 Hz/?. That is to say, for an investigated system, the larger absolute value of Df/DRm results in a weaker viscous effect and a stronger mass effect. In this experiment, the absolute value of Df/DR for the first stage (from 0 to 40 min) is about 34.5 Hz/?, which is obviously large. It could be presumed that the mass effect predominates the frequency change and the effect of the viscosity of solution can be neglected. Therefore, the increase of Df during this stage is due to the acidic calcium phosphate of the unstable film dissipating into alkaline solution.
Generally, the motional resistance represents the energy dissipation of the PQC resonance into circumstance. The energy dissipation of the PQC resonance could be affected by the viscosity and density of solution, the roughness of the electrode surface and the visco-elasticity of the foreign film. Since the influence of the viscosity and density of solution can be neglected in the alkaline solution, the decrease of DRm may be resulted from the roughness change of the electrode surface in the first stage. Specifically, the dissolution of acidic calcium phosphate will result in the smoother electrode surface. Subsequently, from 40 to 110 min, the change of Df is slight, DRm continues decreasing, and the absolute value of Df/DRm for the second stage approximatively equals 6.8 Hz/?. This shows that the visco-elasticity of the film is influenced by the specific structure change of calcium phosphate
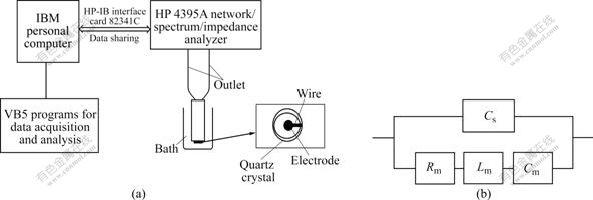
Fig.1 Schematic representation (a) and equivalent circuit (b) of PQCI system (Cs is static capacitance; Rm is motional resistance; Lm is motional inductance; and Cm is motional capacity)
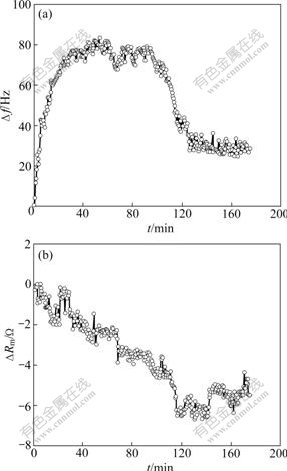
Fig.2 Time courses of simultaneous responses of Df (a) and DRm (b) during immersion of calcium phosphate film in 0.1 mol/L NaOH solution
resulted from the phase transformation.
After about 110 min, the Df decreases swiftly, but DRm increases slowly, and the absolute value of Df/DRm approximatively equals 21.3 Hz/?. It could be mainly attributed to the HA formation and adhesion to the electrode surface, which results in an increase in mass onto the electrode surface. The increase of DRm is due to the roughness increase of the electrode surface during the HA formation process. According to the change of the absolute value of Df/DRm, it is suggested the alkaline treatment process of calcium phosphates comprises three stages: (1) acidic calcium phosphates dissolution (from 0 to 40 min); (2) phase transformation (from 40 to 110 min); and (3) HA formation (from 110 to 180 min).
3.2 Change of DCs during alkaline treatment
The Cs represents the interfacial capacitance, which reflects the dielectric properties of the electrode/solution interface, namely, the effect of the structure conversion of calcium phosphate and the roughness of electrode surface. Fig.3 shows DCs obtained simultaneously when calcium phosphate film was immersed into the NaOH solution. In the first stage, the roughness variation of the electrode surface results in little decrease in DCs. In the second stage, DCs slowly increases. It is considered that the structure conversion of calcium phosphates is the main contributing factor, which results in the increase in the dielectric constant of the electrode surface. In the third stage, an increase in DCs is observed, which may be considered as the effect of dielectric constant and roughness of the electrode surface. As mentioned above, the dielectric constant of calcium phosphates is mainly influenced by the increase of DCs. According to DCs change during the alkaline immersion of calcium phosphates, it is suggested that the increase of dielectric constant is correlated with HA formation.
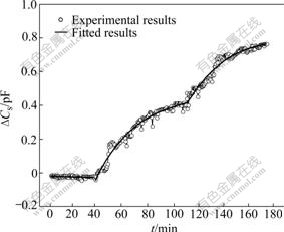
Fig.3 Time course of simultaneous responses of DCs during immersion of calcium phosphate film in 0.1 mol/L NaOH solution
The DCs―t curve is fitted at different stages by means of nonlinear regression, and the correlating kinetic equations and parameters are obtained for each stage by the following three equations respectively.
 (0≤t≤40) (2)

(40≤t≤110) (3)
 (110≤t≤180) (4)
Three equations display the change of DCs with alkaline immersion time. Eqn.(2) shows that DCs is linear with a slight decrease because of the dissolution of the acidic calcium phosphate in the first stage. Eqn.(3) shows that DCs displays exponential growth with phase transformation of calcium phosphates in the second stage. Eqn.(4) explains that DCs displays sigmoidal growth with HA formation. Furthermore, the morphology and composition of calcium phosphates in three different stages have different characteristics and have been examined by SEM, FT-IR and XRD.
3.3 Morphology characterization of HA formation
Fig.4 shows the SEM images of samples on the PQC chip soaking in NaOH solution at 60 ℃ for 40, 110 and 180 min, respectively. SEM micrographs are of the same magnification in order to compare the crystal size and shape of calcium phosphates. In Fig.4, the plate-like calcium phosphate crystals disappear in the first stage, then the floccule-like ones exhibit, and finally chrysanthemum-like HA crystals appear. This shows that dissolution-transformation-formation process may occur. The difference of the morphology shows the roughness change of the electrode surface. Fig.4 also indicates that the alkaline treatment process includes three stages: it is
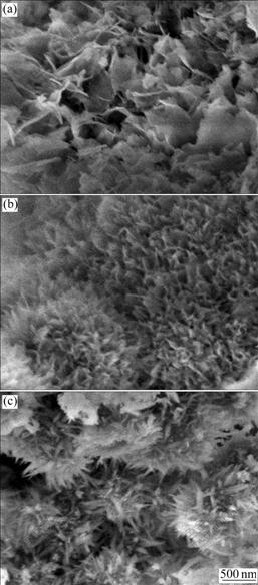
Fig.4 SEM images of calcium phosphate film alkaline-treated in NaOH solution at 60 ℃ for different time: (a) 40 min; (b) 100 min; (c) 180 min
found that in the first 40 min of soak, the unstable film of acid calcium phosphate dissolves slowly. With increasing time of immersion, calcium-deficient hydroxyapatite (DAP) and HA start to form, and film is more compact. After about 110 min, DAP, a non-stoichiometric material, converts to HA and HA reprecipitate. It explains that roughness and visco-elasticity of the film influence structure change of calcium phosphates.
3.4 FT-IR and XRD structure characterization of HA
FT-IR spectrometry is a reliable tool on structural investigation at molecular level. Fig.5 shows the FT-IR spectra of specimens on the PQC chip with soaking in NaOH solution at 60 ℃ for 40, 100, and 180 min, respectively. The peaks at 1 225 and 878 cm-1 are considered to be the vibration signatures for HPO42- [16-18], and the O―H stretching vibration peak of water at 3 646 cm-1 can be seen in Fig.5(a), which shows the residual of dicalcium phosphate dihydrate (DCPD, CaHPO4?2H2O) and a little formation of octacalcium phosphate (OCP, Ca8H2(PO4)6?5H2O). At 633 and 3 570 cm-1, the peaks of OH- are strengthened along with time, while the peak of HPO42- is present at first and then disappears (Fig.5(b)). Thus, it can be inferred that a little non-stoichiometric (calcium-deficient hydroxyapatite (DAP, Ca10-z(HPO4)z(PO4)6-z(OH)2-z?nH2O, 0≤z≤1)) is formed [17-18]. From Fig.5(c), a significant concentration of hydroxyl groups at 3 570 and 633 cm-1, and phosphate groups at 571, 604, 962, 1 051 and 1 093 cm-1 representing O―P―O bending vibration are observed [19-20], which indicates the presence of the HA phase. DAP has radicals of OH- and HPO42-, while HA has no radical of HPO42- and its peak of OH- is greater than that of DAP.
In order to confirm this inference, the samples at various time were analyzed by X-ray diffraction. Fig.6 shows the XRD patterns of the samples alkaline-treated
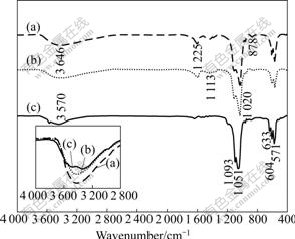
Fig.5 FT-IR spectra of calcium phosphate film alkaline-treated at 60 ℃ for different time: (a) 40 min; (b) 110 min; (c) 180 min
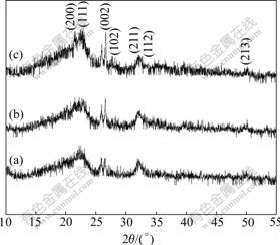
Fig.6 XRD patterns of samples alkaline-treated with NaOH solution at 60 ℃ for different time: (a) 40 min; (b) 110 min; (c) 180 min
with NaOH solution at 60 ℃ for 40, 100 and 180 min, respectively. The broadened reflections reveal a nano-sized distribution of the HA crystallites. The sample treated in the 0.1 mol/L NaOH solution at 60 ℃ for 40 min has some residual DCPD phase at low angles, which disappears gradually as the NaOH immersion time increases. The (211) and (112) reflections are overlapped in the two initial stages, which is resulted from composition of DAP and OCP. However, the (211) and (112) reflections split in the last stage, which shows the formation of HA crystallites. The (002) reflection gradually gets sharp with the increase of the NaOH immersion time, which also means the maturation of HA crystallites. The results of FT-IR and XRD show that the composites of calcium phosphates are different at various time of alkaline treatment.
4 Conclusions
(1) PQCI analysis, as a real-time technique, is used to monitor the alkaline treatment process of calcium phosphates. According to the data of PQCI and the results of SEM, FT-IR and XRD, the process involves three stages: (1) acidic calcium phosphate dissolution (from 0 to 40 min); (2) phase transformation (from 40 to 110 min); and (3) HA formation (from 110 to 180 min).
(2) The DCs―t curve is fitted at the each stage, and the correlative kinetic equations and parameters are obtained respectively. The change of DCs is mainly influenced by structure conversion of calcium phosphate, which results in an increase in the dielectric constant of the electrode surface. The dielectric constant is in correlation with the hydroxyl in calcium phosphates.
References
[1] DARIMONT G L, CLOOTS R, HEINEN E, SEIDEL L, LEGRAND R. In vivo behavior of hydroxyapatite coatings on titanium implants: A quantitative study in the rabbit [J]. Biomaterials, 2002, 23(12): 2569-2575.
[2] YOSHINARI M, ODA Y, INOUE T, MATSUZAKA K, SHIMONO M. Bone response to calcium phosphate-coated and bisphosphonate- immobilized titanium implants [J]. Biomaterials, 2002, 23(14): 2879-2885.
[3] ZHAO Zhong-wei, ZHANG Gang, LI Hong-gui. Preparation of calcium phosphate coating on pure titanium substrate by electrodepsition method [J]. Journal of Central South University of Technology, 2004, 11(2): 147-151.
[4] LIU D M, CHOU H M, WU J D, TUNG M S. Hydroxyapatite formation in a thermal process [J]. Mater Chem Phys, 1994, 37(1): 39-44.
[5] HSU Y S, CHANG E, LIU H S. Hydrothermally-grow mometite(CaHPO4) on hydroxyapaptite [J]. Ceramics International, 1998, 24(4): 249-254.
[6] PRAMANIK S, KUMAR A, RAI K N, GARG A. Development of high strength hydroxyapatite by solid-state-sintering process [J]. Ceramics International, 2007, 33(3): 419-426.
[7] PATTANAYAK D K, DASH R, PRASAD R C, RAO B T, MOHAN T R. Synthesis and sintered properties evaluation of calcium phosphate ceramics [J]. Material Science and Engineering, 2007, C27(4): 684-690.
[8] ZOU Jian-peng, RUAN Jian-ming, HUANG Bai-yun, LIU Jian-bin, ZHOU Xian-xia. Physico-chemical properties and microstructure of hydroxyapatite-316L stainless steel biomaterials [J]. Journal of Central South University of Technology, 2004, 11(2): 113-118.
[9] SILVA M H, LIMA J H C, SOARES G A, ANDRADE M H, BEST S M, GIBSON I R. Transformation of monetite to hydroxyapatite in bioactive coatings on titanium [J]. Surface and Coatings Technology, 2001, 137(2/3): 270-276.
[10] SHIH W J, CHEN Y H, WANG S H, LI W L, HOU M H, WANG M C. Effect of NaOH(aq) treatment on the phase transformation and morphology of calcium phosphate deposited by an electrolytic method [J]. Crystal Growth, 2005, 285(4): 633-641.
[11] LIU Chang-sheng, HUANG Yue, SHEN Wei, CUI Jing-hua. Kinetics of hydroxyapatite precipitation at pH 10 to 11 [J]. Biomaterial, 2001, 22(4): 301-306.
[12] SAUERBREY G. The use of quartz oscillators for weighting thin layers and for microweighing [J]. Physical, 1959, 155(1): 206-212.
[13] BUTTRY D A, BARD A J. Electroanalytical chemistry: A series of advances [M]. New York: Marcel Dekker, 1991.
[14] SATO T, SERIZAWA T, OKAHATA Y. Binding of influenza A virus to monosialogangli-oside (GM3) reconstituted in glucosylceramide and sphingomyelin membranes [J]. Biochimmica et Biophysical Acta (BBA)―Biomembranes, 1996, 1285(1): 14-20.
[15] MURAMATSU H, TAMIYA E, KARUBE I. Computation of equivalent circuit parameters of quartz crystals in contact with liquids and study of liquid properties [J]. Analytical Chemistry, 1988, 60(19): 2142-2146.
[16] BAILEY R T, HOLT C. Calcified tissue [M]. Boca Raton, Florida: CRC Press, 1989: 93.
[17] BERRY E E, BADDIEL C B. The infra-red spectrum of dicalcium phosphate dihydrate (brushite) [J]. Spectrochimica Acta, 1967, 23A(7): 2089-2097.
[18] WALTERS M A, LEUNG Y C, BLUMENTHAL N C, KONSKER K A, LEGEROS R Z. A Raman and infrared spectroscopic in investigation of biological hydroxyapatite [J]. Journal of Inorganic Biochemistry, 1990, 39(3): 193-200.
[19] DASARATHY H, RILEY C, COBLE H D. Analysis of apatite deposits on substrates [J]. Biomedical Materials Research, 1993, 27(4): 477-482.
[20] GADALETA S J, PASCHALIS E P, BETTS F, MENDELSOHN R, BOSKEY A L. Fourier transform infrared spectroscopy of the solution-mediated conversion of amorphous calcium phosphate to hydroxyapatite: New correlation between X-ray diffraction and infrared data [J]. Calcif Tissue Int, 1996, 58(1): 9-16.
(Edited by YANG You-ping)
Foundation item: Project(2005CB623901) supported by the Major State Basic Research and Development Program of China
Received date: 2008-10-22; Accepted date: 2008-12-29
Corresponding author: HE De-liang, Professor; Tel: +86-731-88822286; E-mail: delianghe@163.com

