Abstract: The decomposition fraction and the particle size distribution during the precipitation process of sodium aluminate solution under different conditions with and without ultrasound were compared respectively. The experiments results indicate that while the conditions of ultrasound being kept constant, the ultrasonic effect on the precipitation process is enhanced as the concentration of sodium aluminate is reduced, and it is more significant at medium αk. The effect of physical properties of sodium aluminate on ultrasonic enhancement on the precipitation process and ultrasonic cavitation was further investigated by the detection of surface tension coefficient and image of Luminol sonofluorescence.
Effect of physical properties of sodium aluminatesolution on ultrasonic cavitation andenhancement during precipitation process
Abstract:
The decomposition fraction and the particle size distribution during the precipitation process of sodium aluminate solution under different conditions with and without ultrasound were compared respectively. The experiments results indicate that while the conditions of ultrasound being kept constant, the ultrasonic effect on the precipitation process is enhanced as the concentration of sodium aluminate is reduced, and it is more significant at medium αk. The effect of physical properties of sodium aluminate on ultrasonic enhancement on the precipitation process and ultrasonic cavitation was further investigated by the detection of surface tension coefficient and image of Luminol sonofluorescence.
Fig.1 Comparison of decomposition fraction and particle number percentage below 2 μm during precipitation process at 55 ℃ (a)―Variation of decomposition fraction η with time; (b)―Variation of particle number percentage φ below 2 μm with time
图2 8 h的分解率差Δη与ρ(Na2Ok)及αk的关系
Fig.2 Difference of decomposition fraction vs content of Na2Ok and αk at 8 h (a)―Δη vs ρ(Na2Ok); (b)―Δη vs αk
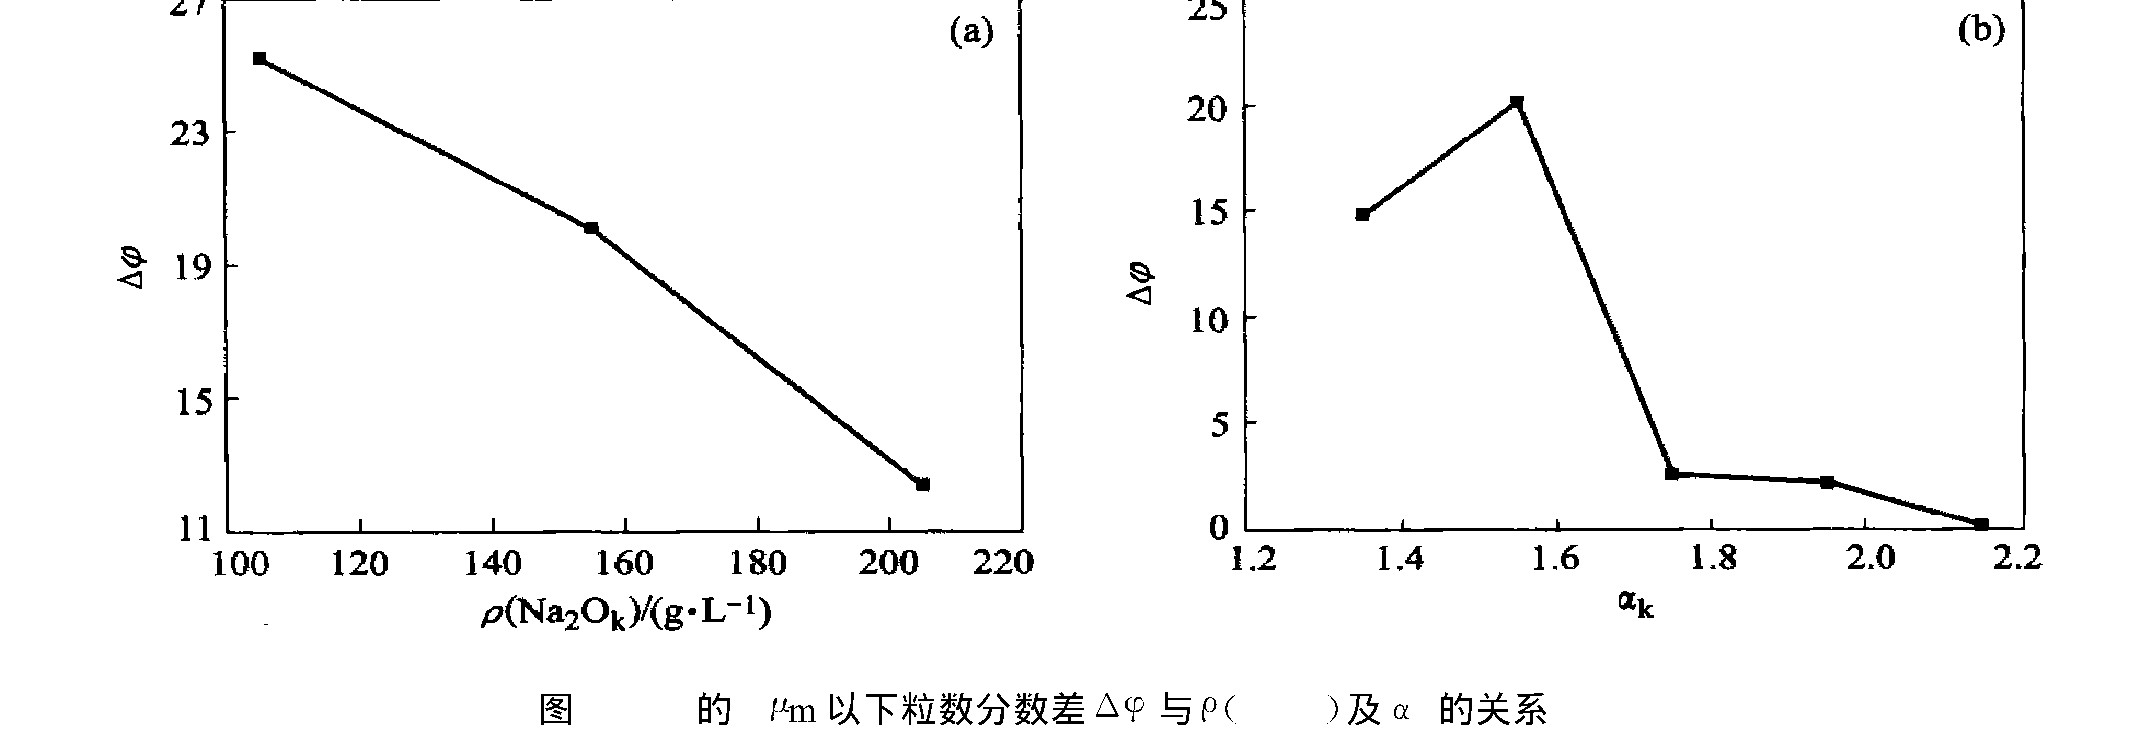
图3 8 h的2 μm以下粒数分数差Δφ与ρ(Na2Ok)及αk的关系
Fig.3 Difference of particle number percentage Δφ below 2 μm vs content of Na2Ok and αk at 8 h (a)―Δφ vs ρ(Na2Ok); (b)―Δφ vs αk
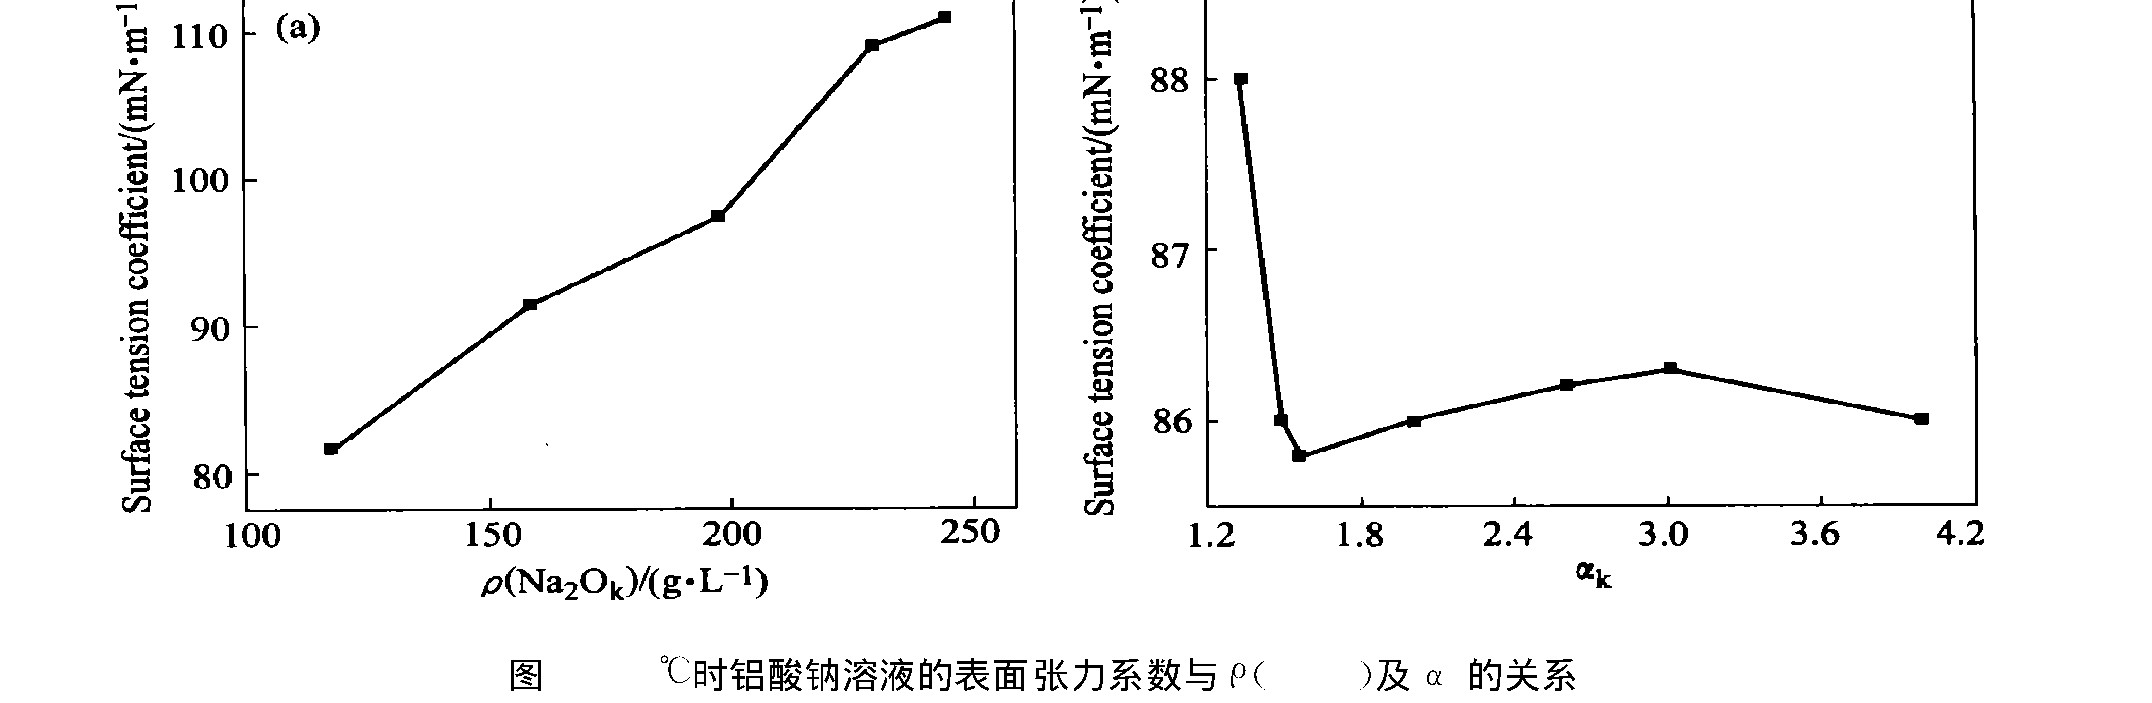
Fig.4 Surface tension coefficient of sodium aluminate vs ρ(Na2Ok) and αk (a)―Surface tension coefficient of sodium aluminate vs ρ(Na2Ok); (b)―Surface tension coefficient of sodium aluminate vs αk
图5 不同条件下铝酸钠溶液的声致荧光影象
Fig.5 Sonofluorescent images of sodium aluminate solutions on different conditions (a)―αk=1.55, ρ(Na2Ok)=33 g/L; (b)―αk=1.55, ρ(Na2Ok)=330 g/L; (c)―αk=1.35, ρ(Na2Ok)=155 g/L; (d)―αk=1.55, ρ(Na2Ok)=155 g/L; (e)―αk→∞, ρ(Na2Ok)=155 g/L