��﮺Ͻ�����������ֲ������ʴ��Ϊ�ĺ�������
��Դ�ڿ����й���ɫ����ѧ��(Ӣ�İ�)2019���9��
�������ߣ����� ������ ���� ����÷
����ҳ�룺1793 - 1802
�ؼ��ʣ���﮺Ͻ𣻵�ʴ�������ࣻ�绯ѧ��Ϊ
Key words��Al-Li alloy; pitting corrosion; precipitate; electrochemical behavior
ժ Ҫ������ɨ��羵����羵�͵绯ѧ���Լ����о����Ϊ95 mm 2297��﮺Ͻ����ƺ��������ֲ�����ʴ��Ϊ�ĺ������ԡ�ͨ����������ķֲ���ʴ�ӳߴ����ͳ�Ʒ�����ö�����Ϣ����Ӧ�Ĺ�ϵ�����ƺ�岻ͬ��Ȳ��е�������ֲ��ܶȺͳߴ�����ɴ�С��˳��Ϊ1/4��Ȳ�(QS)>�����(SS)>1/2��Ȳ�(MS)���� 300 min���λ���������ƺ�岻ͬ��Ȳ������ĵ�ʴ������ʴ��������ɴ�С��˳��ΪQS>SS>MS��������庬��������϶��1/4��Ȳ���и��ߵĵ�ʴ�����ԡ�2297��﮺Ͻ����ƺ��ĵ�ʴ��Ϊ����������������ֲ�������ء�
Abstract: The thorough-thickness inhomogeneity of precipitate distribution and pitting corrosion behavior of 95 mm-thick 2297 Al-Li alloy rolled plate was investigated using scanning electron microscopy, transmission electron microscopy and electrochemistry method. Precipitate distribution and pit size were statistically analyzed to obtain quantitative information and corresponding correlation. The population density and the size fraction of precipitate on different sections in the thick plate are ranked from high to low in the following order: quarter-section (QS) > surface section (SS) > mid-section (MS). After 300 min potentiostatic polarization, the number and the total volume of pits are ranked from high to low as QS>SS>MS, indicating a higher pitting susceptibility of the plate in QS with more precipitates. The through-thickness inhomogeneity of pitting corrosion in 2297 Al-Li alloy thick plate is mainly ascribed to inhomogeneous precipitate distribution.
Trans. Nonferrous Met. Soc. China 29(2019) 1793-1802
Kuo ZHAO, Jian-hua LIU, Mei YU, Song-mei LI
School of Materials Science and Engineering, Beihang University, Beijing 100191, China
Received 11 January 2019; accepted 10 June 2019
Abstract: The thorough-thickness inhomogeneity of precipitate distribution and pitting corrosion behavior of 95 mm-thick 2297 Al-Li alloy rolled plate was investigated using scanning electron microscopy, transmission electron microscopy and electrochemistry method. Precipitate distribution and pit size were statistically analyzed to obtain quantitative information and corresponding correlation. The population density and the size fraction of precipitate on different sections in the thick plate are ranked from high to low in the following order: quarter-section (QS) > surface section (SS) > mid-section (MS). After 300 min potentiostatic polarization, the number and the total volume of pits are ranked from high to low as QS>SS>MS, indicating a higher pitting susceptibility of the plate in QS with more precipitates. The through-thickness inhomogeneity of pitting corrosion in 2297 Al-Li alloy thick plate is mainly ascribed to inhomogeneous precipitate distribution.
Key words: Al-Li alloy; pitting corrosion; precipitate; electrochemical behavior
1 Introduction
The growing need for lightweight and high strength materials has triggered great interest of scientists on Al-Li alloys in modern aviation industry [1-4]. By addition of 1 wt.% Li, the density of the resultant alloy is lowered by 3% and the stiffness is increased by 5%-6% [5-7]. These improvements provide an opportunity for mass saving and thereby lead to the reduction in CO2 emission. However, mechanical anisotropy and low toughness hamper the applications of the first- and the second-generation Al-Li alloys [8]. The anisotropies in microstructure and mechanical properties of aluminum alloys are closely related to the interactions among crystallographic texture, grain shape, cold deformation and aging precipitates [9-11]. The third generation Al-Li alloys, which have overcome the main drawbacks of previous generations Al-Li alloys, are currently being used in aircraft such as floor beams, fuselage and wing stringer.
Like conventional aluminum alloys, Al-Li alloys are susceptible to localized corrosion, such as pitting, intergranular corrosion and exfoliation corrosion [12-15]. Pitting can act as precursor of other types of corrosion, such as intergranular corrosion and stress corrosion cracking. Since it is difficult to detect and predict, pitting is one of the most dangerous forms of localized corrosion in passive metals [14]. For aluminum alloys including Al-Li alloys, their corrosion behavior is influenced by microstructure factors such as precipitates, grain size and grain orientation [13,14,16-20]. For instance, ZHANG et al [13] revealed that in comparison with the grain boundaries decorated by TB phase (Al7Cu4Li), those decorated by T1 phase (Al2CuLi) were more susceptible to corrosion, due to the high Li content in T1 phase [13]. In our previous work, the pitting initiation rate and the pitting propagation rate of Al-Li alloy increased significantly with increasing population density and area fraction of AlCuMnFe phase [21].
Plastic strain introduced to aluminum alloys during deformation processes, such as rolling, forging and extrusion, has significant influence on the alloy microstructure [22-26]. For example, localized plastic deformation led to the formation of dense precipitate bands and precipitate-free bands during subsequent aging [1]. Furthermore, the surface layer of thin rolled sheet underwent the enhanced deformation, generating a surface layer with different microstructures from the bulk [27-29]. During subsequent heat treatment, the enhanced deformation on the outmost surface of AA3005 rolled sheet promoted the precipitation of aging precipitates, resulting in an increased number of fine precipitates in comparison with the bulk alloy [27,28]. Whereas, these microstructural changes were not observed for AA5754 alloy, due to its lower Mn and Fe contents. Thick rolled plate exhibits strain variation in a wider thickness range than thin rolled sheet does. FENG et al [24] investigated the microstructure of AA7050- T7451 thick plate, and pointed out that recrystallization degree differs across thickness direction, resulting in an evident corrosion inhomogeneity. KNIGHT et al [30] revealed that the composition of 7079 alloy thick plate differs between 1/6 to 1/2 thickness positions. However, the through-thickness inhomogeneity in the precipitate distribution of Al-Li alloy thick plate and corresponding corrosion behavior have barely been reported.
The aim of this study is to investigate the through- thickness inhomogeneities of precipitate distribution and pitting corrosion behavior of Al-Li alloy thick plate. The size and the number of precipitates on different sections of the thick plate were statistically analyzed. The pitting characteristics were studied by electrochemical tests and three-dimensional (3D) measurements.
2 Experimental
The as-received 2297 Al-Li alloy rolled plate with a thickness of 95 mm in T87 condition was used in this work. The composition (in mass fraction) of the plate is: 1.53% Li, 2.97% Cu, 0.29% Mn, 0.03% Mg, 0.11% Zr, 0.028% Fe, 0.024% Si, 0.012% Ti and remainder of Al.
Directions of the rolled plate are labeled as longitudinal direction (L), long transverse direction (T) and short transverse direction (S). The 8 mm-diameter cylinders were cut from surface-section (SS), quarter- section (QS) and mid-section (MS) of the thick plate, as shown in Fig. 1, and named as SS sample, QS sample and MS sample, respectively. To minimize corrosion, samples were manually ground on stationary SiC grinding paper of 5000 grit in ethyl alcohol. Abraded samples were then ultrasonically cleaned in ethyl alcohol.
The microstructure of the thick plate was studied by scanning electron microscope (SEM; Apollo 300, Britain) and transmission electron microscope (TEM; JEOL 2100, Japan). Transparent foils for TEM observation were obtained via twin-jet electro-polishing at 20 V using nitric acid and methanol solution (volume ratio 3:7) at about -30 ��C. Chemical compositions of constituent particles were assessed by energy dispersive X-ray spectroscope (EDS; INCA PentaFETx3, Britain).

Fig. 1 Schematic diagram of sampling position
The test solution used in electrochemical tests and pitting corrosion measurements was borate-buffered solution at pH 7.4, which contains 0.18 mol/L H3BO3, 0.005 mol/L Na2B4O7 and 0.001 mol/L NaCl. The corrosion product was ultrasonically cleaned in a solution containing 50 vol.% H3PO4 + 20 g/L CrO3 and in deionized water.
The electrochemical tests were carried out on a Parstat VMC-4 electrochemical workstation using a three-electrode configuration. A platinum sheet was used as the counter electrode, and a saturated calomel electrode (SCE) with Luggin capillary served as the reference electrode. All the potentials in this work referred to the SCE. The open circuit potential (OCP) of the thick plate was recorded for 30 min. Electrochemical impedance spectroscopy (EIS) tests were performed at the OCP in the frequency range from 100 kHz to 10 mHz using a 10 mV AC stimulus signal. In order to reach a steady state, the EIS tests were carried out after 3 h immersion. Potentiodynamic polarization measurements were commenced at -200 mV relative to the OCP and scanned upwards at a scan rate of 1 mV/s until the anodic current density reached 0.1 mA/cm2.
To estimate the pitting corrosion behavior of 2297 Al-Li alloy thick plate, samples were potentiostatically polarized at -150 mV (vs SCE) for 300 min. The working surface was analyzed under 3D video microscope (RH-2000, Japan). The number, volume and mouth area of pits on different sections in the thick plate were statistically analyzed. All tests and measurements were performed at least triplicate for data reproducibility.
3 Results
3.1 Microstructure of plate
The SEM images of the alloy are illustrated in Fig. 2. The EDS results shown in Fig. 2(d) indicate that the precipitates are rich in Al, Cu, Mn and Fe. Hence, these precipitates are hence identified as AlCuMnFe phase. For each section, 30 low-magnification (500��) SEM images and 15 high-magnification (5000��) SEM images were used to statistically analyze the size and the density of AlCuMnFe phase using ImageJ software. The size distribution histograms of AlCuMnFe phase in the thick plate are shown in Fig. 3, and corresponding statistical data are listed in Table 1. For AlCuMnFe phase, the population density and the area fraction are ranked from high to low in the following order: QS>SS>MS, exhibiting through-thickness inhomogeneity.
The TEM images of the thick plate viewed in <110> zone axis are shown in Fig. 4, revealing the distribution of needle-like T1 precipitates with 10-295 nm in length. Due to the needle-like morphology, the length of T1 phase was statistically analyzed using ImageJ software. To eliminate or decrease variation of the statistical analysis caused by TEM foil thickness, 15 TEM images were used to perform the statistical analysis for each section. The length distribution histograms of T1 phase on the three sections in the thick plate are presented in Fig. 5, and the corresponding statistical data are presented in Table 2. For the three sections, the population density of T1 phase is ranked from high to low in the following order: QS>SS>MS. Similar to the area fraction of AlCuMnFe phase, the size fraction of T1 phase is defined by the length of T1 phase per unit area. The size fraction of T1 phase from high to low is in the following sequence: QS>SS>MS.
The through-thickness variation in precipitate distribution is mainly attributed to the inhomogeneous strain and cooling rate [24,31,32]. The equivalent strain and cooling rate decrease from surface to center of thick rolled plate [31,32]. Dislocation caused by strain usually acts as nucleation site, promoting precipitation of aging precipitates. Hence, the population density of precipitate on MS is smaller than that on SS. On the other hand, cooling rate can also affect the precipitate distribution. The increase in cooling rate shortens isothermal duration, resulting in the reduction of precipitate propagation duration [32-34]. The amount of fine precipitates hence decreases with increasing cooling rate. Thus, SS of the thick plate contains higher ratio of small precipitates (AlCuMnFe phase <1.5 ��m, T1 phase <60 nm) in comparison with QS and MS.

Fig. 2 SEM images of 2297 Al-Li alloy thick plate at three positions

Fig. 3 Size distribution histograms of AlCuMnFe phase in 2297 Al-Li alloy thick plate at three positions
Table 1 Statistical data of AlCuMnFe phase in 2297 Al-Li alloy thick plate

Table 2 Statistical data of T1 phase in 2297 Al-Li alloy thick plate
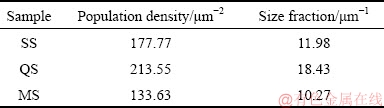

Fig. 4 TEM images of 2297 Al-Li alloy thick plate at three positions
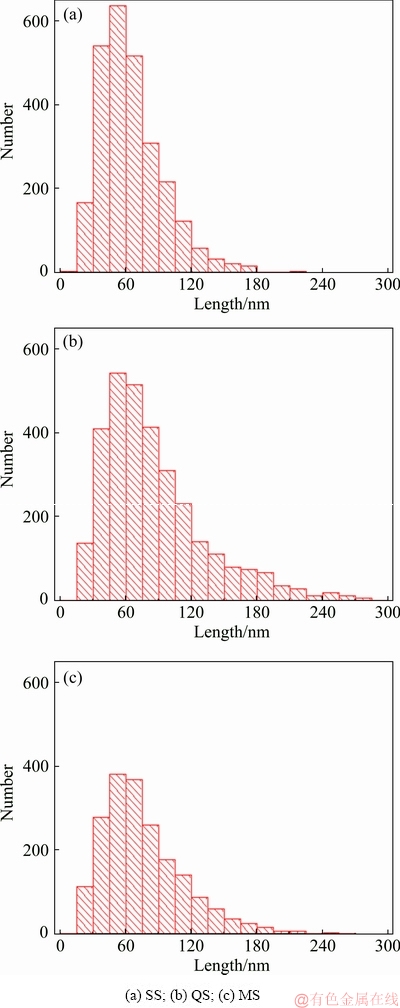
Fig. 5 Distribution histograms of T1 phase in 2297 Al-Li alloy thick plate at three positions
3.2 OCP tests
The OCP curves of the thick plate are shown in Fig. 6. For the three sections of the thick plate, the OCP increases first, and then reaches a relative steady state. For the three sections, the OCP is ranked from high to low as MS>SS>QS. This signifies that SS sample is more active than MS sample, but less active than QS sample.
3.3 EIS measurement
Nyquist plots of 2297 Al-Li alloy thick plate are presented in Fig. 7. All the Nyquist plots exhibit similar depressed features. The Nyquist plots are characterized by two capacitive arcs and one inductive arc. In metal corrosion, the inductive arc is often attributed to the weakening process of oxide film and corrosion [35-37]. Thus, the presence of inductive arc indicates that all the samples undergo corrosion during 3 h immersion.
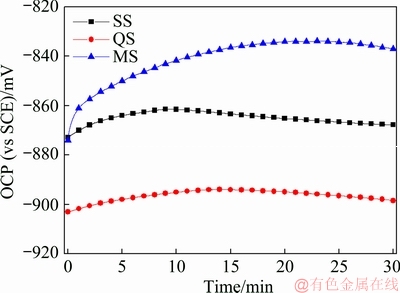
Fig. 6 OCP curves of 2297 Al-Li alloy thick plate at three positions
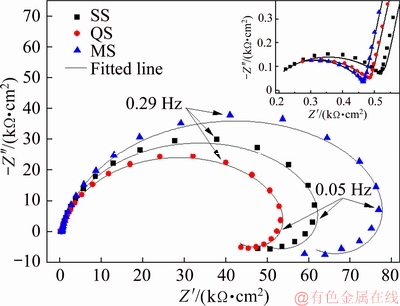
Fig. 7 Nyquist plots of 2297 Al-Li alloy thick plate at three positions
The equivalent electric circuit used to fit the EIS spectra is shown in Fig. 8, where Rs, Rf and Rct are the solution resistance, the resistance of passive film and the charge transfer resistance, respectively; Qf and Qdl are the constant phase elements associated with the origin surface capacitance and interfacial capacitance of the new interface originated from corrosion, respectively; RL and L are pseudo resistance and inductance, respectively. The fitted values of Rf, Rct and RL are shown in Fig. 9. It is noticeable that Rct is significantly larger than Rf and RL, suggesting that the charge transfer process is the slowest step, i.e. the controlling step. For the three sections of the thick plate, the order of active dissolution resistance of the thick plate ranked by Rct from high to low is MS>SS>QS. Thus, the EIS tests indicate that the corrosion resistance of the thick plate descends in the order: MS>SS>QS.

Fig. 8 Equivalent electric circuit used to fit EIS tests data

Fig. 9 Fitted values of Rf, Rct and RL
3.4 Potentiodynamic polarization curves
The potentiodynamic polarization curves of 2297 Al-Li alloy thick plate at three positions are shown in Fig. 10. The current plateau in polarization curves reveals the presence of protective air-formed oxide film. After the current plateau, the current density increases significantly with increasing potential, exhibiting an obvious pitting potential (��pit). The noticeable current rise is generally related to the breakdown of the oxide film. The ��corr and ��pit derived from Fig. 10 are listed in Table 3. The ��corr and ��pit of the thick plate are ranked in the following order: MS>SS>QS, indicating that in comparison with SS sample and MS sample, QS sample is more active and has higher pitting susceptibility. QS sample exhibits a smaller difference between ��pit and ��corr than SS and MS samples, suggesting a lower stability of oxide film. Potentiodynamic polarization tests reveal that the rank of the pitting susceptibility of the thick plate from high to low is QS>SS>MS.

Fig. 10 Potentiodynamic polarization curves of 2297 Al-Li alloy thick plate at three positions
Table 3 ��corr and ��pit of 2297 Al-Li alloy thick plate derived from potentiodynamic polarization curves

3.5 Pitting corrosion tests
Current densities of different samples recorded during potentiostatic polarization at -150 mV are shown in Fig. 11. Initially, the current density curves of the three samples show a current plateau, suggesting that air-formed oxide film can provide certain protection. After the current density plateau, noticeable current density rise is detected for QS and SS samples, while MS sample exhibits a relatively slow current rise. The current density rise indicates that stable pits initiate during long-term potentiostatic polarization at potential below the ��pit. In the medium containing aggressive anions such as chloride, the oxide film on aluminum alloys becomes unstable and degrades locally, resulting in oxide film breakdown. After onset of pitting, the current densities of the three samples are ranked from high to low as QS>SS>MS, implying the order of the dissolution rate of the thick plate from high to low is QS>SS>MS.

Fig. 11 Current densities of different samples recorded during potentiostatic polarization at -150 mV
3D morphologies of pits are presented in Fig. 12. It can be clearly seen that all the samples exhibit pitting corrosion. Though the electrolyte in the pit cavity is highly corrosive ascribed to local acidification [38], intergranular corrosion is not detected. The influence of ultrasonic cleaning on 3D measurements of pit cavities is therefore believed to be negligible. The volume distribution histograms of pits are shown in Fig. 13, and detail statistical data are listed in Table 4. QS sample exhibits a larger pit volume distribution in comparison with SS and MS samples. The order of pit number from high to low is QS>SS>MS, which is consistent with the order of precipitate population density, indicating that pit initiates more easily in the plate with more precipitates. The total pit volume and the total pit mouth area are from high to low in the following sequence: QS>SS>MS, consistent with the order of size fraction of precipitates. Thus, the statistical analysis demonstrates that the pitting corrosion resistance of the thick plate descends in the following order: MS>SS>QS.
4 Discussion
The present results demonstrate that there is pronounced through-thickness inhomogeneity in precipitate distribution and pitting corrosion of 2297 Al-Li alloy thick plate. Localized corrosion associated with precipitates has been widely reported [17,39-41]. The electrochemical inhomogeneity in the alloy matrix resulted from precipitates has significant influence on the localized corrosion behavior of aluminum alloys [16,17].
Electrochemical tests reflect the overall electro- chemical response of the entire electrode. OCP and ��corr are influenced by the kinetics of corrosion reactions. Therefore, precipitate distribution has noticeable impact on OCP and ��corr. T1 phase is anodic active in comparison with the alloy matrix [1,42]. With increasing population density of T1 phase, 2297 Al-Li alloy tends to be more active, exhibiting more negative OCP and ��corr. AlCuMnFe phase, cathodic phase with respect to the matrix, induces active dissolution of surrounding matrix [21,43]. The presence of AlCuMnFe phase hence results in a more negative electrode potential. As shown in Tables 1 and 2, the population density of precipitates on the three sections of the plate from high to low is ranked in the following order: QS>SS>MS. Therefore, the OCP and ��corr descend in the order: MS>SS>QS. Besides, as shown in Fig. 10, the current density at the same applied over-potential rises with increasing population density and area fraction of precipitates, confirming that the electrode containing more precipitates is more active.
Precipitate distribution also shows noticeable effects on ��pit. According to Ref. [4], precipitates with minimum dimensions above a critical size can result in a defeat of the oxide film, as the oxide film cannot cover the entire metal surface. Consequently, pits initiate more easily at the defect. The critical size was reported to be around 2.5 nm for 6xxx Al alloys [20] and 3-8 nm for 2xxx Al alloys [4]. In this study, the thickness of T1 phase is generally smaller than 2 nm, and hence it is less than the critical size required to induce pitting [4,20]. Thus, it is deduced that T1 phase shows negligible effect on ��pit. For the three sections of the thick plate, the population density of AlCuMnFe phase is ranked from high to low as follows: QS>SS>MS. With increasing population density of AlCuMnFe phase, the number of active site increases. The alloy with more precipitates is hence more susceptible to pitting corrosion, exhibiting a more negative ��pit. Thus, the ��pit is the most positive for MS of the plate, intermediate for SS of the plate, and most negative for QS of the plate.

Fig. 12 Morphologies of stable pits on SS (a, b), QS (c, d) and MS (e, f) samples

Fig. 13 Volume distribution histograms of pits on SS (a), QS (b) and MS (c) samples
Table 4 Statistical data of pits generated on thick plate at three positions

The type, the population density and the size of precipitates show significant effects on pitting corrosion of aluminum alloys. In neutrally aerated solution containing chloride, the dominant cathodic reaction is oxygen reduction, which readily takes place on cathodic precipitates. As a result, hydroxyl ions, as the reaction product, cause localized alkalization near the cathodic precipitates. For instance, the local pH around Al3Fe in AA6061 alloy is measured to be 9.5, which is much higher than the bulk pH 6.3 [44]. It is widely accepted that aluminum oxide dissolves in solution with pH higher than 9 [38,44]. Thus, the localized alkalization around cathodic precipitates induces breakdown of oxide film and active dissolution of surrounding matrix, resulting in pit initiation and propagation. T1 phase shows negligible effect on pit initiation, while it can promote pit propagation. The corrosion mechanism associated with T1 phase containing active element Li and noble element Cu is similar to the preferential dissolution phenomenon related to S phase in AA2024 alloy [45]. At the beginning, T1 phase acts as anodic in micro-galvanic, resulting in their anodic dissolution and corrosion. The active element Li is preferentially dissolved, and meanwhile noble element Cu is enriched. Consequently, the Cu-rich remnant becomes cathodic to its periphery, leading to the dissolution of the surrounding matrix. Therefore, with increasing population density and size fraction of precipitate, the active dissolution resistance of the thick plate decreases, exhibiting a lower Rct (Fig. 9) and higher polarization current density (Fig. 11). The dissolution of alloy matrix around larger precipitates results in larger cavity and severer electrolyte. Due to the autocatalytic nature of pits, the stable pit caused by larger precipitate tends to maintain continuous propagation for a longer duration. For the three sections of the thick plate, the peak current density descends in the following order: QS>SS>MS. Therefore, the larger population density and higher size fraction of precipitates result in more and larger pits on the plate.
5 Conclusions
(1) Two precipitate phases are identified in the 2297 Al-Li alloy thick plate: AlCuMnFe phase and T1 phase. For the three sections, the two precipitate phases both exhibit inhomogeneous distribution. The population densities and the size fractions of the two precipitate phases are ranked from high to low in the following order: QS>SS>MS.
(2) OCP, ��corr, ��pit, Rct and RL of the plate are ranked from high to low as QS
(3) The pitting susceptibility and propagation rate of the plate closely are related to the precipitate distribution. For the three sampling positions, the plate in MS contains the sparsest precipitates of smallest area/size fractions, exhibiting the best pitting corrosion resistance. The through-thickness inhomogeneity of pitting corrosion in 2297 Al-Li alloy thick plate is mainly ascribed to inhomogeneous precipitate distribution.
References
[1] ZHANG Xin-xin, ZHOU Xiao-rong, HASHIMOTO T, LIU Bing, LUO Chen, SUN Zhi-hua, TANG Zhi-hui, LU Feng, MA Yan-long. Corrosion behaviour of 2A97-T6 Al-Cu-Li alloy: The influence of non-uniform precipitation [J]. Corrosion Science, 2018, 132: 1-8.
[2] OTT N, YAN Yuan-ming, RAMAMURTHY S, KAIRY S, BIRBILIS N. Auger electron spectroscopy analysis of grain boundary microchemistry in an Al-Cu-Li alloy [J]. Scripta Materialia, 2016, 119: 17-20.
[3] LIU Dan-yang, WANG Jie-xia, LI Jin-feng. Micostructures evolution and mechanical properties disparity in 2070 Al-Li alloy with minor Sc addition [J]. Transactions of Nonferrous Metals Society of China, 2018, 28: 2152-2162.
[4] RALSTON K D, BIRBILIS N, CAVANAUGH M K, WEYLAND M, MUDDLE B C, MARCEAU R K W. Role of nanostructure in pitting of Al-Cu-Mg alloys [J]. Electrochimica Acta, 2010, 55: 7834-7842.
[5] ABD EL-ATY A, XU Yong, GUO Xun-zhong, ZHANG Shi-hong, MA Yan, CHEN Da-yong. Strengthening mechanisms, deformation behavior, and anisotropic mechanical properties of Al-Li alloys: A review [J]. Journal of Advanced Research, 2018, 10: 49-67.
[6] BOIS-BROCHU A, BLAIS C, TCHITEMBO GOMA F A, LAROUCHE D. Modelling of anisotropy for Al-Li 2099 T83 extrusions and effect of precipitate density [J]. Materials Science and Engineering A, 2016, 673: 581-586.
[7] OTT N, KAIRY S K, YAN Y M, BIRBILIS N. Evolution of grain boundary precipitates in an Al-Cu-Li alloy during aging [J]. Metallurgical and Materials Transactions A, 2017, 48: 51-56.
[8] MA Y, ZHOU X, HUANG W, LIAO Y, CHEN X, ZHANG X, THOMPSON G E. Crystallographic defects induced localised corrosion in AA2099-T8 aluminium alloy [J]. Corrosion Engineering, Science and Technology, 2014, 50: 420-424.
[9] ES-SAID O S, PARRISH C J, BRADBERRY C A, HASSOUN J Y, PARISH R A, NASH A, SMYTHE N C, TRAN K N, RUPERTO T, LEE E W, MITCHELL D, VINQUIST C. Effect of stretch orientation and rolling orientation on the mechanical properties of 2195 Al-Cu-Li alloy [J]. Journal of Materials Engineering and Performance, 2010, 20: 1171-1179.
[10] RIOJA R J. Fabrication methods to manufacture isotropic Al-Li alloys and products for space and aerospace applications [J]. Materials Science and Engineering A, 1998, 257: 100-107.
[11] WRONSKI S, BACROIX B. Microstructure evolution and grain refinement in asymmetrically rolled aluminium [J]. Acta Materialia, 2014, 76: 404-412.
[12] GHOSH R, VENUGOPAL A, NARAYANAN P R, SHARMA S C, VENKITAKRISHNAN P V. Environmentally assisted cracking resistance of Al-Cu-Li alloy AA2195 using slow strain rate test in 3.5% NaCl solution [J]. Transactions of Nonferrous Metals Society of China, 2017, 27: 241-249.
[13] ZHANG X, ZHOU X, HASHIMOTO T, LINDSAY J, CIUCA O, LUO C, SUN Z, ZHANG X, TANG Z. The influence of grain structure on the corrosion behaviour of 2A97-T3 Al-Cu-Li alloy [J]. Corrosion Science, 2017, 116: 14-21.
[14] DONATUS U, TERADA M, OSPINA C R, QUEIROZ F M, FATIMA SANTOS BUGARIN A, COSTA I. On the AA2198-T851 alloy microstructure and its correlation with localized corrosion behaviour [J]. Corrosion Science, 2018, 131: 300-309.
[15] LI Jin-feng, HUANG Jia-lei, LIU Dan-yang, CHEN Yong-lai, ZHANG Xu-hu, MA Peng-cheng. Distribution and evolution of aging precipitates in Al-Cu-Li alloy with high Li concentration [J]. Transactions of Nonferrous Metals Society of China, 2019, 29: 15-24.
[16] TIAN Wen-ming, LI Song-mei, CHEN Xin, LIU Jian-hua, YU Mei. Intergranular corrosion of spark plasma sintering assembled bimodal grain sized AA7075 aluminum alloys [J]. Corrosion Science, 2016, 107: 211-224.
[17] LEBLANC P, FRANKEL G S. A study of corrosion and pitting initiation of AA2024-T3 using atomic force microscopy [J]. Journal of the Electrochemical Society, 2002, 149: B239-B247.
[18] RALSTON K D, BIRBILIS N, WEYLAND M, HUTCHINSON C R. The effect of precipitate size on the yield strength-pitting corrosion correlation in Al-Cu-Mg alloys [J]. Acta Materialia, 2010, 58: 5941-5948.
[19] ARTHANARI S, JANG J C, SHIN K S. Corrosion performance of high pressure die-cast Al-6Si-3Ni and Al-6Si-3Ni-2Cu alloys in aqueous NaCl solution [J]. Transactions of Nonferrous Metals Society of China, 2018, 28: 2181-2189.
[20] YAN Y, PEGUET L, GHARBI O, DESCHAMPS A, HUTCHINSON C R, KAIRY S K, BIRBILIS N. On the corrosion, electrochemistry and microstructure of Al-Cu-Li alloy AA2050 as a function of ageing [J]. Materialia, 2018, 1: 25-36.
[21] LIU Jian-hua, ZHAO Kuo, YU Mei, LI Song-mei. Effect of surface abrasion on pitting corrosion of Al-Li alloy [J]. Corrosion Science, 2018, 138: 75-84.
[22] MA Y, ZHOU X, LIAO Y, YI Y, WU H, WANG Z, HUANG W. Localised corrosion in AA 2099-T83 aluminium-lithium alloy: The role of grain orientation [J]. Corrosion Science, 2016, 107: 41-48.
[23] KUMAR R, GUPTA A, KUMAR A, CHOUHAN R N, KHATIRKAR R K. Microstructure and texture development during deformation and recrystallisation in strip cast AA8011 aluminum alloy [J]. Journal of Alloys and Compounds, 2018, 742: 369-382.
[24] FENG Lei, PAN Qing-lin, WEI Li-li, HUANG Zhi-qi, LIU Zhi-ming. Through-thickness inhomogeneity of localized corrosion in 7050-T7451 Al alloy thick plate [J]. Journal of Central South University, 2015, 22: 2423-2434.
[25] MA Y, ZHOU X, THOMPSON G E, HASHIMOTO T, THOMSON P, FOWLES M. Distribution of intermetallics in an AA 2099-T8 aluminium alloy extrusion [J]. Materials Chemistry and Physics, 2011, 126: 46-53.
[26] YE Xian-jue, GONG Xiao-juan, YANG Biao-biao, LI Yun-ping, NIE Yan. Deformation inhomogeneity due to sample-anvil friction in cylindrical compression test [J]. Transactions of Nonferrous Metals Society of China, 2019, 29: 279-286.
[27] AMBAT R, DAVENPORT A J, AFSETH A, SCAMANS G. Electrochemical behavior of the active surface layer on rolled aluminum alloy sheet [J]. Journal of the Electrochemical Society, 2004, 151: B53-B58.
[28] AFSETH A, NORDLIEN J H, SCAMANS M G, NISANCIOGLU K. Influence of heat treatment and surface conditioning on filiform corrosion of aluminium alloys AA3005 and AA5754 [J]. Corrosion Science, 2001, 43: 2359-2377.
[29] ZHOU X, LIU Y, THOMPSON G E, SCAMANS G M, SKELDON P, HUNTER J A. Near-surface deformed layers on rolled aluminum alloys [J]. Metallurgical and Materials Transactions A, 2010, 42: 1373-1385.
[30] KNIGHT S P, BIRBILIS N, MUDDLE B C, TRUEMAN A R, LYNCH S P. Correlations between intergranular stress corrosion cracking, grain-boundary microchemistry, and grain-boundary electrochemistry for Al-Zn-Mg-Cu alloys [J]. Corrosion Science, 2010, 52: 4073-4080.
[31] ZHANG Tao, WU Yun-xin, GONG Hai, SHI Wen-ze, JIANG Fang-min. Analysis of strain variation in cross shear zone of plate during snake hot rolling [J]. Journal of Central South University, 2017, 24: 296-302.
[32] ZHANG Yu-xun, YI You-ping, HUANG Shi-quan, DONG Fei. Influence of quenching cooling rate on residual stress and tensile properties of 2A14 aluminum alloy forgings [J]. Materials Science and Engineering A, 2016, 674: 658-665.
[33] ELGALLAD E M, ZHANG Z, CHEN X G. Effect of quenching rate on precipitation kinetics in AA2219 DC cast alloy [J]. Physica B: Condensed Matter, 2017, 514: 70-77.
[34] YIN Yuan, LUO Bing-hui, JING Hui-bo, BAI Zhen-hai, GAO Yang. Influences of quench cooling rate on microstructure and corrosion resistance of Al-Cu-Mg alloy based on the end-quenching test [J]. Metallurgical and Materials Transactions B, 2018, 49: 2241-2251.
[35] LV Jin-long, LIANG Tong-xiang, WANG Chen, GUO Ting. The passive film characteristics of several plastic deformation 2099 Al-Li alloy [J]. Journal of Alloys and Compounds, 2016, 662: 143-149.
[36] SONG Feng-xuan, ZHANG Xin-ming, LIU Sheng-dan, TAN Qi, LI Dong-feng. The effect of quench rate and overageing temper on the corrosion behaviour of AA7050 [J]. Corrosion Science, 2014, 78: 276-286.
[37] ZHANG G A, XU L Y, CHENG Y F. Mechanistic aspects of electrochemical corrosion of aluminum alloy in ethylene glycol�C water solution [J]. Electrochimica Acta, 2008, 53: 8245-8252.
[38] TIAN Wen-ming, LI Song-mei, WANG Bo, LIU Jian-hua, YU Mei. Pitting corrosion of naturally aged AA 7075 aluminum alloys with bimodal grain size [J]. Corrosion Science, 2016, 113: 1-16.
[39] LI L L, ZHANG B, TIAN B, ZHOU Y, WANG J Q, HAN E H, KE W. SVET study of galvanic corrosion of AlMg2Si couple in aqueous solutions at different pH [J]. Journal of the Electrochemical Society, 2017, 164: C240-C249.
[40] LUO Chen, ALBU S P, ZHOU Xiao-rong, SUN Zhi-hua, ZHANG Xiao-yun, TANG Zhi-hui, THOMPSON G E. Continuous and discontinuous localized corrosion of a 2xxx aluminium�Ccopper�C lithium alloy in sodium chloride solution [J]. Journal of Alloys and Compounds, 2016, 658: 61-70.
[41] MA Yan-long, ZHOU Xiao-rong, MENG Xiao-min, HUANG Wei-jiu, LIAO Yi, CHEN Xiao-li, YI Ya-nan, ZHANG Xin-xin, THOMPSON G E. Influence of thermomechanical treatments on localized corrosion susceptibility and propagation mechanism of AA2099 Al-Li alloy [J]. Transactions of Nonferrous Metals Society of China, 2016, 26: 1472-1481.
[42] LI J F, LI C X, PENG Z W, CHEN W J, ZHENG Z Q. Corrosion mechanism associated with T1 and T2 precipitates of Al-Cu-Li alloys in NaCl solution [J]. Journal of Alloys and Compounds, 2008, 460: 688-693.
[43] GRILLI R, BAKER M A, CASTLE J E, DUNN B, WATTS J F. Localized corrosion of a 2219 aluminium alloy exposed to a 3.5% NaCl solution [J]. Corrosion Science, 2010, 52: 2855-2866.
[44] PARK J O, PAIK C H, HUANG Y H, ALKIRE R C. Influence of Fe-rich intermetallic inclusions on pit initiation on aluminum alloys in aerated NaCl [J]. Journal of the Electrochemical Society, 1999, 146: 517-523.
[45] BOAG A, TAYLOR R J, MUSTER T H, GOODMAN N, MCCULLOCH D, RYAN C, ROUT B, JAMIESON D, HUGHES A E. Stable pit formation on AA2024-T3 in a NaCl environment [J]. Corrosion Science, 2010, 52: 90-103.
�� �������������� ��������÷
�������պ����ѧ ���Ͽ�ѧ�빤��ѧԺ������ 100191
ժ Ҫ������ɨ��羵����羵�͵绯ѧ���Լ����о����Ϊ95 mm 2297��﮺Ͻ����ƺ��������ֲ�����ʴ��Ϊ�ĺ������ԡ�ͨ����������ķֲ���ʴ�ӳߴ����ͳ�Ʒ�����ö�����Ϣ����Ӧ�Ĺ�ϵ�����ƺ�岻ͬ��Ȳ��е�������ֲ��ܶȺͳߴ�����ɴ�С��˳��Ϊ1/4��Ȳ�(QS)>�����(SS)>1/2��Ȳ�(MS)����300 min���λ���������ƺ�岻ͬ��Ȳ������ĵ�ʴ������ʴ��������ɴ�С��˳��ΪQS>SS>MS��������庬��������϶��1/4��Ȳ���и��ߵĵ�ʴ�����ԡ�2297��﮺Ͻ����ƺ��ĵ�ʴ��Ϊ����������������ֲ�������ء�
�ؼ��ʣ���﮺Ͻ𣻵�ʴ�������ࣻ�绯ѧ��Ϊ
(Edited by Wei-ping CHEN)
Foundation item: Project (51671013) supported by the National Natural Science Foundation of China; Project (Z161100004916061) supported by the Beijing Nova Program, China
Corresponding author: Mei YU; Tel/Fax:+86-10-82317103; E-mail: yumei@buaa.edu.cn
DOI: 10.1016/S1003-6326(19)65087-9

