Trans. Nonferrous Met. Soc. China 23(2013) 1072-1079
Fracture strength evaluation of titanium alloys using modified average stress criterion
H. BRIGHTON ISAAC JOHN1, T. CHRISTOPHER2
1. Sardar Raja College of Engineering, Alangulam, Tirunelveli-627 808, India;
2. Government College of Engineering, Perumalpuram, Tirunelveli-627 007, India
Received 24 February 2012; accepted 26 January 2013
Abstract: Structural integrity procedures were used to demonstrate the fitness for the purpose of engineering components transmitting loads. The prediction of the fracture strength of titanium alloys containing sharp notches through the damage model depends on the un-notched strength and the critical length of the damage zone ahead of the notch. In general, the critical length of the damage zone depends on the material, specimen, and size of the sharp notch. Modifications were made in one of the stress fracture criteria known as the average stress criterion for accurate prediction of notched tensile strength of titanium alloy specimen containing sharp notches. To examine the adequacy of these modifications, fracture data of center-cracked titanium alloys with various thicknesses are considered. The notched (fracture) strength estimates are found to be close to the test results. The modified average stress criterion is very simple to predict the notched tensile strength.
Key words: titanium alloys; center crack tensile specimen; stress criterion; failure assessment diagram; fracture strength
1 Introduction
Aerospace industry recognizes two types of failure criteria: yielding and fracture. Failure due to yielding is applied to a criterion in which some functional of the stress or strain is exceeded and fracture is applied to a criterion in which an already existing crack extends according to an energy balance hypothesis. Experiment with a variety of materials would show that a theory works well for certain materials but not for others. The safety assessment of structures without a fracture mechanics analysis is insufficient and may cause an unexpected reduction in the load carrying capacity of an actual structure due to the presence of unavoidable crack-like defects not being taken into consideration. The extraordinary success of fracture mechanics lies in its ability to combine a theoretical framework with experimentally measured critical quantity.
Several fracture analysis methods to predict the fracture behavior of flawed structural components used in an experimental and predictive round robin conducted in 1979-1980 by the American Society for Testing and Materials (ASTM) Task Group E 24.06.02 were described in Ref. [1]. None of these methods were found to be the best for all the structural materials examined. GORDON [2] has reviewed several of the major pipeline codes, which have incorporated fracture-mechanics- based fitness-for-service concepts. A number of engineering methods have been proposed to examine the fracture behavior of cracked configurations [3-5]. In the failure assessment diagram or the R6 method [6], the integrity of the structure is assessed and represented in a two-dimensional way: a function of the failure strength pursuant to linear elastic fracture mechanics (LEFM) is plotted as ordinate and that pursuant to plastic collapse as abscissa.
DUGDALE [7] established the stress limits for any transitional stages between linear elastic failure and plastic collapse. Experiments largely proved these limits to be conservative. The two-parameter fracture criterion of NEWMAN [1,8] applies relations derived within the scope of LEFM. In this criterion, the two fracture parameters take account of the deviation of the stress-to-failure from the stress calculated pursuant to LEFM principles. These parameters have to be determined earlier in pretests, so-called base-line tests, conducted under identical conditions of the material.
KELLER et al [9] have carried out fracture analysis of surface cracks in cylindrical vessels applying the two-parameter fracture criterion. It was neither possible to determine satisfactorily the failure stresses of vessels by means of fracture parameters obtained from fracture mechanics specimens, nor to predict the loads to failure of the specimens by means of the vessels�� fracture parameters. ZERBST et al [10] have applied the recently developed European flaw assessment procedure SINTAP (Structural Integrity Assessment Procedures for European Industry) to the published fracture data [11] on steel pipes having through-wall and surface cracks subjected to internal pressure. The SINTAP procedure offers a crack driving force (CDF) and a failure assessment diagram (FAD) route. Both are complementary and give identical results. In the CDF route the determination of the crack tip loading in the component and its comparison with the fracture resistance of the material are two separate steps. In the FAD route, a failure line is constructed by normalizing the crack tip loading with the material fracture resistance. The assessment of the component is then based on the relative location of an assessment point with respect to this failure line.
For cracked configurations, a relation between the stress intensity factor (Kmax) and the corresponding stress (��f) at failure is suggested as [12]
 (1)
(1)
where ��f is the failure stress normal to the direction of the crack in a body and ��u is the nominal stress required to produce a plastic hinge on the net section. For the pressurized cylinders, ��f is the hoop stress at the failure pressure of the flawed cylinder, and ��u is the hoop stress at the failure pressure of an unflawed cylinder. For the determination of three fracture parameters (KF, m and p), test results of simple laboratory specimens like compact tension specimens, center crack specimens etc. can be utilized. For fracture strength evaluation of any other structural configuration, the stress intensity factor corresponding to the geometry is to be used in equation (1) to develop the necessary fracture strength equation. If the values of applied stress and corresponding stress intensity factor for the specified crack size in the structure lie below the Kmax����f curve of the failure assessment diagram, the structure for that loading condition is safe.
Owing to the inherent complexity and the number of factors involved in predicting the notched strength of structural components, several semi-empirical failure criteria have been proposed and have gained popularity because of their simplicity of application [13]. Fracture behaviour of centre notched tensile specimens can be examined using a modification in the point stress criterion (PSC) [14], as well as in the average stress criterion (ASC) [15] and in the inherent flaw model (IFM) [16,17].
The titanium alloys are established for aerospace materials worldwide. Fracture data have been complied for selected titanium alloys (viz, Ti-6Al-4V alloy, Ti-8Al-1Mo-1V alloy, Ti-5Al-2.5Sn alloy) usefully for aircraft applications [18]. KAMALA et al [19] had used a modified average stress criterion to predict the fracture strength of various lay-ups of carbon/epoxy laminates. The objective of this work is to utilize an improved average stress criterion for tensile fracture strength evaluation of titanium alloys.
2 Modified average stress criterion
A knowledge of the state of stress is essential in the case of a body with a crack in order to judge the nature of its propagation and thereby its strength. PARIS and SIH [20] as well as PARTON and MOROZOV [21] have described the Westergaard method of stress analysis for cracks by applying the principles of linear, small deformation elasticity. They presented local field equations for stress and displacement components ahead of a straight crack for all three local modes (Mode I: opening mode; Mode II: sliding mode; Mode III: tearing mode) of deformation. These three modes essentially describe three independent kinematical movements of the upper and lower crack surfaces and are sufficient to describe all the possible modes of crack propagation in an elastic material. In practice, of these three modes, the most applicable is the opening mode, which is considered in the present study.
The normal stress, ��y(x, 0) along the x-axis ahead of a crack is given by [22]
 (2)
(2)
where �� is the applied stress and c is the half crack length.
The average stress criteria of WHITNEY and NUISMER [23] postulated that the final fracture of a cracked body occurs when the average stress over a small distance aca ahead of crack tip equals the ultimate tensile strength (��0) of the material [23], i.e.,
 (3)
(3)
where aca is the crack tip damage size of failure (see Fig. 1).
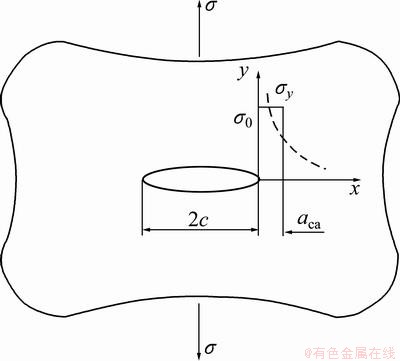
Fig. 1 Characteristic length (aca) in wide tensile specimen containing central crack
Substituting  and
and  in equation (2) and using Eq. (3), one can obtain a relationship between the fracture strength and the crack length as
 (4)
(4)
where  is the fracture strength of a wide specimen.
The unknown characteristic length (aca) is obtained by the test data of a finite width tensile cracked specimen. The fracture strength (��NC) of the center crack wide tensile specimen is obtained from that of a finite width specimen (��NC) as
= Y (5)
Y (5)
where the finite width correction factor (Y) [24] is
 (6)
(6)
where c is half the crack length and W is the specimen width.
Finite width center�Ccrack tensile specimen subjected to fracture stress (��NC) is shown in Fig. 2.
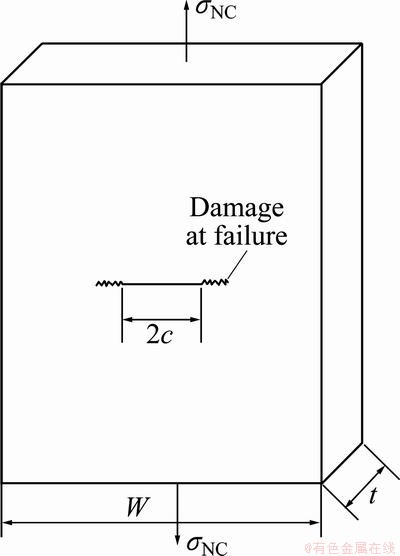
Fig. 2 Finite width center�Ccrack tensile specimen subjected to fracture stress (t is the specimen thickness)
Using ��NC, ��0 and c, the unknown characteristic length aca is found from equation (4) as
 (7)
(7)
After determining the characteristic length, the fracture strength () can be obtained directly from equation (4) specifying the crack length (2c). Fracture strength of the finite width plate can be obtained from equation (5) or dividing () with the correction factor (Y). It is noted from the fracture data on different materials that the fracture strength decreases with increase in the crack size. Equation (7) indicates that the characteristic length (aca) is not a material constant. It increases with increase in the crack size. This calls for a modification in the average stress criterion.
From the above results one can write a relation between (aca) and () in the non-dimensional form as
 (8)
(8)
To determine the parameters, KASC and ��aca in equation (8), two cracked specimen tests in addition to an unflawed specimen test are required. Normally more tests are performed to take into account scatter in the test results. The parameters KASC and ��aca are determined by a least square curve fit to the data for aca and = 0 in equation (8) represents the constant damage size. When ��aca>1 and
 , equation (8) results in
  . Hence,
  .Whenever ��aca is found to be greater than unity, the parameter ��aca has to be truncated to 1 by suitably modifying the parameter KASC with the fracture data. If ��aca is found to be less than zero, the parameter ��aca has to be truncated to zero and the average of
  values from the fracture data yields the parameter KASC. Once KASC and ��aca in equation (8) are known, it is possible to eliminate the characteristic length (aca) from equation (8) using equation (7).
The resulting nonlinear equation for the fracture strength () is
 (9)
(9)
This non-linear fracture strength equation (9) is solved using the Newton�CRaphson iterative scheme to obtain for the specified crack size. The fracture strength () of the finite width plate is obtained by dividing with the correction factor (Y).
A relation between  and
and  can be written by eliminating the characteristic length using equation (8) and the fracture strength equation (4) as
 (10)
(10)
Equation (10) represents a failure assessment diagram useful for fracture strength evaluation of different cracked configurations. This expression indicates that the fracture strength decreases with increasing crack size [15]. It is also possible to generate fracture strength ( ) versus crack size (2c) curves from equation (9) by specifying 0 <<
 . From these curves one can find for the specific crack size. The fracture strength () corresponding to the crack size is evaluated by dividing with Y.
Figure 3 shows a typical failure assessment diagram. For the specified flaw size and stress level ��a the corresponding stress intensity factor Ka and  can be found for the cracked configuration. If the point A lies inside the envelope of the failure assessment diagram (Fig. 3), the cracked configuration is safe under that stress level. The point B in Fig. 3 refers to the failure point. From this point, the failure strength of the cracked configuration for the specified flaw size can be estimated.
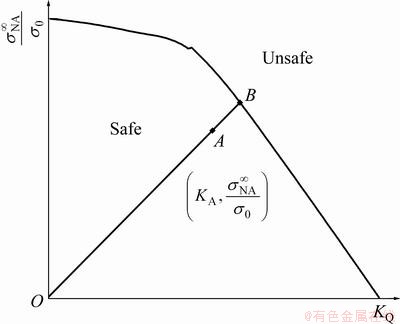
Fig. 3 Typical failure assessment diagram
3 Results and discussion
To verify the validity of the modified average stress criterion, fracture data [18] of the center crack tensile specimens made of titanium alloys are considered. Fracture data on high strength alloys useful for aircraft applications in Ref. [18] are categorized by material, alloy, temper and/or heat treatment, bare or clad, thickness and specimen orientation with respect to the rolling direction. For the case of multiple test results, average strength value is considered.
From the fracture strength (��NC) data of the finite width center-crack tension specimens, the fracture strength () for wide tensile specimens is obtained from equation (5) utilizing the finite width correction factor (Y) in equation (6). Substituting the crack length (2c), the un-notched strength (��0) and the notched strength () in equation (7), the characteristic length (aca) is obtained. It is noted that the characteristic length increases with increasing the crack size. Hence, values of aca, and ��0 from fracture data of the material are fitted in equation (8) and obtained the fracture parameters KASC and ��aca. When ��aca=0, the characteristic length becomes constant. For this case, the fracture strength () for the crack size (2c) can be obtained directly from equation (4). The fracture strength () for the finite width plate can be obtained by dividing with the finite width correction factor (Y). When ��aca>0, one can generate fracture strength () versus the crack size (2c) curves from equation (9) by specifying the values of from 0 to . From this curve, one can find easily the fracture strength () for the crack size. Then applying the finite width correction factor (Y) to, the fracture strength () for the finite width plate can be estimated. In the present study, the non-linear fracture strength equation (9) is solved using the Newton-Raphson iterative method.
A standard error (Es) between analytical and test results is obtained.
 (11)
(11)
where N is the number of test specimens;  is the analysis result;
  is the test result.
The relative error (��) is computed as
 (12)
(12)
Fracture analysis has been carried out considering the ultimate tensile strength values and the fracture data of titanium alloys generated at 295 K from center�Ccrack tensile specimens having different thicknesses. The variation in the un-notched strength (��0) values for the same material having same sample dimension is mainly due to the orientation of the specimen relative to the direction of stressing.
Table 1 gives the fracture toughness parameters (KASC and ��aca) evaluated from the test results [18] of centre surface crack tension specimens made of titanium alloys. Tables 2 to 11 give the comparison of fracture strength estimated with the test results. The standard error is found to be less than 0.1, which indicates that the fracture strength estimated utilizing the fracture parameters (KASC and ��aca) can be expected within ��10% of the test results. Figures 4-6 show the failure assessment diagrams including the fracture data of the materials. It can be seen from Fig. 7 that most of the fracture strengths estimated are within ��10% of the test results.
Table 1 Fracture toughness parameters (KASC and ��aca) evaluated from test results [18] of center crack tensile specimens made of titanium alloys
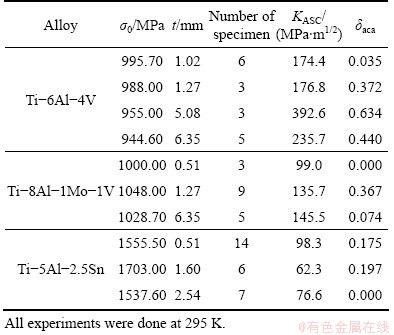
Table 2 Comparison of analytical and test results of center crack tensile specimen made of Ti-6Al-4V alloy (t=1.02 mm, KASC=174.4 MPa��m1/2, ��aca=0.035)
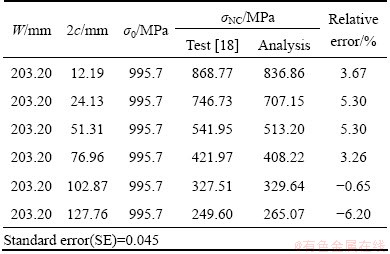
Table 3 Comparison of analytical and test results of center crack tensile specimen made of Ti-6Al-4V alloy (t=1.27 mm, KASC=176.8 MPa��m1/2, ��aca=0.372)
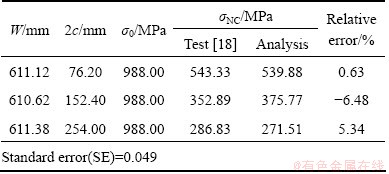
Table 4 Comparison of analytical and test results of center crack tensile specimen made of Ti-6Al-4V alloy (t=5.08 mm, KASC=392.6 MPa��m1/2, ��aca=0.634)
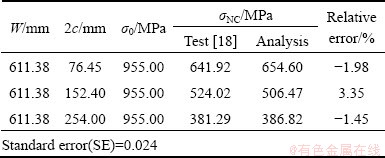
Table 5 Comparison of analytical and test results of center crack tensile specimen made of Ti-6Al-4V alloy (t=6.35 mm, KASC=235.7 MPa��m1/2, ��aca= 0.440)
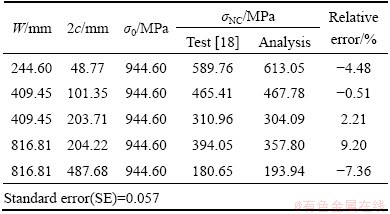
Table 6 Comparison of analytical and test results of center crack tensile specimen made of Ti-8Al-1Mo-1V alloy (t=0.51 mm, KASC=99.0 MPa��m1/2, ��aca=0)
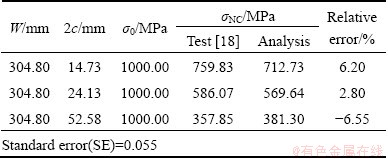
Table 7 Comparison of analytical and test results of center crack tensile specimen made of Ti-8Al-1Mo-1V alloy (t=1.27 mm, KASC=135.7 MPa��m1/2, ��aca=0.367)
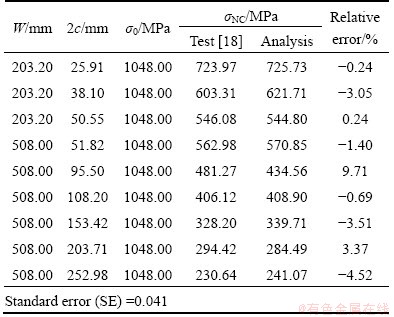
Table 8 Comparison of analytical and test results of center crack tensile specimen made of Ti-8Al-1Mo-1V alloy (t=6.35 mm, KASC=145.5 MPa��m1/2, ��aca=0.074)
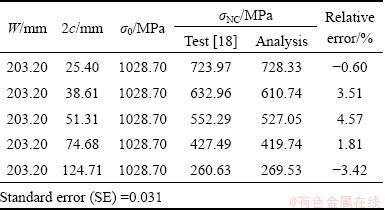
Table 9 Comparison of analytical and test results of center crack tensile specimen made of Ti-5Al-2.5Sn alloy (t=0.51 mm, KASC=98.3 MPa��m1/2, ��aca=0.175)
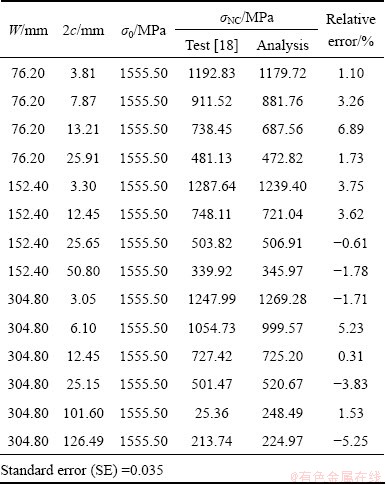
Table 10 Comparison of analytical and test results of center crack tensile specimen made of Ti-5Al-2.5Sn alloy (t=1.60 mm, KASC=62.3 MPa��m1/2, ��aca=0.197)
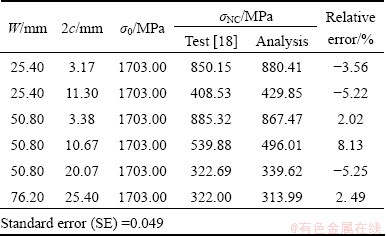
Table 11 Comparison of analytical and test results of center crack tensile specimen made of Ti-5Al-2.5Sn alloy (t=2.54 mm, KASC=76.6 MPa��m1/2, ��aca=0)
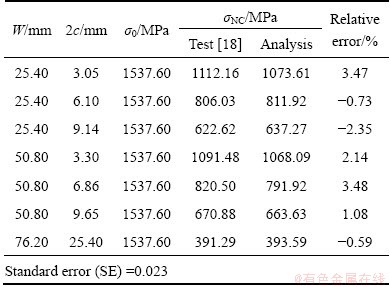
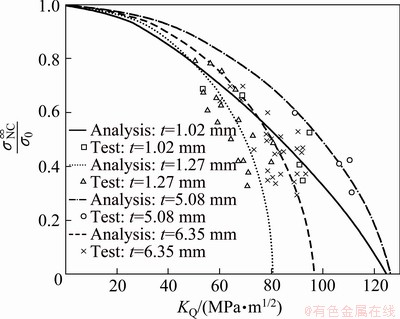
Fig. 4 Failure assessment diagrams of Ti-6Al-4V titanium alloys with different thicknesses compared with test data [18]
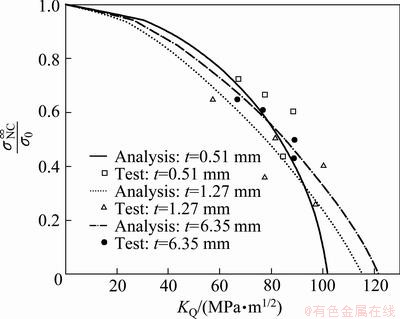
Fig. 5 Failure assessment diagrams of Ti-8Al-1Mo-1V titanium alloys with different thicknesses compared with test data [18]
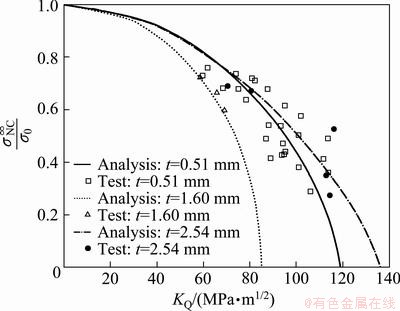
Fig. 6 Failure assessment diagrams of Ti-5Al-2.5Sn titanium alloys with different thicknesses compared with test data [18]
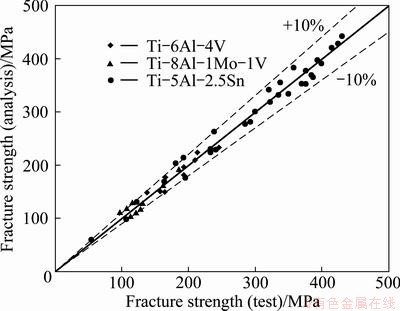
Fig. 7 Comparison of tensile fracture strength of titanium alloys
4 Conclusions
A simple and realistic relation for the characteristic length in the average stress criterion is established for accurate evaluation of fracture strength of cracked bodies. The procedure is validated considering the fracture data of titanium alloys generated from center crack tensile specimens. Failure assessment diagrams were generated from the determined fracture parameters and showed the fracture data close to the failure boundary. Fracture strength of any other cracked configurations can be evaluated utilizing the present theory with the correction factor for the stress intensity factor of the cracked body and the unflawed strength of the configuration.
References
[1] NEWMANN J C Jr. An evaluation of fracture analysis methods [M]. ASTM�CSTP�C896, 1985: 5-96.
[2] GORDON J R. A review of fracture assessment procedures and their applicability to welded structures [J]. Canadian Metallurgical Quarterly, 1993, 32: 195-203.
[3] SHIN C S, WU P L, JAO W T. A re-appraisal of the net-section plastic collapse method in the assessment of elastic�Cplastic fracture [J]. Journal of the Chinese Society of Mechanical Engineers, 1992, 13: 198-204.
[4] CHRISTOPHER T, SANKARANARAYANASAMY K, NAGESWARA RAO B. Fracture behavior of Maraging steel tensile specimens and pressurized cylindrical vessels [J]. Fatigue, Fracture of Engineering Materials and Structures, 2004, 27: 177-186.
[5] CHRISTOPHER T, SANKARANARAYANASAMY K, NAGESWARA RAO B. Correlating cryogenic fracture strength using a modified two�Cparameter method [J]. Engineering Fracture Mechanics, 2005, 72: 475-490.
[6] NAGESWARA RAO B, ACHARYA A R. Fracture strength for thin structural components containing surface cracks [J]. Metallkde Z, 1989, 80: 596�C600.
[7] DUGDALE D S. Yielding of steel sheets containing slits [J]. Journal of the Mechanics and Physics of Solids, 1960, 8: 100-108.
[8] NEWMANN J C Jr. The merging of fatigue and fracture mechanics concepts: A historical perspective [J]. Progress in Aerospace Sciences, 1998, 34: 347�C390.
[9] KELLER H P, JUNKER G, MERKER W. Fracture analysis of surface cracks in cylindrical pressure vessels applying the two parameter fracture criterion [J]. International Journal of Pressure Vessels and Piping, 1987, 29: 113-153.
[10] ZERBST U, HAMANN R, WOHLSCHLEGEL A. Application of the European flaw assesment procedure SINTAP to pipes [J]. International Journal of Pressure Vessels and Piping, 2000, 77: 697�C 702.
[11] KIEFNER J F, MAXEY W A, EIBER R J, DUFFY A R. Failure stress levels of flaws in pressurized cylinders [M]. ASTM STP, 1973: 461-481.
[12] NAGESWARA RAO B, ACHARYA A R. Fracture analysis of a surface cracked plate under tension [J]. Engineering Fracture Mechanics, 1989, 32: 551-559.
[13] SUBHANANDA RAO A, KRISHNA Y, NAGESWARA RAO B. Comparison of fracture models to assess the notched strength of composite/solid propellant tensile specimens [J]. Materials Science and Engineering A, 2004, 385(1-2): 429-439.
[14] JEYAKUMAR M, CHRISTOPHER T. Fracture strength evaluation of center-crack tensile specimens made of heat-treated wrought aluminium alloys [J]. Materials Science Research Journal, 2008, 2: 53-71.
[15] BRIGHTON H, CHRISTOPHER T. Tensile-fracture strength of heat-treated 2xxx series aluminium alloys [J]. Material Science Research Journal, 2009, 3: 23-40.
[16] RAJAKUMAR S, CHRISTOPHER T. Generation and validation of failure assessment diagrams for high strength alloys utilizing the inherent flaw model [J]. Materials Science Research Journal, 2010, 4: 1-14.
[17] RAJAKUMAR S, CHRISTOPHER T. Fracture strength of centre surface cracked tensile specimens made of 2219T87 Al alloy welding [J]. Transactions of Nonferrous Metals Society of China, 2011, 21(12): 2568-2575.
[18] Metals and Ceramic Information Center, Battelle. Damage tolerance design handbook: A compilation of fracture and crack growth data for high strength alloys [R]. MCIC�CHB�C01, Ohio: Columbus Laboratories, 1975.
[19] KAMALA KANNAN V, MURALI V, NAGESWARA RAO B. Modified average stress criterion to predict the fracture strength of various lay-ups of carbon/epoxy laminates [J]. Journal of Reinforced Plastics and Composites, 2010, 29(3): 346-358.
[20] PARIS P C, SIH G C. Stress analysis of cracks in fractured toughness testing and its applications [J]. ASTM�CSTP�C381, 1965: 30-83.
[21] PARTON V Z, MOROZOV E M. Elastic�Cplastic fracture mechanics [M]. Moscow: MIR Publications, 1978: 22-30.
[22] LEKHNITSKII S G. Anisotropic plates [M]. 2nd Ed. TSAI S W, CHERON T, trans. New York: Gordon and Breach, 1968.
[23] WHITNEY J, NUISMER R. Stress fracture criteria for laminated composites containing stress concentrations [J]. Journal of Composite Materials, 1974, 8: 253-265.
[24] MURAKAMI Y. Stress intensity factors handbook [M]. New York: Pergamon Press, 1987.
�Ľ���ƽ��Ӧ������ѺϽ����ǿ�ȵ�����
H. BRIGHTON ISAAC JOHN1, T. CHRISTOPHER2
1. Sardar Raja College of Engineering, Alangulam, Tirunelveli-627 808, India;
2. Government College of Engineering, Perumalpuram, Tirunelveli-627 007, India
ժ Ҫ���ṹ�����Է���ͨ��������֤��������غɴ��ݵĺ����ԡ�����ģ�ͶԺ���ȱ�ڵ��ѺϽ����ǿ�ȵ�Ԥ��ȡ���ڲ��ϵ���ȱ��ǿ���Լ�ȱ��������ǰ���ٽ糤�ȡ����������ٽ糤��ͨ��ȡ���ڲ��ϡ������Լ���ȱ�ڵijߴ硣ƽ��Ӧ������Ϊһ��Ӧ�������������Ժ���ȱ�ڵ��ѺϽ���ǿ�Ƚ��о�ȷԤ�⡣���ڲ�ͬ��ȵ������ѷ��ѺϽ�Ķ������ݣ���ƽ��Ӧ������иĽ���ȱ��(����)ǿ�ȵ�Ԥ��ֵ����Խ���ӽ��������Ľ���ƽ��Ӧ������Լ���Ԥ��ȱ�ڵĿ���ǿ�ȡ�
�ؼ��ʣ��ѺϽ�������������������Ӧ����ʧЧ����ͼ������ǿ��
(Edited by Xiang-qun LI)
Corresponding author: H. BRIGHTON ISAAC JOHN; E-mail: engineer7077@yahoo.in
DOI: 10.1016/S1003-6326(13)62568-6

