Trans. Nonferrous Met. Soc. China 22(2012) s585-s595
Effects of elastic-plastic properties of materials on residual indentation impressions in nano-indentation using sharp indenter
Jung-Min LEE1, Chan-Joo LEE1, Kyung-Hun LEE2, Byung-Min KIM3
1. Dongnam Regional Division, Korea Institute of Industrial Technology, Busan 618-230, Korea;
2. Precision Manufacturing Systems Division, Pusan National University, Busan 609-735, Korea;
3. School of Mechanical Engineering, Pusan National University, Busan 609-735, Korea
Received 21 May 2012; accepted 19 November 2012
Abstract: One of the primary features of nano-indentation technique is that the contact area induced by an indenter is indirectly measured by a relationship between the penetration depth and the known geometry of the indenter. However, this indirect measurement occasionally leads to inaccurate properties of the indented material. The objective of this study is to investigate the effects of E*/σr and the strain hardening exponents n of materials on the behaviors of pile-up and sink-in in nano-indentation and to predict n values of materials from the residual indentation impressions. The relations between the residual indentation profile and n value of the indented material were identified by dimensional analysis. Also, they were numerically formulated using FE analysis of nano-indentation for 140 different combinations of elastic-plastic parameters such as E, σy and n. The parameters of hrp/hm, herp/hm, Rr/hm and HO&P/Hreal were introduced as various dimensionless parameters to represent and quantify the residual indentation profile after indentation. They were subsequently characterized as dimensionless functions using n and E*/σr values. Finally, the validity of these functions was verified through 3D FE analysis of nano-indentation for Al 6061-T6 and AISI 1010 materials.
Key words: nano-indentation; pile-up; sink-in; strain hardening exponent; FE simulation
1 Introduction
Nano-indentation technique is widely used as the simplest and most direct method to obtain the mechanical properties of materials in very small volumes, such as elastic modulus E, hardness H, yield stress σy and strain hardening exponent n [1-5]. One of the main features of the technique is that the contact area induced by an indenter is indirectly measured by a relationship between the penetration depth and the known geometry of the indenter without any optical observations of the residual indentation impression. However, this indirect measurement occasionally leads to inaccurate properties of the indented material. These errors are mostly caused by the formation of pile-up and sink-in in contact during indentation, which involve the increase and decrease in the true contact area, respectively [2]. BOLSHAKOV and PHARR [6] reported that the true contact area of a sharp indenter could be underestimated up to 60% for a certain material in the case of piling-up, thereby leading to similar errors in calculating material properties like E and H.
OLIVER and PHARR’s method [7] was the most widely used to extract the contact (indentation) depth hp of the indenter from an initial unloading slope dPu/dh under load and is determined as
 (1)
(1)
where Pm and ξ are an indentation load at the indentation depth hm and a geometric constant of the indenters, respectively [4]. The contact area A of Berkovich indenter is defined as A=24.56hp2. However, CHENG and CHENG [1] found that OLIVER and PHARR’s method [7] is comparatively effective for most σy/E values when n is about 0.3 or when the ratio of σy/E (>0.05 for 0<n<0.5) is very large.
The effects of pile-up and sink-in in indentation were studied by many researchers until now [1-3,6-13]. For the indentation of the materials in elastic region, the specimen surface typically tends to be sink-in. On the other hand, for the materials including elastic-plastic deformations, the behaviors of pile-up and sink-in are dependent on their E/σy and n values [1-4]. In general, the piling-up occurs when E/σy is extremely low or n is close to zero and sinking-in is dominant when n>0.3. Therefore, completely understanding and predicting the effects of pile-up and sink-in in indentation is crucial in extracting the accurate properties of the indented material [1].
This work was designed to investigate the effects of E*/σr [5] and n values of materials on the behaviors of pile-up and sink-in in nano-indentation and to estimate n values of materials from the residual indentation impressions. Relations between the residual indentation profile and n of the indented material were defined by dimensional analysis. Also, they were numerically formulated as dimensionless functions of E*/σr and n values using FE analysis of nano-indentation for 140 different combinations of elastic-plastic parameters such as E, σy and n. Finally, the validity of these functions was verified through 3D FE analysis of nano-indentation for Al 6061-T6 and AISI 1010 materials.
2 FE analysis of nano-indentation and definitions of pile-up and sink-in
2.1 FE analysis of nano-indentation
The FE simulations of nano-indentation were carried out for 140 different combinations of elastic- plastic parameters: E was varied from 10 GPa to 600 GPa, σy from 10 MPa to 2500 MPa, and n from 0.01 to 0.5 at 0.1 intervals, and Poisson ratio ν was fixed at 0.3. For both Berkovich and Vickers indenters, the corresponding apex angle of their two dimensional cone is 70.3° [1]. The FE model of nano-indentation (Fig. 1) was assumed to be axisymmetric two-dimension and the indenter was modeled as a rigid body. The contact between the indenter and materials was defined to be frictionless [14]. The maximum indentation depth hm was 1000 nm, where the size effect of the indented material is negligible [13]. All the simulations were performed using ABAQUS 6.3-1 based on large deformation theory [5,14,15].
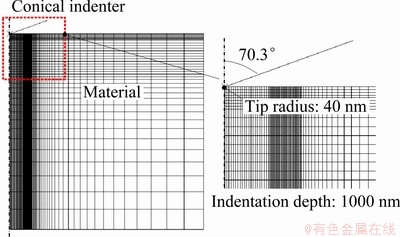
Fig. 1 FE model of nano-indentation using sharp indenter
Figure 2 shows the definitions of the contact boundary of pile-up and sink-in under full load and after complete unloading of the indenter in the FE simulations. hp/hm, hmp/hm, hrp/hm and Rr/hm were defined as dimensionless parameters to express the amounts of pile-up and sink-in in indentation. Here, hrp and Rr are the residual indentation depth and the residual contact radius by piling-up and sinking-in after unloading, respectively.
2.2 Definitions of pile-up and sink-in
The behaviors of elastic-plastic materials in an uniaxial tensile test can be expressed as a power law description. The power law true stress―true strain curve of materials can be assumed to be [1,5,15,16]:
 (2)
(2)
where K is the strength coefficient. Continuity of the curve in Eq. (2) requires K=σy(E/σy)n [1,5,15]. Therefore, E, n, σy and ν are the independent parameters to describe the power law behavior of materials. Applying the reduced modulus E*(=[(1-ν2/E)+ (1-νi2/Ei)]-1, i is indenter’s properties) and the representative stress σr , instead of E and σy, the behavior is represented as E, σr, ν and n. Here, σr is a plastic stress characterized by a deformation of the indented material beneath a sharp indenter in indentation process and is independent of the strain hardening exponents of materials [1,5]. In this study, σr is defined based on LEE’s research [15]. Using the dimensional analysis [5,15], the degrees of pile-up and sink-in are expressed as:
at hm during loading,
 (3)
(3)
and after unloading
 (4)
(4)
3 Estimations of convective heat transfer coefficients (CHTC)
3.1 Effects of E*/σr and n values on pile-up/sink-in
Figure 3 exhibits the effects of different E*/σr and n values on the amounts of pile-up and sink-in hp/hm at full load. The amounts of hp/hm were clearly distinguished into the phenomena of pile-up and sink-in at n=0.3 approximately. The piling-up and sinking-in of materials were more dependent on their E*/σr values than their n values in the range of E*/σr<300 approximately. On the other hand, they relied entirely on their n values in E*/σr<about 600. The phenomenon of sink-in was only observed, especially in E*/σr<about 100.
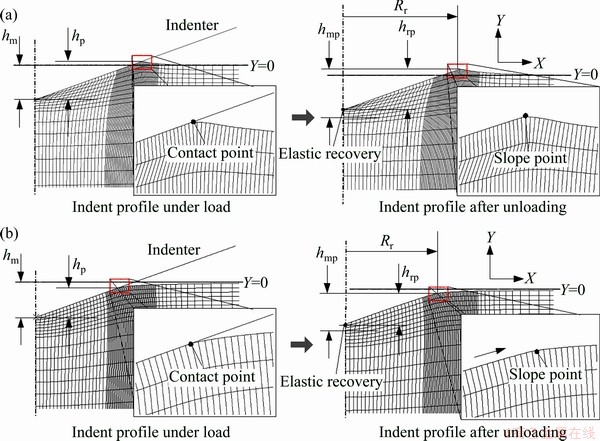
Fig. 2 Definitions of contact boundary of pile-up and sink-in under full load (a) and after complete unloading (b) of indenter
Figure 4 shows the stress distributions of materials beneath the indenter for piling-up (E=500 GPa, σy=150 MPa, n=0.5) and sinking-in (E=240 GPa, σy=650 MPa, n=0.01) at full load and after complete unloading. In the piling-up, the plastic zone beneath the indenter at full load was much larger than the contact radius of the indenter. Also, the residual stress distributions after unloading were widely placed near the indenter and over the piled-up part. Especially, there was little the difference in the maximum stress values before and after unloading.
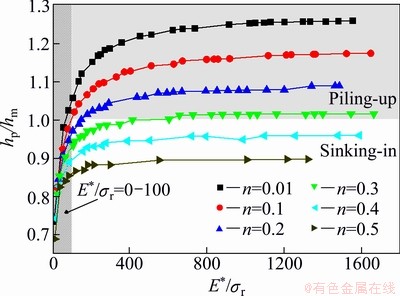
Fig. 3 Effect of different E*/σr and n values on amounts of pile-up and sink-in hp/hm at full load
In sinking-in, the plastic zone and the stress distributions were limited within the contact radius and were more deeply formed than those of pile-up. Also, the maximum stress distributions were concentrated on the indenter tip at full load, whereas they were only observed on the sank-in part and the values were much lower than those at full load. In general, the amounts of elastic recovery and the differences in the stress values before and after unloading were much larger in sinking-in than in piling-up.
The approximate range of E*/σr values for engineering metals with strain hardening properties are between 150 and 450 in Fig. 3. For the high strain hardening materials, the material within the plastic zone beneath the indenter becomes more hardened during indentation. As the indenter proceeds downward into the material, most of the plastic deformation occurs at the material around the plastic zone which is relatively softer. Therefore, the material near the indenter is observed to sink-in because the downward moving of the plastic zone by the indenter is more active during indentation [2,6]. For the low strain hardening materials, the moving of the plastic zone is blocked by its surrounding materials because the plastic zone is not hardened severely during indentation. Then, the material within the plastic zone moves toward free surface along the indenter surface where smaller deformation energy is required. Thus, the material near the indenter is observed to pile-up by this behavior of the plastic zone. The strain hardening materials, especially engineering metals, can be classified into piling-up and sinking-in around n=0.3.
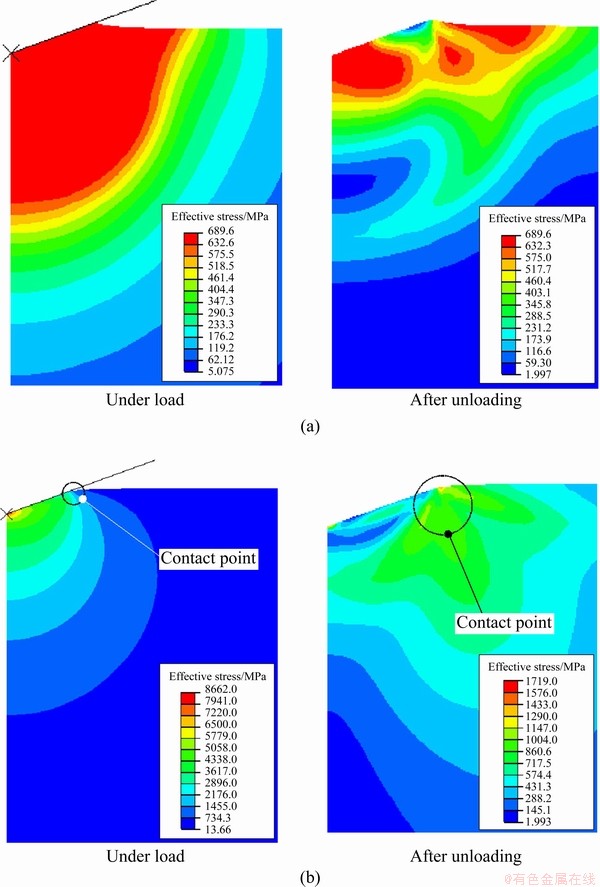
Fig. 4 Stress distributions beneath indenter for piled-up and sank-in materials at full load (a) and after complete unloading (b)
The effects of different E*/σr and n values on the amounts of pile-up and sink-in hmp/hm after unloading are shown in Fig. 5. The ratio of hp/hm was taken to quantitatively compare each amount of pile-up and sink-in at load in Fig. 3 and after unloading. Overall, piling-up was increased and sinking-in was released after unloading. These phenomena were much more obvious, especially in the range of E*/σr*/σr<400 appeared to be sink-in at full load in Fig. 3 but were changed into pile-up after unloading. Especially, when E*/σr<100 approximately, the phenomenon of sink-in during loading was dominant in most of the materials (Fig. 3). However, it was almost transformed to pile-up after unloading except some of the materials with above n=0.4. These results are called the pseudo-pile-up by LI et al [16]. The material with very low E*/σr values(E*/σr<100) is likely to be similar to the characteristics of rubbers or elastomers which have an extremely high elastic strain.
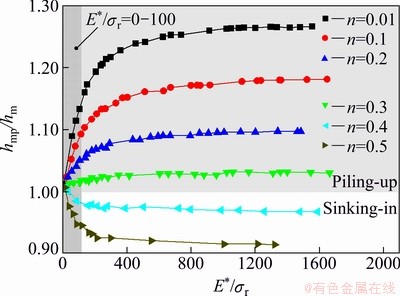
Fig. 5 Effects of different E*/σr and n values on amounts of pile-up and sink-in hmp/hm after unloading
Figure 6 shows the transition from sinking-in under full load to piling-up after complete unloading for the material with E=10 GPa, σy=750 MPa and n=0.01. The indentation profile at full load was placed down the original surface of the specimen (Y=0). However, after unloading the edge of the residual profile was displaced above the original surface by elastic recovery. In the case of the pseudo-pile-up, the pattern of the stress distribution under load was similar to that of sink-in in Fig. 4. However, the stress distributions below the indenter, which are almost a spherical shape, were more deeply and widely formed into the material and more narrowly placed within the contact radius than those of sink-in in Fig. 4. Also, there were the maximum stress distributions on the indenter tip after unloading unlike the sinking-in. This pseudo-piling-up may be often mistaken by observers for one of piled-up types in observations of the residual indentation impressions [16].
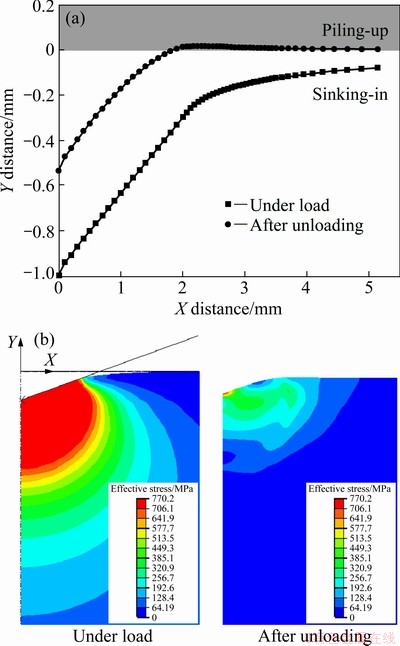
Fig. 6 Transition from sinking-in at full load to piling-up after complete unloading for pseudo-piled-up material
3.2 Quantifications of pile-up and sink-in after unloading
In Fig. 5 the behaviors and the phenomena of pile-up and sink-in can be easily distinguished and understood after unloading. However, the data are actually difficult to be approximated as one function. To solve this problem hrp/hm and Rr/hm were introduced as dimensionless parameters to represent their phenomena and were expressed as functions of E*/σr and n values after complete unloading in Figs. 7 and 8, respectively. Figures. 7 and 8 were numerically formulated as dimensionless П2 and П3 functions (Appendix A). Their closed forms were completed with fitting all 140 data points within ±3.0% errors.
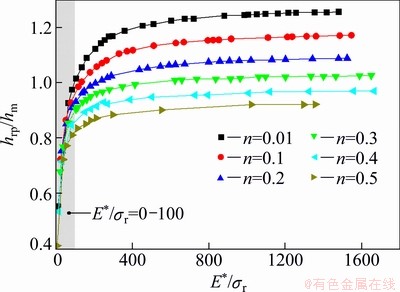
Fig. 7 Variations of hrp/hm as functions of E*/σr and n values after complete unloading (dimensionless П2 function)
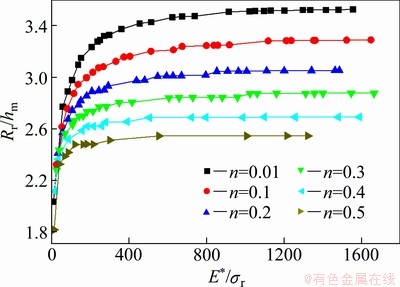
Fig. 8 Variations of Rr/hm as functions of E*/σr and n values after complete unloading (dimensionless П3 function)
Figure 9 shows the variations of HO&P/Hreal as functions of E*/σr and n values after unloading. Here, HO&P is the Oliver and Pharr’s hardness calculated by the contact area AO&P=24.56hm2. Hreal is the real hardness obtained by the real residual projected area Areal=πRr2 which was calculated from the FE simulations of nano-indentation. As shown in Fig. 9, HO&P was overestimated (the underestimation of the contact area) for piling-up while it was underestimated (the overestimation of the contact area) for sinking-in, compared with Hreal. Furthermore, HO&P was completely underestimated in the range of E*/σr*/σr<200 approximately, Hreal was similar to HO&P. Especially, the differences between Hreal and HO&P were the maximum of 60% for piling-up when n=0.01 and E*/σr>600 and 20% for sinking-in when n=0.5 except the region where E*/σr values are below 100, respectively. These graphs were numerically formulated as dimensionless П4 function (Appendix A) in the same way as previously.
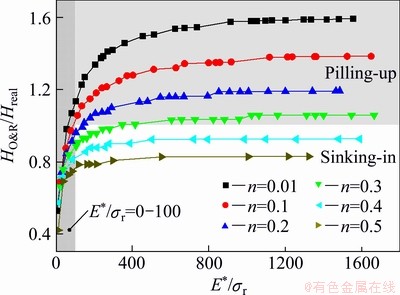
Fig. 9 Variations of HO&P/Hreal as functions of E*/σr and n values after complete unloading (dimensionless П4 function)
4 Verifications of dimensionless functions
4.1 Geometrical definitions of pile-up from residual indentation profiles
Figure 10 shows the geometrical definitions for the residual indentation profiles of the piled-up material induced by the Berkovich indenter [13]. These definitions are premised on the assumption that the behavior of pile-up only appears along the flat faces of the indenter and not at corners. Also, the periphery of the piled-up material forms an arc along the triangle edge on the projected contact area. Hence, the projected contact area can be modeled as equilateral triangle bounded by arcs, as shown in Fig. 10. Here, Atpile is the total projected area of the piled-up indentation impression after unloading which is calculated by the triangle and the areas enclosed by the arcs. Apile is the extra area due to piling-up and AO&P is the area determined using Oliver and Pharr’s analysis. The width of the arc Xpile is equal to the projected width of the piled-up part. Thus, Atpile can be calculated as Atpile=AO&P+3Apile where AO&P is given by
 (5)
(5)
Under the assumption that AO&P is the equilateral triangle (60°), the length of one side a of the triangle is then given by a/2=(Xtpile-Xpile)tan θ/2. The contact radius R was calculated by measuring the dimension of the arc which is the three-point arc connecting both edges of a and Xpile on the center of a. Using R and a, the angle of the arc θR can be calculated by
 or
or  (6)
(6)
Thus, Apile is given by
 (7)
(7)
and hpile and hrp are finally expressed as follows
 and
and  (8)
(8)
The geometrical parameters of the residual indentation profile in Fig. 10 can be easily determined by the optical observations such as AFM and SEM [13].
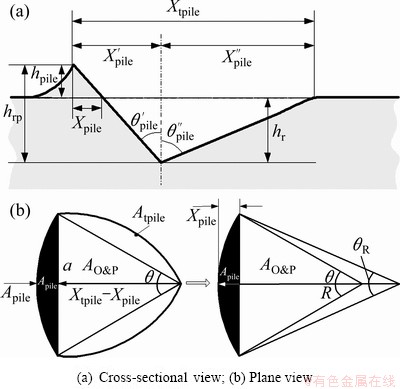
Fig. 10 Residual projected area and cross-sectional profile of piled-up materials by Berkovich indenter
Figure 11 shows the residual projected area and cross-sectional profile of the Berkovich indenter transformed to the equivalent-conical indenter. This area is called the equivalent-residual projected area in this study. Assuming that Atpile is identical with the equivalent-residual projected area, Atpile can be rewritten using the equivalent-residual contact radius Rtpile of the conical indenter as Atpile=AO&P+3Apile=πRtpile2. Thus, Rtpile is given as Rtpile=[(AO&P+3Apile)/π]1/2. In Fig. 11, Xepile is then Rtpile-RO&P where RO&P is the equivalent-residual contact radius of AO&P and is written as:
 (9)
(9)
where Xepile is the equivalent-residual width due to piling-up transformed to the conical indenter. Assuming that hr of the Berkovich indenter is the same as that of the conical indenter, the equivalent-residual angle θeq is defined as θeq=tan-1(RO&P/hr). Thus, the equivalent- residual piled-up depth hepile and the total equivalent- residual indentation depth herp are given as
 ,
,  (10)
(10)
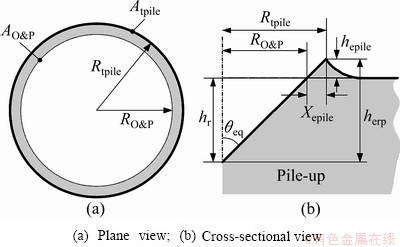
Fig. 11 Residual projected area and cross-sectional profile of piled-up by equivalent cone indenter
4.2 3D FE simulations of nano-indentation using Berkovich indenter
To verify the geometrical definitions of pile-up and dimensionless functions constructed in this study, 3D FE simulations of nano-indentation using the Berkovich indenter was performed. The 3D FE model was assumed to be 1/2 section of the indenter. Materials used in the 3D simulations are Al6061-T6 and AISI 1010, respectively. The elastic-plastic properties of each material were obtained from an uniaxial tensile tests and are listed in Table 1. Figure 12 shows the initial mesh system of 3D FE model and the configuration of the Berkovich indenter. General conditions for the 3D FE simulations of nano-indentation are identical with those of the previous 2D simulations in section 2.1.
Table 1 Mechanical properties of Al 6016-T6 and AISI 1010
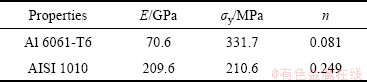
Figure 13 shows the stress distributions of the indentation impressions for Al 6061-T6 and AISI 1010 at full load and after unloading. The phenomenon of pile-up was clearly observed in both Al 6061-T6 and AISI 1010 because their n values are smaller than 0.3, which is an approximate base value to separate piling-up and sinking-in in engineering metals in Fig. 3. However, it was slightly smaller in AISI 1010 than in Al 6061-T6 by differences in their n and E*/σr values. Figure 14 shows the residual indentation profiles of Al 6061-T6 and AISI 1010 obtained from 3D simulations. These data were used to define the geometries and the degrees of pile-up for each material.
4.3 Estimations of strain hardening exponents using П2, П3 and П4 functions
The geometrical definitions (marked in Figs. 10 and 11) and the dimensionless parameters (hrp/hm, herp/hm, Rr/hm and HO&P/Hreal) of pile-up calculated from the residual indentation profiles (Fig. 14) for each material are summarized in Tables 2 and 3, respectively. Here, hrp is the value directly extracted from the residual profiles. On the other hand, herp and Rr are the values converted into its equivalent-conical shape by equations in section 4.1. In addition to these, E* and σr values of Al 6061-T6 and AISI 1010 that are necessary to use the dimensionless functions established in section 3.2 were obtained from LEE’s study [15].
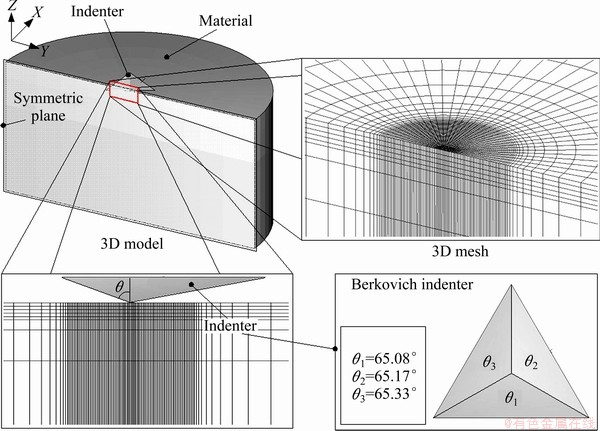
Fig. 12 Initial mesh system for 3D simulations of nano-indentation and shape of Berkovich indenter
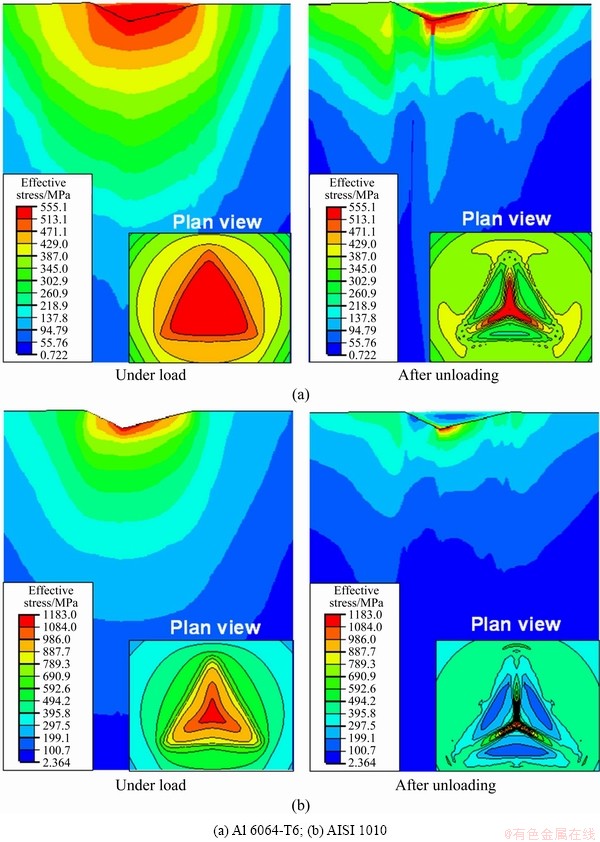
Fig. 13 Stress distributions of indentation impressions for Al 6061-T6 at full load and after unloading
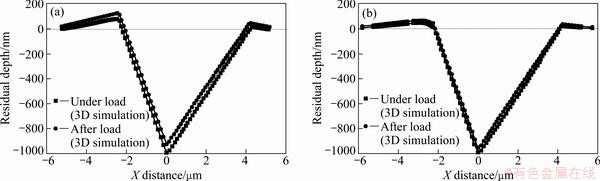
Fig. 14 Cross-sectional profiles of indentation impressions at full load and after unloading for Al 6061-T6 (a) and AISI 1010 (b)
The n values of Al 6061-T6 and AISI 1010 predicted using these parameters and dimensionless П2, П3 and П4 functions are listed in Table 4. The results showed that all the functions provided relatively exact n values which are within 10% errors in comparison with those of the tensile test. However, this margin of error was intensely variable with some measurement errors of the residual indentation profiles. Figure. 15 shows the changes in n values with ±5% errors of the dimensionless parameters in Table 3. The n values in Fig. 15 are expressed as the percent relative error ((nП-ntensile)/ntensile×100%) compared with those of the tensile test.
Overall, AISI 1010 was much less sensitive to the errors than Al 6061-T6. Also, the П4 function led to the smallest maximum and minimum deviations within the given errors. These differences in the sensitivity are mostly caused by E*/σr values of each material and the ranges of the dimensionless parameters (hrp/hm, herp/hm, Rr/hm and HO&P/Hreal) available at each functions. As illustrated in Figs. 7, 8 and 9, the range of the dimensionless parameters available at a given E*/σr value becomes narrower as E*/σr values decrease. Also, the ratio of HO&P/Hreal (П4 function) has a comparatively wider range of the applicable parameter at a certain E*/σr value than others. For these reasons, the sensitivity to the measurement errors of the residual indentation profile is somewhat changed according to the П functions and the materials used.
Table 2 Geometrical parameters of pile-up obtained from 3D simulations of nano-indentation
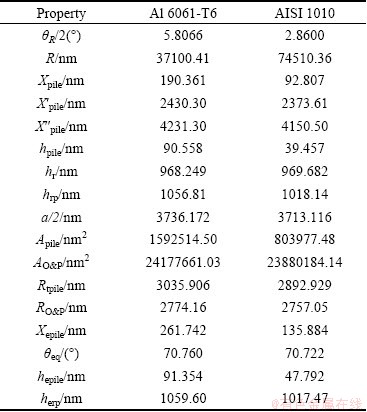
Table 3 Dimensionless parameters of residual indentation profiles calculated from 3D simulations of nano-indentation
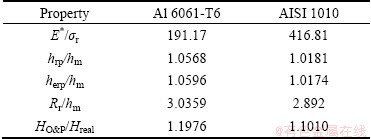
Table 4 n values of Al 6061-T6 and AISI 1010 predicted from 3D simulations of nano-indentation
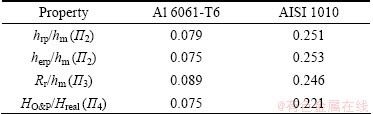
Figure 16 exhibits the variations of the indentation profiles according to measurement methods after unloading. In Fig. 16(a), the piled-up point in the indentation profile is not ideally sharp but very smooth curve. If the indentation profile is based on top point (profile A) or the inflection point (profile B), both the contact radius and the projected area may be over- or underestimated, respectively. In addition, the residual indentation depth also fluctuates according to how to choose the indentation profile. Actually, there are no definitive standard rules to define the shapes and the degrees of pile-up from the residual indentation impression.
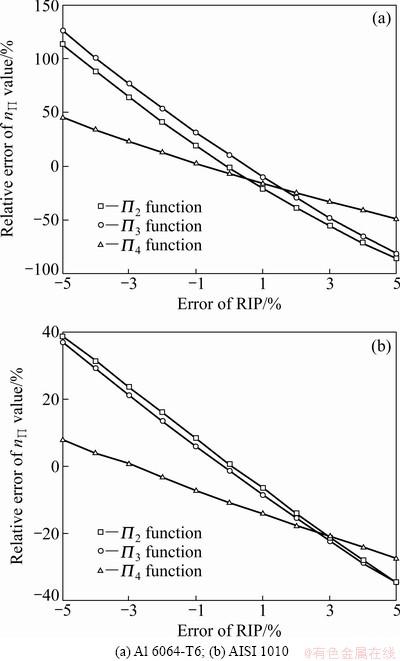
Fig. 15 Changes in n values with ±5% errors of dimensionless parameters
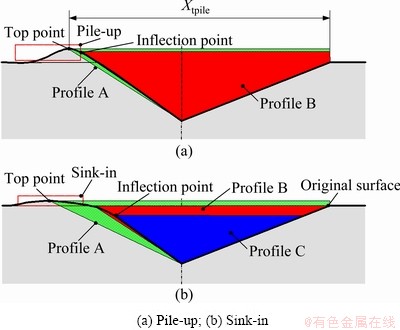
Fig. 16 Variations of indentation profiles according to measurement methods after unloading
Whether profile A or B is chosen, the change in hrp will be almost smaller than that in Xtpile, which subsequently affects the calculations of Rr and Areal. However, as mentioned above, hrp/hm has a narrow range of applications for a given E*/σr value and Rr/hm changes drastically with some measurement errors. In other words, if the choice of profile A or B leads to within ±5% errors for hrp/hm, it will actually exceed that range for Rr/hm. Therefore, it is more desirable that profile A (the inflection point) is adopted as the residual indentation profiles to reduce errors in the predicted values from each function. Estimation of n values on the sank-in materials was not considered in this study. As shown in Fig. 16(b), the geometrical definitions on the sank-in amounts in the residual indentation profiles are very intricate and uncertain works. Thus, herp/hm, Rr/hm and HO&P/Hreal cannot be actually used and hrp/hm is only available as the dimensionless parameter to represent sinking-in. However, hrp/hm (П2 function) is very sensitive to the measurement errors and more changeable according to how to choose the indentation profiles than that of piling-up. To solve these problems, it is first necessary to determine the proper measurement method of the sank-in part. These problems, including the geometrical definitions of sink-in, will be discussed in further research in detail.
5 Conclusions
1) The indentation impressions of materials are divided into the phenomena of pile-up and sink-in at n=0.3 approximately. Also, the piling-up and sinking-in of materials are more dependent on their E*/σr values than their n values in the range of E*/σr*/σr>about 600. When E*/σr<100 approximately, the phenomenon of sink-in mostly appears over all the materials independently of their n values at full load. However, it is inversely changed into pile-up after complete unloading. This effect is called the pseudo- pile-up and is dominant in the range of extremely small E*/σr.
2) The real hardness Hreal calculated from the real residual projected area is underestimated up to a maximum of 60% at n=0.01 for pile-up and is over- estimated up to a maximum of 20% at n=0.5 for sink-in except the region where E*/σr values are below 100, respectively, in comparison with OLIVER and PHARR’s hardness HO&P.
3) The dimensionless П2, П3 and П4 functions provide the estimation of n values within 10% error from the residual indentation profiles of Al 6061-T6 and AISI 1010 obtained from 3D simulations of nano-indentation. However, the smaller the indented material has E*/σr value, the more these functions are sensitive to the measurement error of the residual indentation profile. This is because the range of the dimensionless parameters (hrp/hm, herp/hm, Rr/hm and HO&P/Hreal) at a given E*/σr value grows progressively narrower as E*/σr values decrease. Also, the shape and the degree of pile up should be defined based on the inflection point of the piled-up part in the residual indentation profiles to minimize the error of the dimensionless functions.
4) As the above result, a series of dimensionless functions constructed in this study are expected to help conveniently understand and predict an approximate strain hardening exponent of the material in very small volumes such as thin films, coatings, microelectronic devices and MEMS.
Appendix A


References
[1] CHENG Y T, CHENG C M. Scaling, dimensional, and indentation measurements [J]. Material Science and Engineering R, 2004, 44: 91-149.
[2] FISCHER-CRIPPS A C. Nanoindentation [M]. New York: Springer- Verlag, 2002.
[3] FISCHER-CRIPPS A C. Introduction to contact mechanics [M]. New York: Springer-Verlag, 2002.
[4] RIETH M, SCHOMMER W. Handbook of Theoretical and computational nanotechnology Vol. 4 [M]. Los Angeles: American Scientific Publishers, 2004: 387-461.
[5] DAO M, CHOLLACOOP N, van VLIET K J, VENKATESH T A, SURESH S. Computational modeling of the forward and reverse problems in instrumented sharp indentation [J]. Acta Materialia, 2001, 49: 3899-3918.
[6] BOLSHAKOV A, PHARR G M. Influence of piling-up on the measurement of mechanical properties by load and depth sensing indentation techniques [J]. Journal of Material Research, 1998, 13(4): 1049-1058.
[7] OLIVER W C, PHARR G M. An improved technique for determining hardness and elastic-modulus using load and displacement sensing indentation experiments [J]. Journal of Materials Research, 1992, 7(6): 1564-1583.
[8] LI Z C, KESE K. Semi-ellipse method for accounting for the pile-up contact area during nanoindentation with the Berkovich indenter [J]. Scripta Materialia, 2006, 55(8): 699-702.
[9] GARRIDO MANEIRO M A, RODRIGUEZ J. Pile-up effect on nanoindentation tests with spherical-conical tips [J]. Scripta Materialia, 2005, 52(7): 593-598.
[10] RODRIGUEZ J, GARRIDO M A. A procedure to prevent pile-up effects on the analysis of spherical indentation data in elastic-plastic materials [J]. Mechanics of materials, 2007, 39(11): 987-997.
[11] DAS G, Ghosh S, Ghosh S, Ghosh R N. Materials characterization and classification on the basis of materials pile-up surrounding the indentation [J]. Materials Science & Engineering A, 2005, 408: 158-164.
[12] MCELHANEY K W, VLASSAK J J, NIX W D. Determination of indenter tip geometry and indentation contact area for depth-sensing indentation experiments [J]. Journal of Material Research, 1998, 13(5): 1300-1306.
[13] TALJAT B, PHARR G M. Development of pile-up during spherical indentation of elastic-plastic solids [J]. International Journal of Solids and Structures, 2004, 41(14): 3891-3904.
[14] BUCAILLE J L, STAUSS S, FELDER E, MICHLER J. Determination of plastic properties of metals by instrumented indentation using different sharp indenters [J]. Acta Materialia, 2003, 51(6): 1663-1678.
[15] LEE J M, LEE C J, KIM B M. Reverse analysis of nano-indentation using different representative strains and residual indentation profiles [J]. Material & Design, 2009, 30(9): 3395-3404.
[16] LI Z, CHENG Y T, YANG H T, CHANDRASEKAR S. On two indentation hardness definitions [J]. Surface & Coatings Technology, 2002, 154(2-3): 124-130.
(Edited by HE Xue-feng)
Foundation item: Project (2010-0008-277) supported by the NCRC (National Core Research Center) Program through the National Research Foundation of Korea, funded by the Ministry of Education, Science, and Technology, Korea; Project supported by R&D for Technology Development Program of Ministry of Knowledge Economy, Korea
Corresponding author: Byung-Min KIM; Tel: +82-51-5103074; E-mail: bmkim@pusan.ac.kr
DOI: 10.1016/S1003-6326(12)61770-1

