A fast method to evaluate water eutrophication
来源期刊:中南大学学报(英文版)2016年第12期
论文作者:王国胤 严胡勇 张学睿 董建华 闪锟 吴迪 黄昱 周博天 苏宇婷
文章页码:3204 - 3216
Key words:rough set theory; petri nets; eutrophication
Abstract: Water eutrophication has become a worldwide environmental problem in recent years. Once a water body is eutrophicated, it will lose its primary functions and subsequently influence sustainable development of society and economy. Therefore, analysis of eutrophication becomes one of the most essential issues at present. With the ability to deal with vague and uncertain information, and express knowledge in a rule form, the rough set theory (RST) has been widely applied in diverse domains. The advantage of RST is that it can compress the rule and remove needless features by reduction inference rule. By this way, the rule gets effectively simplified and inference efficiency gets improved. However, if data amount is relatively big, it could be a process with large calculated amount to search rules by looking up tables. Petri nets (PNs) possesses so powerful parallel reasoning ability that inference result could be obtained rapidly merely by simple matrix manipulation with no need for searching rules by looking up tables. In this work, an integrated RPN model combining RST with PN was used to analyze relations between degrees of water eutrophication level and influence factors in the Pengxi River of Three Gorges Reservoir. It was shown that the RPN model could analyze water eutrophicaion accurately and quickly, and yield decision rules for the decision-makers at water purification plants of the water quality and assist them in making more cost-effective decisions.
J. Cent. South Univ. (2016) 23: 3204-3216
DOI: 10.1007/s11771-016-3386-4

YAN Hu-yong(严胡勇)1, WANG Guo-yin(王国胤)1, ZHANG Xue-rui(张学睿)1, DONG Jian-hua(董建华)1,
SHAN Kun(闪锟)1, WU Di(吴迪)1, HUANG Yu(黄昱)1, ZHOU Bo-tian(周博天)1, SU Yu-ting(苏宇婷)2
1. Big Data Mining and Applications Center, Chongqing Institute of Green and Intelligent Technology,
Chinese Academy of Sciences, Chongqing 400714, China;
2. School of Computer & Information Technology, Northeast Petroleum University, Daqing 163318, China
 Central South University Press and Springer-Verlag Berlin Heidelberg 2016
Abstract: Water eutrophication has become a worldwide environmental problem in recent years. Once a water body is eutrophicated, it will lose its primary functions and subsequently influence sustainable development of society and economy. Therefore, analysis of eutrophication becomes one of the most essential issues at present. With the ability to deal with vague and uncertain information, and express knowledge in a rule form, the rough set theory (RST) has been widely applied in diverse domains. The advantage of RST is that it can compress the rule and remove needless features by reduction inference rule. By this way, the rule gets effectively simplified and inference efficiency gets improved. However, if data amount is relatively big, it could be a process with large calculated amount to search rules by looking up tables. Petri nets (PNs) possesses so powerful parallel reasoning ability that inference result could be obtained rapidly merely by simple matrix manipulation with no need for searching rules by looking up tables. In this work, an integrated RPN model combining RST with PN was used to analyze relations between degrees of water eutrophication level and influence factors in the Pengxi River of Three Gorges Reservoir. It was shown that the RPN model could analyze water eutrophicaion accurately and quickly, and yield decision rules for the decision-makers at water purification plants of the water quality and assist them in making more cost-effective decisions.
Key words: rough set theory; petri nets; eutrophication
1 Introduction
Water eutrophication is one of the most challenging environmental problems in the world. The increasing severity of water eutrophication has been brought to the attention of both the governments and the public recently [1]. Once a water body is eutrophicated, it will lose its primary functions and subsequently influence sustainable development of society and economy. The efforts to manage the adverse impact on eutrophication have substantially widened from decades ago in China. For instance, the Ministry of Environmental Protection of China issued Environmental Quality Standards for Surface Water (GB 3838-2002) to administrate the water quality of surface waters and lakes in early 2002 [2]. However, water eutrophication and subsequent deterioration of water quality were still often reported [3-4]. According to the “2008 Yearly Environment Status Report of China”, 3.8% of the lakes and reservoirs in China were severely eutrophicated. Another 19.2% and 23.0% were moderately and mildly eutrophic, respectively. China faces widespread water degradation due to eutrophication. Therefore, the solution of water eutrophication and recovery of the multiple functions of the water ecosystem have become the key problems for environmentalists at present.
Many approaches have been applied to analyzing water eutrophication, such as Carlson trophic state index [5], modified Carlson’s trophic state index(TSIM) [6], trophic state TRIX [7], comprehensive nutrition state index [8], eutrophication index [9-10], principal component analysis [11-13], neural network [14-18], matter element analysis [19], set pair analysis [20-21], statistical analysis [22-23], grey theory [21, 24], cluster analysis [25], and assessment of estuarine trophic status [26].
However, the approach of rough set theory (RST) has not been widely applied in water eutrophication before. RST [27] is a kind of theoretical method studying the expression, acquirement and generalization of incomplete and inaccurate knowledge. As a mathematical tool to deal with uncertain information, it has the capacity to compress and reduce data. Meanwhile, with no need for any apriori information or artificial assumption, the generation of rules is completely driven by data. Thus, more objectivity is revealed [28]. Because RST has so many advantages, it has been used widely in various fields, such as water quality assessment [29-31], cyanobacterial bloom outbreaks analysis [32], debris flow disaster prediction [33], electricity load analysis [34], academic achievement analysis [35], fault diagnosis [36-37], medical image process [38-39], credit rating decision [40-41], text classification [42-43] and web services classification [44]. However, on the other hand, RST also has non-ignorable defects: data handling capacity of continuous data is limited; it can only conduct reduction according to the fixed algorithm; no learning capacity is possessed. Moreover, mode of processing information is serial.
Petri net (PN) is a kind of efficient tools of modeling and analysis. It can preferably describe the system structure, show relations such as parallel, synchronization and causality in the system, simulate the event system and analyze the dynamic property of system concisely and intuitively in the form of graphs. The analytical method based on PN can fuse knowledge representation, analysis and inference together and complete descriptive knowledge and procedural reasoning. Inference result can be obtained rapidly merely by simple matrix calculation. PN can construct a model for parallel processing information. But the model can be set on condition that fixed rules are given artificially. The parallel processing of PN is of help to efficient system management of RST to reach a result of win-win.
Thus, an integrated model RPN, which contains RST model and PN was developed to analyze the water eutrophication in this work, which will provide theoretical support for protection of water resources and scientific management.
2 Methods
2.1 ChiMerge
Because rough set can only handle discrete values, decision tables are necessary to be discretized and then handled by rough set if they are continuous values. There are many data discretization methods such as equal- frequency method and equal-distance method. However, decision attributes are not utilized in this method in the process of discretization so that good effect is hard to achieve. Thus, these methods are not suitable for this work. ChiMerge discretization algorithm is put forwarded by KERBER in 1992 [45] and it is a supervisory bottom-up statistical algorithm. Information of decision attributes is taken into consideration in the process of discretization. Therefore, this method is superior to equal-frequency method and equal-distance method. ChiMerge algorithm is shown as follows:
1) Living examples are sorted according to the discrete attributes. Each living example belongs to one interval.
2) χ of each coupe of adjacent intervals is calculated and the couple with minimum χ is merged. The χ is computed as follows:
 (1)
(1)
 (2)
(2)
 (3)
(3)
 (4)
(4)
 (5)
(5)
where k is the number of the decision attribute; Aij is the number of objects in the ith interval and jth class; Cj represents the number of objects in the jth class; Ri represents the number of objects in the ith interval; N represents the total number of objects in the two tested intervals; Eij denotes the expected frequency of Aij and we can set the Eij to 0.1 if the Ni or Cj is zero.
3) Merging is conducted from bottom to top and is stopped when suspensive condition is met.
2.2 Knowledge reduction based on rough set theory
2.2.1 Basic concepts of rough set theory
Rough Set Theory, proposed by PAWLAK in 1982 [27, 46-47], is a new mathematical tool to deal with uncertainties. It deals with knowledge under conditions of retaining critical information and requires minimum expression of knowledge.
Definition 1 [48]: Information systems.
RST uses information systems to represent knowledge and deal with vague data. An information system (Si) including condition attributes and decision attributes is expressed as follows:

where U denotes a nonempty finite set (namely the universe) with n objects {u1, u2, …, un}, A is a nonempty finite set with m attributes, formed by the condition attribute C and the decision attribute D. It is also defined as {c1, c2, …, cm-1, d}=C D; V is called the domain of A; and f : U×A→V is an information function where
  for every
Definition 2 [48]: Indiscernibility relation.
The nonempty finite data set can be divided into elementary sets or subsets, such as U/D and U/C. Here, x and y are two objects and consider subsets of attributes  where A uniquely defines an equivalence relation:
 (6)
(6)
If  then (x, y) is indistinguishable from R.
Definition 3 [48]: Lower approximation and upper approximation.
Lower and upper approximation is the second fundamental concept of RST. Let  and
and  The R-lower approximation of
  and the R-upper approximation of
  are then defined respectively as follows:
 (7)
(7)
 (8)
(8)
Every object in the lower approximation set of X must be in X. If an objective is in the upper approximation set of X, then it might or might not be in X.
Definition 4 [48]: Significant value of attributes.
In a decision table, different attributes may have different importance. In order to find out some attributes’ importance, the method is to remove some of the attributes from the table and then consider how the classification changes without these attributes. If the attribute is removed and the corresponding classification changes greatly, It is indicated its high importance. The contrary effect indicates that the importance of this attribute is low.
According to the RST, define C and D as the condition attribute set and the decision attribute set separately, importance of attributes can be determined by the following equation:
 (9)
(9)
after removing the attribute ci (i=1, 2, …, m-1), the attribute importance should be:
 (10)
(10)
where card(・)is the cardinality of the set, posC(D)is the knowledge expressed by using category U/C in the whole universe U, and can be correctly categorized in the object set of the equivalence class of U/D. To classify the object by removing a certain attribute from set C, the effect on positive region of classification U/D can be represented as follows:
 (11)
(11)
So we can calculate the importance of every condition attribute in the decision table, the weights of each condition attribute can be expressed as follows:
 (12)
(12)
Definition 5 [48]: Approximation precision.
The approximation precision of the rough set representation of the set X can be given by the following:
 (13)
(13)
(Note: card(X)represents the number of elements in set X).
That is, the accuracy of the rough set representation of X, μR(X), 0≤μR(X)≤1, is the ratio of the number of objects which can positively be placed in X to the number of objects that can possibly be placed in X. This provides a measure of how closely the rough set is approximating the target set.
Definition 6 [48]: Attribute-reduction.
Attribute set  is a reduction of condition attribute set C, if posQ(D)=posC(D)and each attribute from Q is indispensable to decision attribute set D. Attribute-reduction is defined as RED(Q, D).
Definition 7 [48]: Decision rules.
The rule generation from decision table to classify new objects is one of the most significant functions of RST. Define a function to make dx(a)=a(x), where
 And dx(C)is the condition part of the decision rule, also called the antecedent. dx(D)is the decision part of the decision rule, also called the consequent.
Definition 8 [48]: Support.
If decision information system (Si) is 

 and x matches rule
 the support of corresponding rule of object x is:
 (14)
(14)
Rules-support reflects the proportion of the object in the universe which matches the rule in the decision table. It can be interpreted as a strength of decision rule  and reflects the randomness of decision table. When the support of a rule is small, we can consider it as a randomly generated rule whose ability to classify new objects is weak.
Definition 9 [48]: Coverage.
If decision information system is 
 and x matches rule the coverage of corresponding rule of object x is:
 (15)
(15)
Rule coverage reflects the comparison between the number of objects consistent with the rule and the number of objects consistent with the consequent in the decision table. It reflects the probability of objects consistent with both the rule antecedent and the rule consequent.
2.2.2 Application of discernibility matrix in solving information system reduction and core
Regarding the attribute reduction of decision tables, among known research results, a kind of method using discernible matrix to represent knowledge is put forwarded and this method has many advantages [49]. Especially it can explain and calculate the reduction and core of information systems easily.
Definition 10: Suppose that S=(U, A, V, f) is an information system, and |U|=n, the discernible matrix of S is a n×n matrix, and any element is 
 Thus, d(x, y) is the assembly of all attributes of discernibility objects x and y.
Definition 11: Regarding each attribute  assign a boolean variable a. If
 boolean function is
 and is expressed by
 If
If  boolean constant is 1 and then discernibility function can be defined as follows:
 (16)
(16)
If boolean expression is only expressed by constant and boolean variable through disjunction and conjunction calculations, it is a normal form. If boolean expression is constituted by the conjunction consisting of some disjunctive forms, it is a conjunctive normal form. If boolean expression is constituted by disjunction consisting of conjunction expressions, it is a disjunctive normal form. And if boolean expression is disjunctive normal form and includes the conjunction expression with minimum amount, it is a tiny disjunctive normal form.
Discernibility function f(A) has the following properties: all conjunction expressions in the tiny disjunctive normal form of discernibility function △ are all reductions of attribute set A.
The expression form of discernible matrix is n×n dimension matrix, where n represent the quantity of element sets and its elements are defined as the assembly of all attributes of discernible element sets [x]i and [x]j, and they are expressed as dij. Thus, to calculate the element dij, attribute sets of recognition element sets [x]i and [x]j should be required.
Obviously, dij=dji,  and discernible matrix is symmetrical. Therefore, discernible matrix can be expressed merely after calculating a lower triangular matrix. Discernible function of information system is calculated by utilizing operation rules about absorptivity and distribution ratio. When minimum disjunctive normal form of discernible function is reached, the reduction and core of information system can be obtained.
The specific steps for rough set attribute reduction can be summarized as follows:
Step 1: Set up an information system.
Step 2: Data discretization.
Step 3: Construct the discernibility matrix.
Step 4: Construct the discernibility function.
Step 5: Attribute reduction.
Figure 1 illustrates the flowchart of the attribute reduction.
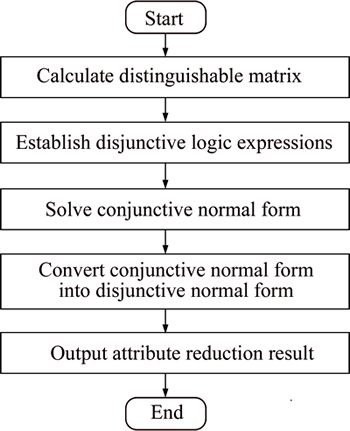
Fig. 1 Flowing chart for reducing attribute of incomplete information system
2.3 Basic concepts of petri nets
PN is a graphical modeling tool for the formal description of the flow of activities in complex systems. It is particularly suited to represent logical interactions among different activities or parts in a system. Typical situations that can be modeled by PN are concurrency, sequentiality, synchronization and conflict. Great advantage of PN for modeling complicated distributed systems consists then in the possibility of being easily created with the help of graphical tools and of rapid analysis of the corresponding system which enables us to optimize the parameters of a mathematical model. Unlike the classical methods creating mathematical models with the help of programming languages the PN enables us to form gradually a mathematical model via transitions and places[50]. PN consists of three main elements: places, transitions and arcs and they are defined as follows:
Definition 12: A place/transition net (P/T net) is a structure  where P=(p1, p2, …, pm) (m≥0)is a finite set of m places; T=(t1, t2, …, tn) (n≥0)is a finite set of n transitions with
  and
and  K=(k1, k2, …, km)is the finite set of initial token in the place; flow relation
 and
and  representing all directed arcs from place to transition and from transition to place. I and O represent the finite sets of transitional input place and output place. The graphical representation of PN is a digraph including two kinds of nodes: place node (generally expressed by circle) and transition node (generally expressed by block and vertical line). Arcs represent inference relations and dark spots on circles represent that this place has initial token [51].
When a transition is equal or greater than two input places, this transition is connective. Otherwise, it is non- connected.
For PN’s model with n transitions and m places, its matrix representation is defined as follows:
Definition 13: Input incidence matrix (IIM) is  and Bm×nis a binary matrix with m lines and n columns. Element
 in matrix D-represents that whether a directed arc exists between a place Piand a transition Tj. If so,is 1; otherwise,is 0.
Definition 14: Output incidence matrix (OIM) is and Bm×n is a binary matrix with m lines and n columns. Element
  in matrix D+represents that whether a directed arc exists between a transition Tj and a place Pi. If so, is 1; otherwise, is 0.
Definition 15: Conjunctive input incidence matrix (CIIM) is  and Bm×nis a binary matrix with m lines and n columns, and it shows that whether there are many joints between places and transitions in PN. If so,
  is equal to 1; otherwise, the value ofis 0.
Definition 16: Disjunctive input incidence matrix (DIIM) is  and Bm×n is a binary matrix with m lines and n columns, and it shows that if without multiple joints places connect transitions in PN, the value is set as 1; otherwise, it is set as 0.
Definition 17: Disjunctive adjacency matrix (DAM) is  . Ddw is the arithmetic product of matrix D+ with m lines and n columns and a matrix transposition with m lines and n columns. Its element
  represents that there is an access lying between place Pi to place Pj via transition.
Token in the place represents the initial flag state of the place. The original state of these places can be shown by column vector  . If there is token in place Pm, corresponding hm=1; otherwise, the value is 0.
Through the above definitions, a conclusion can be drawn that model of PN can use simple binary matrix to describe the relation among events.
In the inference of PN, relevant facts or information is required to obtain the initial token matrix H1. Let i denote the ith step of the forward reasoning process and Hi stands for the marking status for the ith step, where Iteratively, using Eq. (17), we can obtain Hi for i=1, 2, … till Hi+1=Hi for some i. In other words, the process stops as the PN is not live, i.e., no transition can be fired any more. The last changes of tokens in Hi are the conclusion achieved.
 (17)
(17)
In Eq. (17), the matrix operations are shown as follow:
1) For two given matrices, X=[xi]m×1 and Y=[yi]m×1, then
 (18)
(18)
where f(zi)=max(xi, yi), i=1, 2, …, m.
2) For two given matrices, and
and  let Z=X・Yand
  then
then

 (19)
(19)
where .
.
3) For two given matrices,and  let Z=X・Yand
  then
then
 (20)
(20)
where 
 1≤i≤m,
Figure 2 shows the inference flowchart of PN.
3 RPN model for eutrophication analysis and experimental results
3.1 RPN model and a sample example
The study framework of the RPN model is shown in Fig. 3. To carry out the work, a sample example of water eutrophication with 24 objects was collected from 24 typical reservoirs and lakes in China during 1987-1989. And each of the water eutrophication objects contains five condition attributes and one decision attribute with three categories. The condition attributes include the chlorophyll a(Chla), total phosphorus(TP), total nitrogen(TN), permanganate index (CODMn) and Transparency (SD). Table 1 shows attribute sets including condition attributes and decision attribute. The indices with 24 objects in the sample example used for water eutrophication analysis are listed in Table 2. The example is given to explain the use of three methods in the proposed RPN model. Three methods, namely ChiMerge, RST and PN, are applied to cope with the sample example. Because many classification algorithms, including RST, only accept discrete attributes, the Chimerge is used to convert continuous values into intervals. The RST is employed to generate rules and the PN is designed to analysis water eutrophication level. The sample data are divided into two sets: the training set and the testing set. The training set is used to establish the RPN model and the testing set is used to investigate the classification performance of a well- trained model.
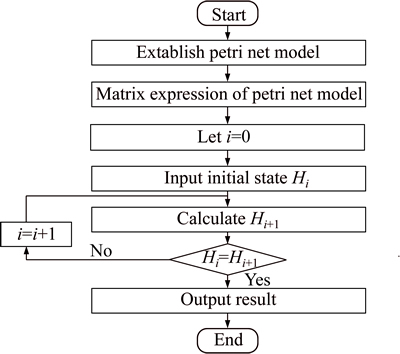
Fig. 2 Flowing chart of PN
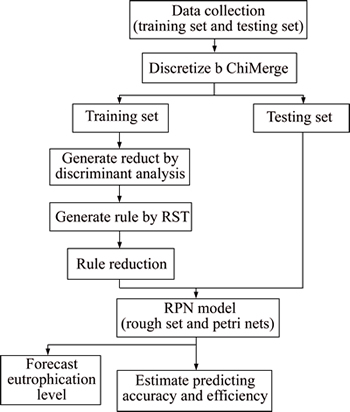
Fig. 3 Study framework of RPN model (RST and PN)
Table 1 Condition attributes and decision attributes used in this work

3.1.1 Continuous attribute discretization
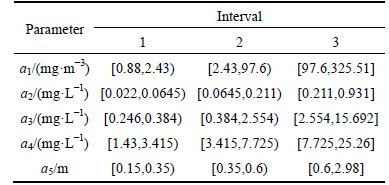
The information system constructed above should be discretized before it can be used for constructing the discernibility matrix. In this work, the ChiMerge approach is used to discretize the data. Three discretization intervals can be obtained, as shown in Table 3.
The data in the information system is discretized in accordance with the ChiMerge approach and the discretized system is listed in Table 4.
3.1.2 Parameters attribute reduction
Divide the domain of discourse according to the decision attributes in Table 4. The following equivalence classes can be obtained:


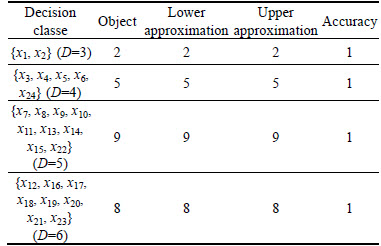
Lower approximation, upper approximation and accuracy of decision tables can be acquired according to Eqs. (7), (8) and (13), as shown in Table 5. Seen from Table 5, approximate quality of decision class is 1. In other words, in line with condition attribute set  elements in decision attribute set {D} can be described accurately. That is to say, Table 4 can be reduced.
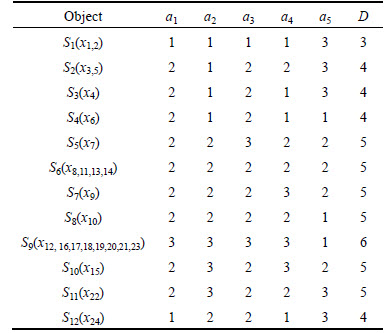
Due to existing redundancy and uncertainty of assessing information in eutrophication evaluation samples, it is necessary to conduct reduction towards samples. First of all, attribute values shall be reduced and repetitive cases should be removed in the table, as shown in Table 6. Then discernable matrix which can separate inhomogeneous objects in decision attribute D shall be built and the reduction and core of decision tables could be obtained. The discernable matrix built is shown in Table 7.
Table 2 A sample data and evaluation results of 24 reservoirs and lakes in China during 1987-1989
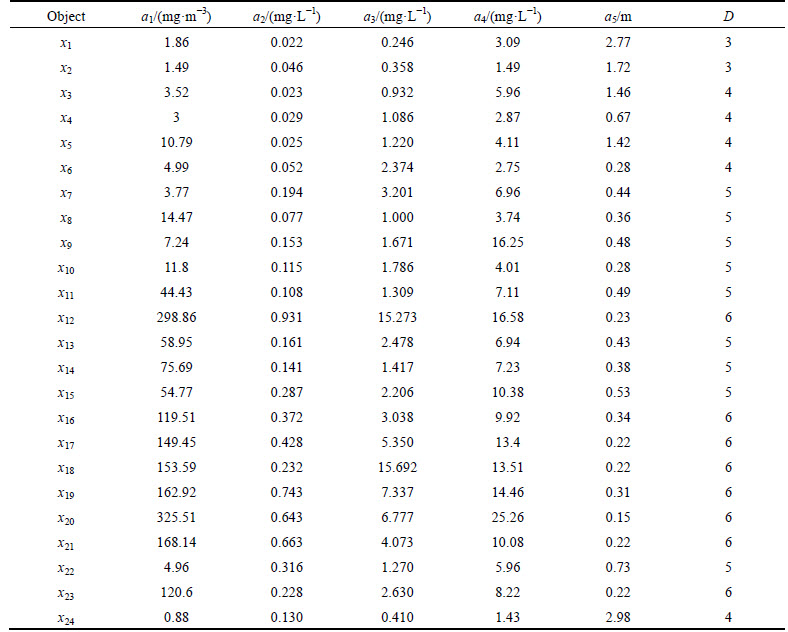
Table 3 Discretized attributes (p=0.1)
According to Table 7, the discernibility function △ is obtained as follows:
△=a1a2+a2a3a4+a2a3a5
Thus, three reductions
 and
and  of attribute set
 are obtained. The minimum reduction Redu={a1, a2} is chosen in this work. Table 8 is the data table after attribute reduction. The condition attribute in Table 8 reduces from primary 5 reductions to present 2 reductions, which greatly lowers the difficulty of data acquisition. Meanwhile, the assembly of different attribute reductions can be selected to avoid barely accessible data to reach the aim of rapid evaluation. Then reduce the attribute value, delete redundant data, calculate the core value of each remaining rule and get simplest form of each rule, as shown in Table 9.
3.1.3 Establishment of petri nets model
Through building PN’s model on basis of knowledge rule inference and setting the condition attribute as its initial place according to the reducted decision table in Table 9, it can be seen that a1 and a2 attributes in reduction rule are the most important condition attributes which decide the level of eutrophication. The initial status values have respectively three types. Setting four eutrophication states as final- state place, when the condition attribute has dereference in initial place, 1 token can be obtained and transitions which meet certain requirements can be triggered. If there is competitive relation among transitions, the transition with default minimum serial number gets token. When token flows to final-state place, the evaluation is completed. The evaluation on eutrophication is realized through the juxtaposition relationship among logics in PN. And also the model of PN can be obtained as shown in Fig. 4.
Table 4 Discretized information system
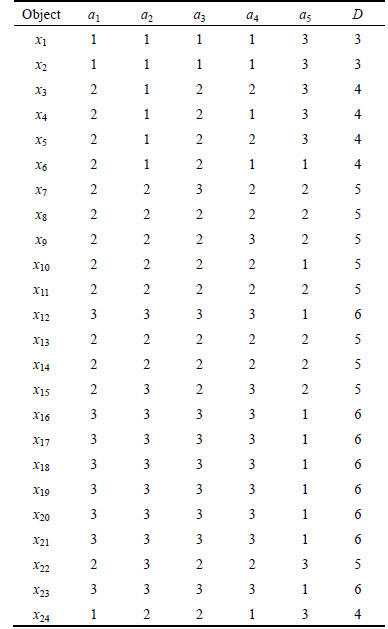
Table 5 Lower approximation, upper approximation and accuracy of decision table
Input mapping matrix of the model in the above figure obtained according to Fig. 4 and matrix manipulation with Eqs. (17)-(20) is shown as follows:
Table 6 Attribute value reduction

In the same way, the OIM (D+), CIIM  , DIIM
  , and DAM(Ddw) can be shown as follows:


Table 7 Discernible matrix

Table 8 Data table after attribute reduction
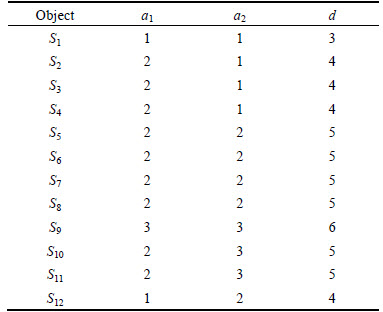
Table 9 Reduction data table
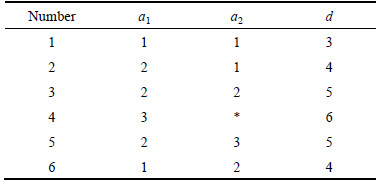
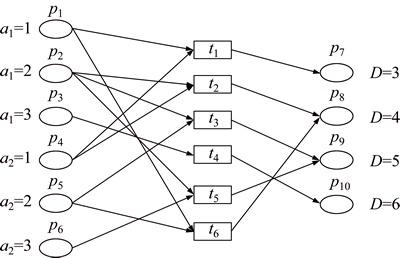
Fig. 4 PN model of eutrophication evaluation


For example, in the model in Fig. 4, when p2=1 and p5=1, initial token matrix obtained according to the model of PN is shown as follows:

According to Eq. (17), H1 is obtained as follows:


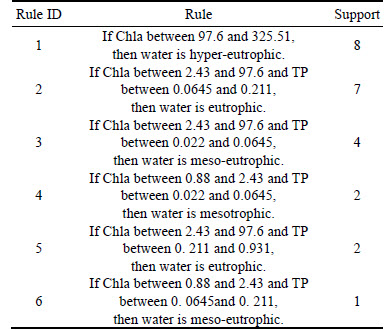
In the model in Fig. 4, when p2=1 and p5=1, place p9 is the one being pointed at. Thus, the estimation scale is Eutrophic and calculation result is in accordance with physical truth. According to Table 3 and Table 10, we can get ‘if…then…’ rule as follows:
If Chla is between 0.88 and 2.43 and TP is between 0.022 and 0.0645, then water is mesotrophic.
Similarly, all the rules can be obtained and shown in Table 10.
Table 10 Rules of sample example
3.2 Experimental results
In this work, 1392 monitoring data of water eutrophication including environmental factors, ecological factors and trophic factors were collected from 2004 to 2012 in Pengxi River. To serve different purposes, the data are divided into data sets: 1044 data were used to establish the rule reduction by RST and RPN model; the other 348 were used to estimate the classification performance of a well-trained model.
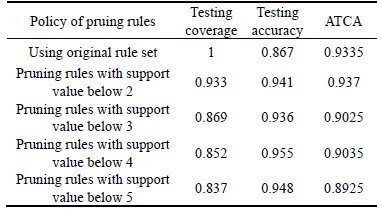
A 4-fold cross validation (CV) was performed in this work. The reduct was generated by discriminant analysis. Rules were generated by RST and the value of support was employed as an threshold to prune rules. After the pruning of rules, an RPN model was formulated. Then, the coverage and accuracy of the RPN model were derived. It was pointed that large quantities of rules make direct human interpretation more difficult, and therefore, inconvenient for water sector policy decision makers [52]. With rule pruning procedures, the number of rules becomes less, but the performance of both coverage and accuracy becomes a concern. Thus, the average value of testing coverage and accuracy (ATCA) is employed as a criterion for measuring the policy of pruning rules. For each cross validation, Table 11 indicates the best pruning rule policy, testing coverage, testing accuracy, and the ATCA. It also illustrates that by pruning rules with support less than two, the the 4th cross validation (CV4) can exhibit optimal ATCA results. For the CV4, Table 12 lists the results of the CV4 in the RPN model using different policies of pruning rules. Thus, the study used the pruning rules with support below two of CV4 to yield rules and perform reduction.
Table 11 4-fold cross validation results of RPN models
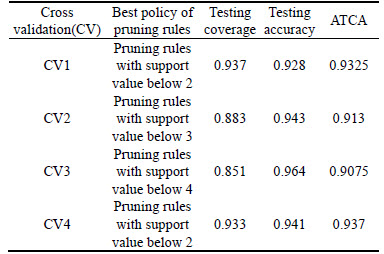
Table 12 Results of CV4 in RPN model using different policies of pruning rules
Five other eutrophication analysis methods, namely general regression neural network, probabilistic neural network, Elman neural network, projection pursuit model (PPM), and cloud model were applied to analyze the same data. For the GRNN model, a three-layer network model is employed in this work. We select Chla, TP, TN, CODMn and SD as input vector, and six levels of eutrophication as output vector. The smooth factor is 0.07. For the Elman model, the network consists of three layers, and the input, hidden and output layers have 5, 9 and 6 neurons, respectively. For the PNN model, the input and output layers have 5 and 6 neurons, respectively. The spread of radial basis function is 0.1. For the PPM, we set the maximum projection objective function value to 0.5165 and set the best projection directions to (0.4314, 0.4445, 0.4437, 0.4612, 0.4547). Table 13 shows the experimental results of six methods; and it can be concluded that the RPN model outperforms the other five methods in terms of average accuracy and rule generation. Finally, computation time of three methods is investigated. The computation time includes generating reduct and generating rule time. Figure 5 shows the relation between computation time and number of training data of the three methods in analyzing eutrophication. For the RPN model, it can be observed that the computation time for analyzing eutrophication increases only a little, while both the RST and the PN increase rapidly when the number of training data increases.
Table 13 Comparison of average accuracy for different models
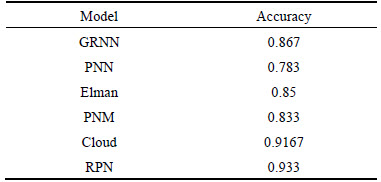
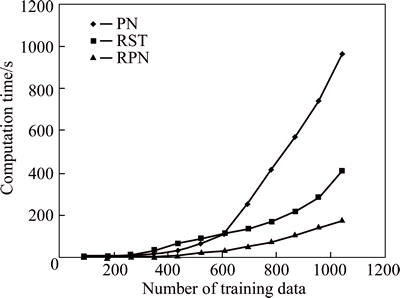
Fig. 5 Relation of number of training data and computation time in analying by three models
It can be concluded that rough set has limited ability in handling continuous data and can only conduct reduction according to fixed algorithm. In the process of rule reasoning and decision making by using rough set, if data amount is relatively big, time used in rule-matching by looking up tables will be substantially increased. While PN has the following main problems: to begin with, there is the complexity problem of model’s state time, manifesting as exponential growth along with the increase of actual system scale. In the next place, PN has only regular knowledge representation and inference capability which entirely depend on priori knowledge. It possesses no capacity of further simplification towards knowledge. Usually there is certain redundancy in priori knowledge, which results in the excessively huge scale of network. And factors that have effect on eutrophication are numerous and the work of feature acquisition is burdensome, which directly influences the inference efficiency. By integrating both benefits, RPN model is not only able to effectively compress the input space, shrink the solving scale, reduce the difficulty of knowledge acquisition, and decrease the redundancy of evaluation information, but also able to proceed intelligent inference to improve the inference efficiency and further verify the effectiveness of this kind of intelligent integration.
4 Conclusions
1) Eutrophication has been shown to be a serious water environment problem for many reasons. Therefore, effective eutrophication monitoring and management technology is essential. As a contribution to a larger goal, this work develops the RPN model to analysis eutrophication in the Pengxi River of Three Gorges Reservoir area. RST and PN are largely complementary in inference by utilizing rule knowledge. They can use attribute reduction of rough set and capacity of handling uncertain information to realize attribute optimization towards knowledge to gain minimum inference rule and build optimal model of PN. Then the structure of PN can be used to express the features of graphics, velocity of inference and search, and mathematicization of inference procedure to achieve efficient inference. The combination of RST and PN can simultaneously overcome the rule search of rough set and redundancy problem of PN and is of great benefit to give full play to respective advantages of RST and PN.
2) Empirical results show that the proposed model can provide more accurate, efficient, clear and informative results than the other methods, such as RST and PN. Therefore, the proposed RPN model can be understood as a promising alternative for the analysis of water eutrophicaion.
3) This investigation is the first to apply a rough set model with PN approach to analyze water eutrophication in the Pengxi River of Three Gorges Reservoir area. Although the proposed RPN model performs well, further experiments and improvements are required. For future work, appling the developed RPN model to other regions, such as Lake Tai, Dianchi and Chaohu Lake, in order to examine the feasibility and practicality of the RPN model will be a challenging issue for further study. Additionally, the RPN model can be applied to classification problems in other fields.
References
[1] YANG Xiao-e, WU Xiang, HAO Hu-lin, HE Zhen-li. Mechanisms and assessment of water eutrophication [J]. Journal of Zhejiang University-Science B: Biomedicine & Biotechnology, 2008, 9(3): 197-209.
[2] HUO Shou-liang, MA Chun-zi, XI Bei-dou, SU Jing, ZAN Feng-yu, JI Dan-feng, HE Zhuo-shi. Establishing eutrophication assessment standards for four lake regions, China [J]. Journal of Environmental Sciences, 2013, 25(10): 2014-2022.
[3] DU Li-na, LI Yuan, CHEN Xiao-yong, YANG Jun-xing. Effect of eutrophication on molluscan community composition in the Lake Dianchi (China, Yunnan) [J]. Limnologica-Ecology and Management of Inland Waters, 2011, 41(3): 213-219.
[4] LIU Yong-mei, CHEN Wei, LI Dun-hai, HUANG Ze-bo, SHEN Yin-wu, LIU Yong-ding. Cyanobacteria-/cyanotoxin-contaminations and eutrophication status before Wuxi Drinking Water Crisis in Lake Taihu, China [J]. Journal of Environmental Sciences, 2011, 23(4): 575-581.
[5] CARLSON R E. A trophic state index for lakes [J]. Limnology and Oceanography, 1977, 22(2): 361-369.
[6] AIZAKI M. Application of modified Carlson's trophic state index to Japanese lakes and its relationships to other parameters related to trophic state [J]. Res Rep Natl Inst Environ Stud Jpn, 1981, 23: 13-31. (in Janpanese)
[7] VOLLENWEIDER R A, GIOVANARDI F, MONTANARI G, RINALDI A. Characterization of the trophic conditions of marine coastal waters with special reference to the NW Adriatic Sea: proposal for a trophic scale, turbidity and generalized water quality index [J]. Environmetrics, 1998, 9(3): 329-357.
[8] XU Mei-jin, YU Lin, ZHAO Yun-wen, LI Meng. The simulation of shallow reservoir eutrophication based on MIKE21: A case study of douhe reservoir in north China [J]. Procedia Environmental Sciences, 2012, 13(10): 1975-1988.
[9] LIU Su-guang, LOU Sha, KUANG Cui-ping, HUANG Wen-rui, CHEN Wu-jun, ZHANG Jian-le, ZHONG Gui-hui. Water quality assessment by pollution-index method in the coastal waters of Hebei Province in western Bohai Sea, China [J]. Marine Pollution Bulletin, 2011, 62(10): 2220-2229.
[10] FERTIG B, KENNISH M J, SAKOWICZ G P, REYNOLDS L K. Mind the data gap: Identifying and assessing drivers of changing eutrophication condition [J]. Estuaries & Coasts, 2014, 37(S1): 198-221.
[11] WU Juan, TANG De-shan. Correlation model-based principal component analysis on the application on water body eutrophication evaluation [C]// 2009 3RD International Conference on Bioinformatics and Biomedical Engineering. Piscataway: IEEE, 2009: 5776-5779.
[12] PRIMPAS I, TSIRTSIS G, KARYDIS M, KOKKORIS G D. Principal component analysis: Development of a multivariate index for assessing eutrophication according to the European water framework directive [J]. Ecological Indicators, 2010, 10(2): 178-183.
[13] AN Qiang, LIN Lu, LIU Yuan-yuan, HUANG Ning-qiu, ZHAO Bin. Principal component analysis of eutrophication in the yangtze river estuary [C]// Sustainable Cities Development & Environment. Switzerland: Trans Tech Publications Ltd, 2012: 209-211.
[14] KARUL C, SOYUPAK S, CILESIZ A F, AKBAY N, GERMEN E. Case studies on the use of neural networks in eutrophication modeling [J]. Ecological Modelling, 2000, 134(2): 145-152.
[15] JIANG Ya-ping, XU Zu-xin, YIN Hai-long. Study on improved BP artificial neural networks in eutrophication assessment of China eastern lakes [J]. Journal of Hydrodynamics, 2006, 18(3): 528-532.
[16] KUO J T, HSIEH M H, LUNG W S, SHE N. Using artificial neural network for reservoir eutrophication prediction [J]. Ecological Modelling, 2007, 200: 171-177.
[17] MELESSE A M, KRISHNASWAMY J, ZHANG K Q. Modeling coastal eutrophication at florida bay using neural networks [J]. Journal of Coastal Research B, 2008, 24(2): 190-196.
[18] BAO Yan-fei, CUI Dong-wen. Application of MATLAB neural network in lake and reservoir eutrophication evaluation [J]. Journal of North China Institute of Water Conservancy & Hydroelectric Power, 2011, 32(6): 155-160. (in Chinese)
[19] PAN Jun, LIU Yang, LI Chang-hong, WANG Juan. Eutrophication assessment of reservoir based on matter-element and extension [C]// Advances in Environmental Engineering. Switzerland: Trans Tech Publications Ltd, 2012: 229-232.
[20] WU Fei-fei, WANG Xu. Eutrophication evaluation based on set pair analysis of baiyangdian lake, north China [C]// 18th Biennial Isem Conference on Ecological Modelling for Global Change and Coupled Human and Natural System. Netherlands: Elsevier, 2012: 1030-1036.
[21] WANG Ren-fang, GAO Wen-min, LI Fan-xiu. Set pair analysis model based on grey relational degree for lake eutrophication evaluation [C]// Advances in Environmental Technologies. Switzerland: Trans Tech Publications Ltd, 2013: 726-731.
[22] ARHONDITSIS G, ELEFTHERIADOU M, KARYDIS M, TSIRTSIS G. Eutrophication risk assessment in coastal embayments using simple statistical models [J]. Marine Pollution Bulletin, 2003, 46(9): 1174-1178.
[23] LIU Yong, WANG Yi-lin, SHENG Hu, DONG Fei-fei, ZOU Rui, ZHAO Lei, GUO Huai-cheng, ZHU Xiang, HE Bin. Quantitative evaluation of lake eutrophication responses under alternative water diversion scenarios: A water quality modeling based statistical analysis approach [J]. Science of the Total Environment, 2014, 468-469: 219-227.
[24] ZHU Shi-ping, LIU Zai-wen, WANG Xiao-yi, XU Ji-ping, LIAN Xiao-feng, DAI Jun. Application of gray correlation analysis in eutrophication evaluative of water bloom [C]// 2010 8th World Congress on Intelligent Control and Automation(WCICA). Piscataway: IEEE, 2010: 1496-1501.
[25] WANG Qi, LI Guang-ming, XU Jing-cheng. Comprehensive assessment of water quality eutrophication in scenic water bodies by the combination of fuzzy cluster and grey cluster [C]// 2008 International Symposium on Intelligent Information Technology Application. Piscataway: IEEE, 2008: 526-530.
[26] BRICKER S B, FERREIRA J G, SIMAS T. An integrated methodology for assessment of estuarine trophic status [J]. Ecological Modelling, 2003, 169(3): 39-60.
[27] PAWLAK Z, SKOWRON A. Rough sets [J]. International Journal of Computer & Information Sciences, 1982, 11(5): 341-356.
[28] WANG Guo-yin, MA Xi-ao, YU Hong. Monotonic uncertainty measures for attribute reduction in probabilistic rough set model [J]. International Journal of Approximate Reasoning, 2015, 59: 41-67.
[29] LI Pei-yue, WU Jian-hua, QIAN Hui. Groundwater quality assessment based on rough sets attribute reduction and TOPSIS method in a semi-arid area, China [J]. Environmental Monitoring & Assessment, 2012, 184(8): 4841-4854.
[30] AN Yan, ZOU Zhi-hong, LI Ran-ran. Water quality assessment in the Harbin reach of the songhuajiang river (China) based on a fuzzy rough set and an attribute recognition theoretical model [J]. International Journal of Environmental Research and Public Health, 2014, 11(4): 3507-3520.
[31] PAI Ping-feng, LEE F C. A rough set based model in water quality analysis [J]. Water Resources Management, 2010, 24(11): 2405-2418.
[32] LIU Yong, WANG Zhen, GUO Huai-cheng, YU Shu-xia, SHENG Hu. Modelling the effect of weather conditions on cyanobacterial bloom outbreaks in lake dianchi: A rough decision-adjusted logistic regression model [J]. Environmental Modeling & Assessment, 2013, 18(2): 199-207.
[33] PAI Ping-feng, LI Lan-lin, HUNG Wei-zhan, LIN Kuo-ping. Using ADABOOST and rough set theory for predicting debris flow disaster [J]. Water Resources Management, 2014, 28(4): 1143-1155.
[34] PAI Ping-feng, CHEN Tai-chi. Rough set theory with discriminant analysis in analyzing electricity loads [J]. Expert Systems with Applications, 2009, 36(5): 8799-8806.
[35] PAI Ping-feng, LYU Yi-jia, WANG Yu-min. Analyzing academic achievement of junior high school students by an improved rough set model [J]. Computers & Education, 2010, 54(4): 889-900.
[36] MURALIDHARAN V, SUGUMARAN V. Rough set based rule learning and fuzzy classification of wavelet features for fault diagnosis of monoblock centrifugal pump [J]. Measurement, 2013, 46(9): 3057-3063.
[37] SUN Qiu-ye, WANG Chun-ling, WANG Zhi-liang, LIU Xin-rui. A fault diagnosis method of Smart Grid based on rough sets combined with genetic algorithm and tabu search [J]. Neural Computing & Applications, 2013, 23(7/8): 2023-2029.
[38] PHOPHALIA A, MITRA S K, RAJWADE A K. Medical image denoising from similar patches derived by Rough Set [C]// 2013 IEEE Second International Conference on Image Information Processing(ICIIP). Piscataway: IEEE, 2013: 586-591.
[39] PHOPHALIA A, RAJWADE A, MITRA S K. Rough set based image denoising for brain MR images [J]. Signal Processing, 2014, 103(10): 24-35.
[40] YEH C C, LIN F Y, HSU C Y. A hybrid KMV model, random forests and rough set theory approach for credit rating [J]. Knowledge-Based Systems, 2012, 33(3): 166-172.
[41] CHEN Y S, CHENG C H. Hybrid models based on rough set classifiers for setting credit rating decision rules in the global banking industry [J]. Knowledge-Based Systems, 2013, 39(2): 224-239.
[42] MIAO Duo-qian, DUAN Qi-guo, ZHANG Hong-yu, JIAO Na. Rough set based hybrid algorithm for text classification [J]. Expert Systems with Applications, 2009, 36(5): 9168-9174.
[43] SHI Lei, MA Xin-ming, XI Lei, DUAN Qi-guo, ZHAO Jing-ying. Rough set and ensemble learning based semi-supervised algorithm for text classification [J]. Expert Systems with Applications, 2011, 38(5): 6300-6306.
[44] CHEN Li, ZHANG Ying, SONG Zi-lin, MIAO Zhuang. Automatic web services classification based on rough set theory [J]. Journal of Central South University: Science and Technology, 2013, 44(10): 2708-2714. (in Chinese)
[45] KERBER R. ChiMerge: Discretization of numeric attributes [C]// AAAI-92 Proceedings: Tenth National Conference on Artificial Intelligence. USA: Amer Assoc Artificial Intelligence, 1992: 123-128.
[46] PAWLAK Z. Imprecise categories, approximations and rough sets [M]. Berlin: Springer Netherlands, 1991.
[47] PAWLAK Z. Rough sets and intelligent data analysis [J]. Information Sciences, 2002, 147(1/2/3/4): 1-12.
[48] WANG Guo-yin, WU Yu, FISHER P S. Rule generation based on rough set theory [C]// Data Mining and Knowledge Discovery: Theory, Tools, and Technology II. USA: Spie-Int Soc Optical Engineering, 2000: 181-189.
[49] PAWLAK Z, SKOWRON A. Rudiments of rough sets [J]. Information Sciences, 2007, 177(1): 3-27.
[50] BARILLA J, LOKAJICEK M, PISAKOVA H, SIMR P. Applying Petri nets to modeling the chemical stage of radiobiological mechanism [J]. Journal of Physics and Chemistry of Solids, 2015, 78: 127-136.
[51] GEORGILAKIS P S, KATSIGIANNIS J A, VALAVANIS K P, SOUFLARIS A T. A systematic stochastic Petri net based methodology for transformer fault diagnosis and repair actions [J]. Journal of Intelligent and Robotic Systems, 2006, 45(2): 181-201.
[52] WITLOX F, TINDEMANS H. The application of rough sets analysis in activity-based modeling [J]. Expert Systems with Applications, 2004, 27(4): 585-592.
(Edited by FANG Jing-hua)
Foundation item: Project(2014ZX07104-006) supported by the National Scientific and Technological Major Project of China
Received date: 2015-07-09; Accepted date: 2015-12-16
Corresponding author: WANG Guo-yin, Researcher, PhD; Tel: +86-23-65935694; E-mail: wangguoyin@cigit.ac.cn

