Trans. Nonferrous Met. Soc. China 25(2015) 3475-3483
Influence of magnesium and aluminum salts on hydrolysis of titanyl sulfate solution
Fu-qiang FANG1,2,3, Ya-hui LIU2,3, Fan-cheng MENG1,2,3, Wei-jing WANG2,3, Tian-yan XUE2,3, Tao QI2,3
1. University of Chinese Academy of Sciences, Beijing 100049, China;
2. National Engineering Laboratory for Hydrometallurgical Cleaner Production Technology, Institute of Process Engineering, Chinese Academy of Sciences, Beijing 100190, China;
3. Key Laboratory of Green Process and Engineering, Institute of Process Engineering, Chinese Academy of Sciences, Beijing 100190, China
Received 17 November 2014; accepted 30 January 2015
Abstract: The influence of magnesium and aluminum salts as impurities on the hydrolysis of titanyl sulfate was investigated. The degree of TiOSO4 conversion to hydrated titanium dioxide (HTD) and the particle size of HTD were measured as functions of the concentrations of MgSO4 and Al2(SO4)3 in the TiOSO4 solution. The Boltzmann growth model, which focuses on two main parameters, namely the concentrations of Mg2+ and Al3+ (ρ(Mg2+) and ρ(Al3+), respectively), fits the data from the hydrolysis process well with R2>0.988. The samples were characterized by ICP, SEM, XRD, and laser particle size analyzer. It is found that the addition of MgSO4 simultaneously improves the hydrolysis ratio and the hydrolysis rate, especially when F (the mass ratio of H2SO4 to TiO2) is high, hydrolysis ratio increases from 42.8% to 83.0%, whereas the addition of Al2(SO4)3 has negligible effect on the chemical kinetics of HTD precipitation during the hydrolysis process, hydrolysis ratio increases from 42.8% to 51.9%. An investigation on the particle size of HTD reveals that the addition of MgSO4 and Al2(SO4)3 clearly increases the size of the crystallites and decreases the size of the aggregates.
Key words: titanyl sulfate solution; hydrolysis process; growth model; magnesium sulfate; aluminum sulfate; particle size
1 Introduction
Titanium dioxide (TiO2) has a variety of applications in pigments, plastics, rubber, paper, and photocatalysis, as well as in the ceramics, cosmetics, and textile industries [1-5]. The primary routes for TiO2 production include the sulfate process and the chloride process [6-8]. In China, the sulfate process is the main method for producing TiO2, as the ilmenite and Ti slag are easy to be obtained from titanomagnetite mineral, which accounts for more than 90% of the titanium reserve in China.
Hydrolysis of titanyl sulfate (TiOSO4) is an essential step in the sulfate process, since the quality of the final TiO2 pigment is directly affected by the properties of the hydrated titanium dioxide (HTD). While the hydrolysis of TiOSO4 has been widely studied, little is known about the particle formation mechanism. Although TiO2 precipitation is presumed to involve many mechanisms, it is generally agreed that the hydrolysis process involves three steps: nucleation, growth, and agglomeration [9]. Particles with three-dimensional scales have been found to precipitate during the hydrolysis process. The smallest particles (6.0-8.0 nm) are called crystallites and are generated during the nucleation process. These crystallites form primary agglomerates (60-100 nm), and subsequently, the primary agglomerates form aggregates (0.5-2.0 μm) [9,10].
Many studies have examined the factors that affect the hydrolysis process, such as TiOSO4 concentration, free H2SO4 concentration, nuclei, stirrer speed, heating rate, and the impurities [10-17]. The impurities in the TiOSO4 solution vary with the type of raw materials used. For example, the Fe ion was found to be the primary admixture in TiOSO4 solutions obtained from ilmenite. Further, it was found that Fe(II) (up to 5%) has a positive effect on the hydrolysis rate, whereas the reverse phenomenon was observed in the case of Fe(III) (up to 1.5%) [14]. In contrast, Mg and Al salts were the predominant impurities in the Ti slag obtained in China. For instance, the slag found in Panzhihua, Sichuan Province of China, has a significant amount of titanium; the typical chemical composition of this Ti-rich slag is TiO2 (42.0%-44.0%), MgO (15.0%-16.0%), Al2O3 (18.0%-19.0%), and SiO2 (18.0%-19.0%). TiOSO4 obtained from this Ti-rich slag also contains a large amount of impurities, with the typical concentrations of Mg2+ and Al3+ impurities being 25.1 g/L and 17.6 g/L, respectively [18]. Therefore, it is necessary to take Mg2+ and Al3+ impurities into account in the design of the TiOSO4 hydrolysis process. However, little is known about the influence of Mg and Al salts on the hydrolysis process.
The aim of this work was to study the hydrolysis kinetics and HTD synthesis by the hydrolysis of TiOSO4 solution containing MgSO4 and Al2(SO4)3. The hydrolysis ratio and particle size of the HTD were investigated by varying the initial concentration of MgSO4 and Al2(SO4)3 in the solutions. In addition, the Boltzmann growth model was used to fit the hydrolysis ratio curves to better understand the influence of the concentrations of Mg2+ and Al3+ on the hydrolysis process.
2 Experimental
An optimal 5300DV inductively coupled plasma optical emission spectrometer (ICP-OES, Perkin-Elmer, USA) was used to determine the chemical composition, such as Mg2+, Al3+ and Ti4+. The solid-phase analysis was done by X-ray power diffraction (XRD, X’Pert PRO MPD, PAnalytical, Netherlands) using Cu Kα radiation at 40 kV and 30 mA. The aggregates size of HTD was detected by laser particle size analyzer (Malvern, Mastersizer 2000, England). A field emission gun SEM (JSM-6700F, Electron Company, Japan) was used to observe the changes in the particle size of the aggregates and other morphological features.
All chemicals were of analytical-grade purity, and deionized water was used in all of the experiment.
The hydrolysis experiment was conducted without seed because of the instability of the hydrolysis seed. Hydrolysis was performed in a 500 cm3 three-necked round-bottomed split reactor at atmospheric pressure, with an agitator (rotation speed 300 r/min) and reflux condenser. The titanium sulfate solution was heated to boiling state (101-104 °C), and hydrolysis time was counted from then on. The samples, each of which was approximately 7 cm3, were extracted at every 12 or 30 min, and filtered to obtain the filter cake and the filtrate. The filter cake was used for particle size distribution (PSD), and the vacuum dried filter cake was used for scanning electron microscopy (SEM). Ti concentration (ρt) in the filtrate was examined by titration, and the hydrolysis ratio (x) was calculated by
 (1)
(1)
During the titration, Ti4+ was reduced to Ti3+ with aluminum sheet and titrated with 0.1027 mol/L ammonium iron (III) sulfate, using acid ammonium thiocyanate as an indicator. The concentration of sulfuric acid was titrated with 0.2833 mol/L NaOH solution, using methyl orange as an indicator.
The crystallite size (d) of HTD was calculated by applying the following Debye-Scherrer formula on the anatase (101) diffraction peaks:
 (2)
(2)
where K is a constant (given here with a value of 0.89), λ is the wavelength of the X-ray radiation (0.15406 nm), β is the full width at half maximum of the intensity peak, and θ is the diffraction angle.
The measurement was operated under step-scan mode at increments of 0.02° (2θ) and scanning speed of 0.03 (°)/s. The width of the peak at half maximum was calculated taking into account the instrumental broadening. This parameter was determined on the basis of the sample of coarse crystalline silicon.
3 Results and discussion
3.1 Growth models
Mathematical models are often used to elucidate the hydrolysis process in order to better understand it. The Avrami nucleation-growth equation (x(t)=1-exp(-ktn)) has been typically used to describe the S-shaped kinetic curve [19]. However, the parameters of the equation are inappropriate for describing the TiOSO4 hydrolysis process. Recently, the Boltzmann equation has been used to fit the hydrolysis process, and it was found that the hydrolysis ratio curves satisfy the equation very well [20,21]. In this study, we have adopted the Boltzmann equation for fitting the hydrolysis ratio curves.
The Boltzmann function is given by
 (3)
(3)
where A1 and A2 represent the initial and final hydrolysis ratios, respectively; t0 is the time when x=(A1+A2)/2; and dt is a parameter that describes the width of the curve along the time axis. As the value of A1 could be negative, we define t1/2 as the time when x=(0+A2)/2. All parameters are calculated using the data for x and t.
3.2 Influence of concentrations of MgSO4 and Al2(SO4)3 on hydrolysis process
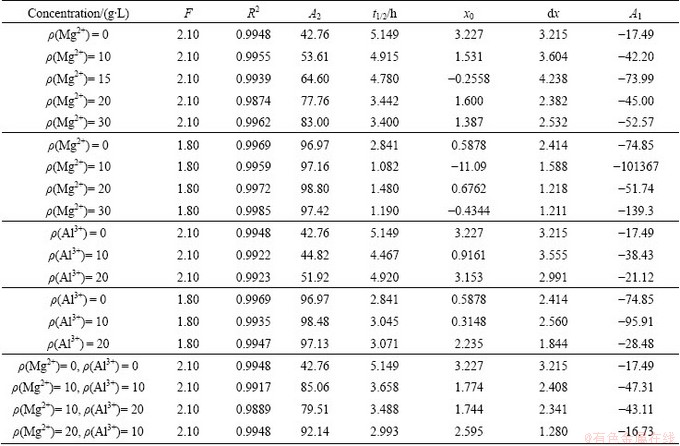
Figures 1 and 2 show the hydrolysis ratio curves at different concentrations of Mg2+ and Al3+, respectively (ρ(Mg2+) and ρ(Al3+) were used instead of ρ(MgSO4) and ρ(Al2(SO4)3) for easy calculation in this work). The Boltzmann growth model (Eq. (3)) was used to fit the hydrolysis ratio curves. The results of the parameters of Eq. (3) obtained are summarized in Table 1. Figure 1 shows that the hydrolysis ratio increases with the increase of Mg2+ concentration. This is particularly evident for F of 2.10 (where F is the mass ratio of H2SO4 to TiO2, F = 2.10 corresponds to ρ(H2SO4)=378 g/L), where the final hydrolysis ratio increases from 42.8% (for ρ(Mg2+)=0 g/L) to 83.0% (for ρ(Mg2+)=30 g/L). Similarly, the decrease of t1/2 from 5.149 to 3.400 h listed in Table 1 also indicates that the addition of Mg2+ can improve the hydrolysis rate. Meanwhile, for the F value of 1.80 (corresponding to ρ(H2SO4)=324 g/L), t1/2 reduces from 2.841 to 1.190 h, illustrating that the addition of Mg2+ can greatly accelerate the hydrolysis velocity. In addition, the final hydrolysis ratio increases slightly. The hydrolysis ratio curves for different F values also demonstrate that the lower the concentration of H2SO4 is, the higher the hydrolysis rate and ratio are. The results presented in this study are consistent with previously published results [13].
Figure 2 shows the simulations of the hydrolysis ratio curves at different ρ(Al3+) values, with the same ρ(TiO2) and different F values. In Fig. 2, the concentrations of Al3+ are 10 and 20 g/L. Al2(SO4)3 crystallizes when ρ(Al3+) is increased to 30 g/L. The hydrolysis ratio curves in Fig. 2(a) show that for F value of 2.10, the final hydrolysis ratio is improved only slightly from 42.8% to 51.9%, which indicates that the addition of Al3+ has a weaker influence on the hydrolysis process compared with Mg2+. Meanwhile, the hydrolysis ratio curves in Fig. 2(b) almost overlap, indicating that the addition of Al3+ has little effect on the hydrolysis process, when the value of F is 1.80.

Fig. 1 Simulation of hydrolysis ratio curves with constant TiO2 concentration (ρ(TiO2)=180 g/L) at different Mg2+ concentrations and F values

Fig. 2 Simulation of hydrolysis ratio curves with constant TiO2 concentration of (ρ(TiO2)=180 g/L) at different Al3+ concentrations and F values
Table 1 Various parameters in Boltzmann model with ρ(TiO2)=180 g/L at different Mg2+, Al3+, and H2SO4 concentrations in TiOSO4 solution
The influence of Mg and Al salts on the hydrolysis process as described above may be explained by two main factors. Firstly, the addition of MgSO4 and Al2(SO4)3 would lead to an increase in the concentration of SO42- in the TiOSO4 solution. SO42- forms HSO4- with free H+, resulting in a decrease in the free H+ concentration. This process can be explained by chemical equilibrium, which is described in Eq. (4). Many researcher agreed that the first step of hydrolysis was a dehydrogenation process to form complex ion, the complex ion combined each other with olation bridge to form dipolymer, H+ in olation bridge removed to form more stable oxolation bridge, and then the nucleation occurred [9,22]. Since both oxolation and olation are dehydrogenation processes, the decrease in the free H+ concentration will accelerate the hydrolysis and increase the final hydrolysis ratio [12,13,23].


 (4)
(4)
Secondly, the additional Al3+ may hydrolysis with H2O to produce free H+, as shown in Eq. (5), which results in an increase in the concentration of free H+.

 (5)
(5)
Meanwhile, the effect of hydrolysis of Mg2+ with H2O producing free H+ is so weak that the free H+ generated can be ignored. Therefore, the addition of MgSO4 has a great effect on the hydrolysis process than the addition of Al2(SO4)3 from the viewpoint of chemical kinetics. In addition, the former effect (SO42- combining with H+) is great when the concentration of H2SO4 is high (F=2.10), thus the hydrolysis ratio increases with the addition of both MgSO4 and Al2(SO4)3. In contrast, when the concentration of H2SO4 is low (F=1.80), the latter effect counteracts the former effect, resulting in a weak acceleration of the hydrolysis process. As mentioned above, Fe2+ (up to 5%) has a positive effect on the hydrolysis rate, whereas Fe3+ (up to 1.5%) slows down the hydrolysis rate. This phenomenon may also be explained by the above speculation, i.e., Fe3+ could hydrolyze with H2O more easily than Fe2+.
3.3 Influence of concentrations of MgSO4 and Al2(SO4)3 on size of aggregates and crystallites
SEM images of the aggregated anatase particles are presented in Figs. 3 and 4. It is clear from the images that the Mg2+ and Al3+ concentrations exert a significant influence over the final aggregate size. At ρ(Mg2+) or ρ(Al3+)=0 g/L, the aggregates appear to be larger than that observed at higher Mg2+ and Al3+ concentrations.
Figures 5 and 6 show the change in the mean particle size of the aggregates with time, for various concentrations of Mg2+ and Al3+, respectively. The data were obtained from the volume distribution data measured using a Malvern Mastersizer 2000 size analyzer. The mean size increases as a function of the duration of the hydrolysis process and the final size reaches at a hydrolysis duration of approximately 10 h. The plots also indicate that the growth rate of the particles slows down after 4 h of precipitation. It is evident from Fig. 5 that the size of the aggregates is affected by the Mg2+ concentration, i.e., the higher the Mg2+ concentration, the smaller the aggregate size. This effect is more noticeable at F=1.80 (from 5.61 to 3.37 μm and 1.27 μm corresponding to ρ(Mg2+) = 0, 10, and 30 g/L) compared with F=2.10 (from 5.70 to 4.24 μm and 2.25 μm corresponding to ρ(Mg2+) =0, 10, and 30 g/L). Similarly, the aggregate size clearly depends on the concentration of Al3+, as shown in Fig. 6. Smaller aggregate size is achieved at higher Al3+ concentrations. Similar to the case of Mg2+, the size reduction is more intense at F=1.80 (from 5.61 μm to 3.35 μm and 0.84 μm corresponding to ρ(Al3+)=0, 10, and 20 g/L) compared with F=2.10 (from 5.70 μm to 4.55 μm and 1.44 μm corresponding to ρ(Al3+)=0, 10, and 20 g/L).

Fig. 3 SEM images of anatase particle aggregates recovered at different concentrations of Mg2+ with F=2.10

Fig. 4 SEM images of anatase particle aggregates recovered at different concentrations of Al3+ with F=2.10
The XRD measurements of the dried HTD were performed in the 2θ range of 5° to 45°, since the strongest peak for anatase is at approximately 25.4°. The XRD patterns of the samples with different concentrations of Mg2+ and Al3+ are shown in Figs. 7(a) and (b), respectively. The crystallite sizes of HTD were calculated using Eq. (2), and the results are summarized in Table 2. The results show that the crystallite sizes increase gradually from 6.5 to 11.0 nm, with the increase of Mg2+ and Al3+ concentrations.
The reduction in the aggregate sizes with increase in the Mg2+ and Al3+ concentrations could be explained by two factors. Firstly, when the crystallite size increases, the number of positive charges related to the amount of Ti decreases sharply, since the charges are located on the surface where growth occurs [9]. This leads to a more difficult birth of coalescence and aggregation, resulting in smaller HTD aggregate sizes. Secondly, the addition of Mg and Al salts enhances the viscosity of the TiOSO4 solution, which negatively affects the collision of the particles, resulting in smaller size aggregates. And the reason why crystallite size increases could be that, the addition of Mg and Al salts increases the ionic strength of the solution, which accelerates the nucleation of the nuclei, leading to larger crystallite size.
3.4 Influence of combination of Mg and Al salts on hydrolysis of TiOSO4
The combined influence of Mg2+ and Al3+ on the TiOSO4 hydrolysis process was investigated next by conducting a series of experiments where different amounts of MgSO4 and Al2(SO4)3 were added into the TiOSO4 solution. Figure 8 shows the influence of the combination of Mg2+ and Al3+ on the hydrolysis ratio and the aggregate size of HTD. The hydrolysis ratio curves show that the addition of MgSO4 improves both the hydrolysis rate and the final hydrolysis ratio at a given concentration of Al2(SO4)3. This is in agreement with the results obtained by adding MgSO4 alone. Moreover, the combination of salts improves the final hydrolysis ratio to 85.0% (ρ(Al3+)=10 g/L, ρ(Mg2+)=10 g/L) and 92.1% (ρ(Al3+)=10 g/L, ρ(Mg2+)=20 g/L), whereas the addition of Mg2+ alone improves the final hydrolysis ratio to 53.6% (ρ(Mg2+)=10 g/L) and 77.8% (ρ(Mg2+)=20 g/L), and the addition of Al3+ alone increases the final hydrolysis ratio to 44.8% (ρ(Al3+)=10 g/L). This implies that the combination of salts exerts a greater effect on the hydrolysis ratio than the sum of the effect of adding the two salts alone. This also indicates that the Al salt may enhance the acceleration effect of the Mg salt during the hydrolysis process when the two salts are added together.

Fig. 5 Curves of aggregate size with constant TiO2 concentration of 180 g/L at different Mg2+ concentrations and F values, using Malvern Mastersizer 2000

Fig. 6 Curves of aggregates size with constant TiO2 concentration of 180 g/L at different Al3+ concentrations and F values, using Malvern Mastersizer 2000

Fig. 7 XRD patterns of dried HTD at different concentrations of Mg2+ (a) and Al3+ (b) with F=2.10
Table 2 Characteristics of HTD with different concentrations of salts at F=2.10


Fig. 8 Simulation of hydrolysis ratio curves (a) and HTD particle size curves (b) at different Mg2+ and Al3+ concentrations with ρ(TiO2)=180 g/L and F=2.10
It is interesting that the final hydrolysis ratio of the sample with ρ(Al3+)=10 g/L and ρ(Mg2+)=10 g/L (85.1%) is higher than the sample with ρ(Al3+)=20 g/L and ρ(Mg2+)=10 g/L (79.5%). We consider that the hydrolysis effect between Al3+ and H2O to produce free H+ becomes stronger than the combined effect of SO42- and H+ when the SO42- concentration reaches a certain value, resulting in an increase in the free H+ concentration and restrain the hydrolysis process.
Similar to the previous result, the aggregate size of HTD is influenced by both Al and Mg salts. The aggregate size clearly decreases with increasing the concentration of the component.
4 Conclusions
1) The influence of MgSO4 and Al2(SO4)3 on the hydrolysis of TiOSO4 was studied. The results show that the addition of MgSO4 not only results in an increase in the hydrolysis ratio but also increases the hydrolysis rate, especially when F is high.
2) The addition of Al2(SO4)3 can slightly increase the final hydrolysis ratio at F=2.10, and has little effect on the hydrolysis ratio at F=1.80.
3) The effect of the simultaneous addition of both the salts (MgSO4 and Al2(SO4)3) on the hydrolysis ratio exceeds the sum of the effects of adding each salt separately.
4) With the increase of the initial concentration of Mg2+ or Al3+ in the solution, the mean size of the crystallites (ranging from 6 to 11 nm) increases, and smaller sizes of the aggregates are achieved. The results can help to achieve appropriate particle size of HTD by controlling the initial concentrations of Mg2+ and Al3+ in the TiOSO4 solution.
References
[1] JAROENWORALUCK A, SUNSANEEYAMETHA W, KOSACHAN N, STEVENS R. Characteristics of silica-coated TiO2 and its UV absorption for sunscreen cosmetic applications [J]. Surface and Interface Analysis, 2006, 38(4): 473-477.
[2] JESIONOWSKI T, KRYSZTAFKIEWICZ A, DEC A. Modified titanium white-characteristics and application [J]. Physiochem Prob Miner Process, 2001, 35: 195-205.
[3] KARCH J, BIRRINGER R, GLEITER H. Ceramics ductile at low temperature [J]. Nature, 1987,330: 556-558.
[4] KUANG D, BRILLET J, CHEN P, TAKATA M, UCHIDA S, MIURA H, SUMIOKA K, ZAKEERUDDIN S M, GRATZEL M. Application of highly ordered TiO2 nanotube arrays in flexible dye-sensitized solar cells [J]. ACS Nano, 2008, 2(6): 1113-1116.
[5] WORSLEY D, SEARLE J. Photoactivity test for TiO2 pigment photocatalysed polymer degradation [J]. Materials Science and Technology, 2002, 18(6): 681-684.
[6] FOULGER D L, NENCINI P, PIERI S. Preparation of anatase titanium dioxide, US Patent: 5630995 [P]. 1997.
[7] YANG F, HLAVACEK V. Effective extraction of titanium from rutile by a low-temperature chloride process [J]. AIChE Journal, 2000, 46(2): 355-360.
[8] SOHN H, ZHOU L. The chlorination kinetics of beneficiated ilmenite particles by CO+Cl2 mixtures [J]. Chemical Engineering Journal, 1999, 72(1): 37-42.
[9] SANTACESARIA E, TONELLO M, STORTI G, PACE R C, CARRA S. Kinetics of titanium dioxide precipitation by thermal hydrolysis [J]. Journal of Colloid and Interface Science, 1986, 111(1): 44-53.
[10] SATHYAMOORTHY S, MOGGRIDGE G D, HOUNSLOW M J. Particle formation during anatase precipitation of seeded titanyl sulfate solution [J]. Crystal Growth & Design, 2001, 1(2): 123-129.
[11] TIAN Cong-xue, DU Jian-qiao, CHEN Xin-hong, MA Wei-ping, LUO Zhi-qiang, CHENG Xiao-zhe, HU Hong-fei, LIU Dai-jun. Influence of hydrolysis in sulfate process on titania pigment producing [J]. Transactions of Nonferrous Metals Society of China, 2009, 19(S3): s829-s833.
[12] GRZMIL B U, GRELA D, KIC B. Effects of processing parameters on hydrolysis of TiOSO4 [J]. Polish Journal of Chemical Technology, 2009, 11(3): 15-21.
[13] GRZMIL B U, GRELA D, KIC B. Hydrolysis of titanium sulphate compounds [J]. Chemical Papers, 2008, 62(1): 18-25.
[14] GRZMIL B U, GRELA D, KIC B, PODSIADLY M. The influence of admixtures on the course of hydrolysis of titanyl sulfate [J]. Polish Journal of Chemical Technology, 2008, 10(3): 4-12.
[15] SATHYAMOORTHY S, HOUNSLOW M J, MOGGRIDGE G D. Influence of stirrer speed on the precipitation of anatase particles from titanyl sulphate solution [J]. Journal of Crystal Growth, 2001, 223(1): 225-234.
[16] JALAVA J P. Precipitation and properties of titania pigments in the sulfate process. 1. Preparation of the liquor and effects of iron (II) in isoviscous liquor [J]. Industrial & Engineering Chemistry Research, 1992, 31(2): 608-611.
[17] TIAN Cong-xue, HUANG Shuang-hua; YANG Ying. Effects of concentration of TiOSO4 and Fe/TiO2 ratio on TiO2 anatase white pigment production via short sulfate process [J]. Advanced Materials Research, 2013, 634-638: 391-396.
[18] WANG Bing. Study on preparation of titanium oxide from further reduced titanium slag [J]. Inorganic Chemicals Industry, 2013, 45(10): 36-38. (in Chinese)
[19] CHARBONNEAU C, GAUVIN R, DEMOPOULOS G. Nucleation and growth of self-assembled nanofibre-structured rutile (TiO2) particles via controlled forced hydrolysis of titanium tetrachloride solution [J]. Journal of Crystal Growth, 2009, 312(1): 86-94.
[20] WANG W J, CHEN D S, CHU J L, LI J, XUE T Y, WANG L N, WANG D, QI T. Influence and hydrolysis kinetics in titanyl sulfate solution from the sodium hydroxide molten salt method [J]. Journal of Crystal Growth, 2013, 381: 153-159.
[21] HAO L, WEI H Y. On-line investigation of anatase precipitation from titanyl sulphate solution [J]. Chemical Engineering Research and Design, 2010, 88(9): 1264-1271.
[22] PEI Run, SHEN Zong-qi, ZHANG Zai-hao, WU Yong-bao, WANG Guan-yuan, LI Rui-lan. Titanium white production by sulfuric acid method: Mechanism of TiOSO4 hydrolysis process [M]. Beijing: Chemical Industry Press, 1982: 105-107.
[23] HIXSON A W, PLECHNER W W. Hydrated titanium oxide: Thermal precipitation from titanium sulfate solutions [J]. Industrial & Engineering Chemistry, 1933, 25(3): 262-274.
镁盐和铝盐对硫酸钛溶液水解过程的影响
方富强1,2,3,刘亚辉2,3,孟凡成1,2,3,王伟菁2,3,薛天艳2,3,齐 涛2,3
1. 中国科学院大学,北京 100049;
2. 中国科学院 过程工程研究所 湿法冶金清洁生产技术国家工程实验室,北京 100190;
3. 中国科学院 过程工程研究所 绿色过程与工程院重点实验室,北京 100190
摘 要:研究硫酸钛溶液中作为杂质的硫酸镁和硫酸铝对TiOSO4水解过程的影响。考察水解过程中,钛的转化率和偏钛酸粒径随硫酸钛溶液中硫酸镁和硫酸铝浓度的变化情况。采用Boltzmann生长模型拟合水解率曲线,可得到较好的拟合结果且R2>0.988。使用ICP、SEM、XRD和激光粒度仪对样品进行表征。结果表明,硫酸镁能够同时提高水解速率和最终的水解率,当硫酸钛溶液的F值(硫酸与TiO2的质量浓度比)较高时,这种趋势尤为明显(水解率由42.8%提高至83.0%),而硫酸铝对水解率的影响不明显(水解率由42.8%提高至51.9%)。通过对偏钛酸粒径的考察发现,硫酸镁和硫酸铝均能够明显地增加微晶粒径及减小偏钛酸聚集体粒径。
关键词:硫酸钛溶液;水解过程;生长模型;硫酸镁;硫酸铝;颗粒粒径
(Edited by Xiang-qun LI)
Foundation item: Project (51090380) supported by the National Natural Science Foundation of China; Projects (2013CB632601, 2013CB632604) supported by the National Basic Research Program of China
Corresponding author: Tao QI; Tel: +86-10-62631710; E-mail: tqgreen@ipe.ac.cn
DOI: 10.1016/S1003-6326(15)63985-1

