Low dimensional chaos in elevator peak traffic
LI Jun-fang(李俊芳)1, 2, ZONG Qun(宗群)1, ZHANG Jing-long(张景龙)1, WANG Fang(王芳)1
(1. School of Electrical Engineering and Automation, Tianjin University, Tianjin 300072, China;
2. School of Electrical Engineering, Tianjin University of Technology, Tianjin 300384, China)
Abstract: Nonlinear time series techniques were applied to analyze up-peak and down-peak traffic flow data and energy consumption data in elevator system. Phase space was reconstructed using the delay embedding theorem, which described the behaviour evolution of a nonlinear system. Embedding parameters including delay time and embedding dimension were estimated using the mutual information of the data and the false nearest neighbour algorithm, respectively. Due to the attractor of the elevator traffic flow data and energy consumption data from reconstruction was not a necessarily sufficient indication of chaos, the correlation dimension and the largest Lyapunov exponent aiming at the above data were calculated. Based on these analysis and calculation, the results indicate that low dimensional chaotic characteristics obviously exist in the up-peak and down-peak traffic flow data and energy consumption data. The result helps to adjust the group control scheduling methods according to the chaotic behaviour of the peak flow and the building energy consuming to increase the performance index of the system.
Key words: elevator traffic flow; energy consumption; chaos; phase space reconstruction; largest lyapunov exponent
CLC number: TP391 Document code: A Article ID: 1672-7207(2011)S1-1101-06
Elevator traffic flows (ETFs) experience severe congestion during the peak period as a result of heavy traffic, complex user types and relatively slow-moving elevators. The ETF includes arriving traffic flow and riding traffic flow in the elevator system. Characteristic analysis of ETF is the key factor influencing the energy-loss of the elevator group control system (EGCS). Because of the passenger’s arrival is stochastic and the determination is uncertain, this problem becomes difficult for the EGCS[1-2]. Characteristic analysis of ETF affects the scheduling policy, start-stop time and running status of the elevator, and furthermore affects the building energy use. Therefore, the exact characteristic analysis of traffic flow can explain some complex phenomenon of the ETF and provide useful guidance for elevator dispatching unit to improve the dispatching efficiency and the decrease electricity energy.
Research was taken concentrated on the predication of the arriving traffic flow[3-4] and traffic mode classification[5-6] in the past years. These studies can help to adjust the dispatching policy, but they can not provide straight analysis from the traffic flow data. At the same time, it is still lack of analysis of the energy consumption data set corresponding to the traffic mode. Recently, useful mining information from the ETF and the energy use has become a real challenge and hot subject of research. Most researchers suppose that arriving traffic flow has the stochastic characteristic[7-8], and the arriving traffic flow should obey poisson distribution or homogeneous distribution[9]. This assumption is considered from stochastic methods and poisson process assumption becomes double in other field with the flow changes[10-11]. In fact, the systems of the elevator traffic are complex nonlinear systems in which the chaotic phenomenon of the elevator motion have been reported[12-13]. So, chaotic theory can be used to explain the complexity of the elevator traffic system. It is wondered if the chaotic features also exist in the ETF and the energy consuming of the elevator. In recent years, there is little research in this area. Some results of the relevant domain are referred, such as road traffic analysis[14-18] and network traffic analysis[19-21].
In this work, the traffic data samples were investigated from the up-peak and down-peak arriving traffic flow, up-peak and down-peak riding traffic flow and the up-peak and down-peak energy consumption. Taking the up-peak arriving traffic flow for example, the chaotic features of the ETF from qualitative analysis and quantitative analysis were observed. First, continuous wavelet transform of the ETF was performed, which can smooth out the high frequency noisy and can construct a time-frequency representation of a signal that offers very good time and frequency analysis. Second, from the view of qualitative analysis, phase space reconstruction was used to obtain the reconstructed attractor of the original data set. From the point of quantitative analysis, invariant measures of correlation dimension and largest lyapunov exponent were calculated. At last, all data samples were analyzed by the same means. It is demonstrated that up-peak and down-peak arriving traffic flow data, up-peak and down-peak riding traffic flow and the up-peak and down-peak energy consumption exhibit similar low dimensional chaotic behavior. It is suggestd that chaotic properties may be ubiquitous in the elevator traffic system.
1 Analysis of nonlinear time series of ETF
1.1 Continuous wavelet transformation
Wavelet analysis for the traffic flow data was conducted. Continuous wavelet transform possesses the ability to construct a time-frequency representation of a signal that offers very good time and frequency localization. In mathematics, the continuous wavelet transform of a continuous and square-integrable function x(t) at a scale of a>0 and translational value b is expressed by the following integral:
 (1)
(1)
where ψ(t) is a continuous function in both time domain and frequency domain. Here, the first derivative of the Gaussian function is used 
 , and namely
  .
.
According to the above method, the continuous wavelet transform is used to perform a space-scale analysis of the data sequences of the ETF. A reasonable filtering scale was chosen to smooth out the high frequency noisy fluctuations of the profile. The sequence of the elevator up-peak arriving traffic flow is shown in Fig.1, where S stands for the up-peak arriving passenger quantity and n stands of data-acquisition quantity. The denoised sequence is shown in Fig.2, where S′ stands for the up-peak arring passenger quantity after filtering, then this sequence is used for phase space reconstruction. The denoised sequence is shown in Fig.2, and then this sequence is used for phase space reconstruction.
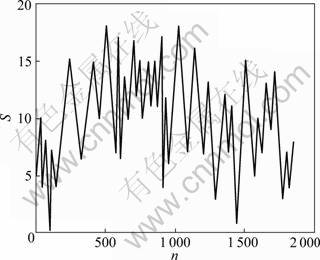
Fig.1 Up-peak arriving elevator traffic flow
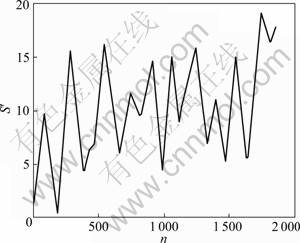
Fig.2 Up-peak arriving elevator traffic flow S′ after filtering
1.2 Phase space reconstruction
The phase space reconstruction is a powerful technique to recover the topological structure of a dynamical system given by a scalar time series. Suppose a single variable time series x1, x2, ・・・, xN of a dynamical system is observable, according to TAKENS′ theorem[22] , the dynamic of the time series is fully captured or reconstructed in the m-dimensional phase space. The reconstructed attractor of the original system is given by the vector sequence:
 (2)
(2)
where τ and m are the embedding delay and the embedding dimension, respectively. In order to reconstruct the original phase space, reconstruction parameters, the delay time τ and the embedding dimension m were first estimated.
1.3 Time delay
Because it is usually needed to deal with a finite amount of noisy data, a reasonable time delay τ is very important for efficient phase space reconstruction. Small delay yields strongly correlated vector elements, while large delay leads to unrelated vectors, the components of which are almost uncorrelated. The time delayed mutual information method suggested by fraser and swinney[23] is commonly used to determine a reasonable delay. Unlike the autocorrelation function, the mutual information also into takes account the nonlinear correlations. Time series of the ETF S is taken as the primary data series {x(t)}(t=1, 2, ・・・, n) and Q as the delayed data series {x(t+T)}. A measure of mutual information between data of a time series is given as:
 (3)
(3)
where Ps(si) is the probability to find a time series value in the ith interval, Psq(si, qi) is the joint probability that an observation falls into the ith interval and the observation time τ later falls into the jth interval. The first minimum of  is chosen as a delay time for the reconstruction of phase space.
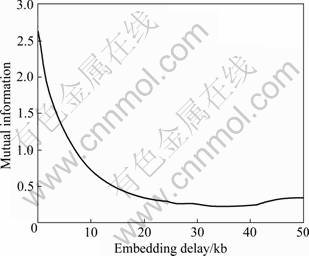
Fig. 3 Result of mutual information method for S′
From the analysis, mutual information method presents its first minimum at embedding delay τ =35 kB, which is chosen as the appropriate time delay for phase space reconstruction of the ETF.
1.4 Embedding dimension
The false nearest neighbor (FNN) algorithm suggested by Kennel et al[24] is the most commonly employed method to determine the minimal sufficient embedding dimension. The idea of the algorithm is as follows: for each point Xn in the time series, its nearest neighbor Xt in an m-dimensional space is studied. The separation between these two points is calculated as:
 (4)
(4)
Then in an (m+1)-dimensional space, the separation Rn(m+1) is computed. If Rn(m+1) is significantly higher than Rn(m), this point is marked as having an FNN. The criterion that the embedding dimension is high enough is that the fraction of FNN is zero, or at least sufficiently small.
From Fig.4, it can be clearly observed that the fraction of FNN convincingly drops to zero for m=8. So the minimal sufficient embedding dimension is taken as 8.
With τ=35 kb and m=8, the reconstructed attractor is shown in Fig.5. It is known that the structure of the attractor is very similar to that of the chaotic attractor, which shows the time series of ETF exhibits chaotic behavior.
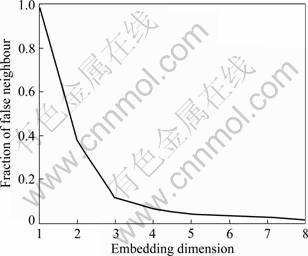
Fig. 4 Result of FNN method for ETF S′
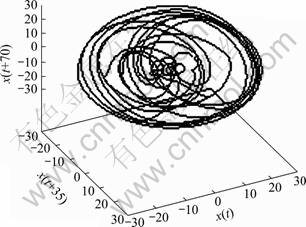
Fig. 5 Reconstructed attractors of ETF S′
1.5 Correlation dimension
The correlation dimension method is used for
detecting possible presence of chaos. An algorithm suggested by Grassberger and Procaccia[25] is the most commonly employed method. Let C(ε) be the number of points within all the sphere of radius ε. A plot of lnC(ε) versus lnε gives an approximately straight line, the slope of which in the limit of small ε and large N is the correlation dimension.
 (5)
(5)
whether Dr(F) can be got or not lies in ε. If ε is large enough, C(ε)=1. On the other hand, if ε is very small, C(ε)=0. If the system is chaotic, the slope of lnC(ε) versus lnε converges to m over an appropriate interval as m increases.
TISEAN package is used and correlation dimension D2≈1.55 is got as shown in Fig.6. This value indicates the possible existence of low-dimensional attractor.
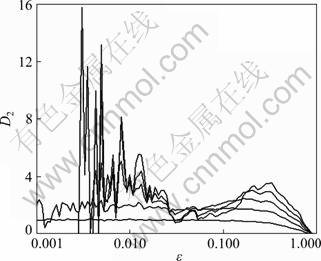
Fig.6 Estimation correlation dimension of ETF S′
1.6 Largest Lyapunov exponent (LLE)
The lyapunov exponent shows how predictable or unpredictable the system is. For a chaotic system, there is at least one positive Lyapunov exponent. According to the methodology Schreiber et al[26], the representation of the time series as a trajectory in the embedding space is considered. Assume that a close return Sn′ to a previously visited point Sn is observed, then the distance  is considered as a small perturbation, which grows exponentially in time. At time t, for a chaotic system,
  is obtainsed,
 (6)
(6)
If S(ε, m, t) exhibits a linear increase with identical slope for all m larger than m0 for a reasonable range of ε, then this slope can be taken as an estimate of the LLE.
Fig. 7 shows the computed LLE is the mean value of local slopes gathered from the linear regime when m=8, 9, 10 and converges to 0.02. This positive value indicates the existence of chaotic behavior and it is consistent with the estimation from the correlation dimension method and the FNN method as discussed above. Finally, the elevator down-peak traffic flow sequences, up-peak and down-peak riding traffic flow sequences and the up-peak and down-peak energy consumption sequences were analysed with the same method. All the reconstructed attractors are shown in Fig.8, LLE and correlation-dimension are listed in Table.1.
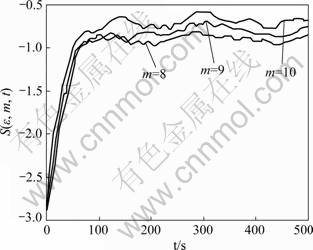
Fig.7 Estimation LLE of ETF S′
Table 1 Computation of largest Lyapunov exponents and D2 of elevator traffic flow
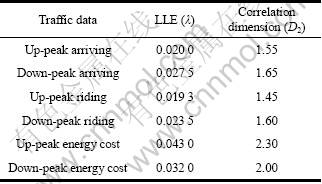
Fig. 8 shows the reconstructed attractors of up-peak and down-peak arriving traffic flow data, riding traffic flow data and the energy consumption data. It is seen that all the attactors share the similar shape, and they look like two strands of intersecting rings. The structure of these reconstructed attractor is very similar to that of the chaotic attractor. It shows that the time series of these data samples exhibit chaotic behavior. Moreover, the values of the LLE and correlation dimension of these elevator traffic system sequences are shown in Table.1 It is shown that the LLE of these traffic flow samples is very close to each other and are in the range of [0.02, 0.043]. The values of correlation dimension are in the range of [1.50, 2.3]. These ETF sequences exhibit similar low-dimensional chaotic behaviour. The chaotic characteristics obviously exist in the specific energy consumption data set. The presence of chaos in this energy time series is further supported by positive largest Lyapunov exponents of 0.048 and 0.032.
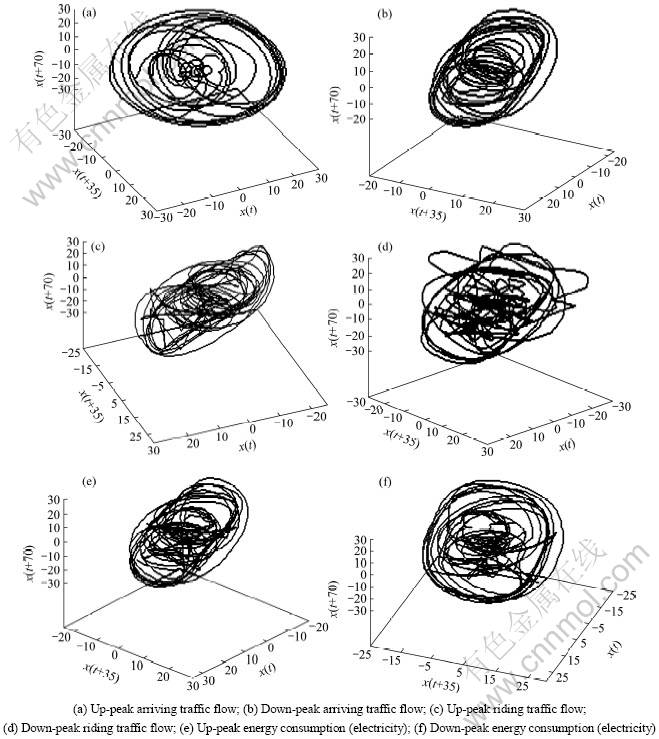
Fig.8 Reconstructed attractors of elevator traffic system
2 Conclusions
(1) The sequences of up-peak and down peak arriving traffic flow data , up-peak and down-peak riding traffic flow and the up-peak and down-peak energy consumption investigated were. After denoising with continuous wavelet transformation, these data sequences were analyzed by phase space reconstruction method. The sequences have very similar attractor shape.
(2) The correlation dimension and the LLE indicate low dimensional chaotic behaviour in all of the up-peak and down-peak traffic flow data sequences and energy consuming data set. It is suggested that chaotic properties may be ubiquitous in the elevator traffic sequences and energy data of all peak mode.
(3) This study helps to regulate the scheduling method of the group control system aiming at the traffic flow characteristics and energy cost.
References
[1] Eguchi T, Zhou Jin, Eto S, et al. Elevator group supervisory control system using genetic network programming with functional localization[J]. Jounal of Advanced Computational Intelligence and Intelligent Informatics, 2006, 10(3): 385-393.
[2] Nagatani T. Complex behavior of elevators in peak traffic[J]. Physica a-Statistical Mechanics and Its Applications. 2003, 326(3/4): 556-566.
[3] ZONG Qun, ZHAO Zhan-shan, SHANG An-na. Recursive forecasting method for elevator traffic flow based on SARIMA [J]. Transactions of Tianjin University, 2008, 41(6): 653-659.
[4] YAN Xiao-ke, LIU Yu, MAO Zong-yuan. SVM-based Elevator Traffic Flow Prediction[C]// Intelligent Control and Automation. WCICA. Dalian, China. 2006: 8814-8818.
[5] LUO Fei, XU Yu-ge, JIAN Zhong-cao. Elevator traffic flow prediction with least squares support vector machines[C]// Proceedings of the 4th International Conference on Machine Learning and Cybernetics, 2005: 4266-4270.
[6] ZONG Qun, WANG Wei-jia, SHANG An-na. A multi-mode prediction method for elevator traffic flow based on classification off-line[C]// Proceedings of the 27th Chinese Control Conference. 2008: 522-526.
[7] Benmakhlouf S M, Khator S K. Smart lifts: Control design and performance evaluation[J]. Computers and Industrial Engineering, 1993, 25(1/2/3/4): 175-178.
[8] Siikonen M J. Elevator traffic simulation[J]. Simulation, 1993, 61(4): 257-267.
[9] Barney G C. Elevator Technology[M]. Ellis Horwood: Chi Chester, 1986.
[10] Bigdeli N, Haeri M. Time-series analysis of TCP/RED computer networks, an empirical study[J]. Chaos Solitons and Fractals. 2009, 39(2): 784-800.
[11] Paxson V. Fast. Approximate synthesis of fractional Garssian noise for generating self-similar network traffic[J]. Computer Communication Review, 1997, 5(3): 5-18.
[12] Nagatani T. Dynamical behavior in the nonlinear-map model of an elevator[J]. Physica a-Statistical Mechanics and Its Applications. 2002, 310(1/2): 67-77.
[13] Nagatani T. Dynamical transitions in peak elevator traffic[J]. Physica a-Statistical Mechanics and Its Applications 2004, 333: 441-452.
[14] Nagatani T. Chaos and dynamical transition of a single vehicle induced by traffic light and speedup[J]. Physica a-Statistical Mechanics and Its Applications, 2005, 348: 561-571.
[15] Nagatani T. Chaos control and schedule of shuttle buses[J]. Physica a-Statistical Mechanics and Its Applications, 2006, 371(2): 683-691.
[16] Low D J, Addison P S. Chaos in a car-following model with a desired headway time[C]//Proceedings of the 30th ISA-TA Conference. Florence, Italy, 1997: 175-182.
[17] Nagatani T, Nagai R. Chaotic and periodic motions of two competing vehicles controlled by traffic lights[J]. Chaos Solitons and Fractals, 2005, 25: 245-253.
[18] Lo S C, Cho H J. Chaos and control of discrete dynamic traffic model[J]. Journal of the Franklin Institute-Engineering and Applied Mathematics 2005, 342(7): 839-851.
[19] Nagatani J H C, Iu H H C, et al. Analysis and control of bifurcation and chaos in average queue length in TCP/RED model[J]. International Journal of Bifurcation and Chaos 2008, 18(8): 2449-2459.
[20] Vasalos I, Carrasco R A, Woo W L. Nonlinear complex behavior of TCP in UMTS networks and performance analysis[J]. Iet Circuits Devices and Systems, 2008, 2(1): 69-79.
[21] Feng Hui-fang, Shu Yan-tai, Yang O W W. Nonlinear analysis of wireless LAN traffic[J]. Nonlinear Analysis-Real World Applications 10(2): 1021-1028.
[22] Takens F. Detecting strange attractors in turbulence[J]. Lecture Notes in Mathematics, 1981, 898: 366-381.
[23] Frazer A M, Swinney H L. Independent coordinates for strange attractors from mutual information[J]. Physics Review A, 1986, 33(2): 1134-1140.
[24] Kennel M, Brown R, Abarbanel H. Determining embedding dimension for phase-space reconstruction using a geometrical construction[J]. Physics Review A, 1992, 45(6): 3403-3411.
[25] Grassberger P, Procaccia I. Measuring the strangeness of strange attractors[J]. Physica D: Nonlinear Phenomena, 1983, 9(1/2): 189-208.
[26] Schreiber T, Kantz H. Practical implementation of nonlinear time series methods: The TISEAN package[J]. Chaos, 1999, 9(2): 413-435.
(Edited by FANG Jing-hua)
Received date: 2011-04-15; Accepted date: 2011-06-25
Foundation item: Projects (60874073, 91016018) supported by the National Nature Science Foundation of China; Project (11JCZDJC25100) supported by Tianjin Basic Research Key Foundation, China
Corresponding author: LI Jun-fang, Tel: +86-13001313111,E-mail: wendyljf@sina.com

