Practical approach to determining traffic congestion propagation boundary due to traffic incidents
��Դ�ڿ������ϴ�ѧѧ��(Ӣ�İ�)2017���2��
�������ߣ��ι��� ������ �ŷ� ���� ����
����ҳ�룺413 - 422
Key words��kinematic wave model; Van Aerde model; traffic incident; congestion propagation on network
Abstract: A practical approach for predicting the congestion boundary due to traffic incidents was proposed. Based on the kinematic wave theory and Van Aerde single-regime flow model, a model for estimating the congestion propagation speed for the basic road segment was developed. Historical traffic flow data were used to analyze the time variant characteristics of the urban traffic flow for each road type. Then, the saturation flow rate was used for analyzing the impact of the traffic incident on the traversing traffic flow at the congestion area. The base congestion propagation speed for each road type was calculated based on field data, which were provided by the remote traffic microwave sensors (RTMS), floating car data (FCD) system and screen line survey. According to a comparative analysis of the congestion propagation speed, it is found that the expressway, major arterial, minor arterial and collector are decreasingly influenced by the traffic incident. Subsequently, the impact of turning movements at intersections on the congestion propagation was considered. The turning ratio was adopted to represent the impact of turning movements, and afterward the corresponding propagation pattern at intersections was analyzed. Finally, an implementation system was designed on a geographic information system (GIS) platform to display the characteristics of the congestion propagation over the network. The validation results show that the proposed approach is able to capture the congestion propagation properties in the actual road network.
Cite this article as: FEI Wen-peng, SONG Guo-hua, ZHANG Fan, GAO Yong, YU Lei. Practical approach to determining traffic congestion propagation boundary due to traffic incidents [J]. Journal of Central South University, 2017, 24(2): 413-422. DOI: 10.1007/s11171-017-3443-2.
J. Cent. South Univ. (2017) 24: 413-422
DOI: 10.1007/s11171-017-3443-2

FEI Wen-peng(������)1, SONG Guo-hua(�ι���)1, ZHANG Fan(�ŷ�)2, GAO Yong(����)3, YU Lei(����)4
1. School of Traffic and Transportation, Beijing Jiaotong University, Beijing 100044, China;
2. China Communications News, Beijing 100011, China;
3. Beijing Transportation Research Center, Beijing 100073, China;
4. College of Science, Engineering and Technology, Texas Southern University, Houston, Texas 77004, USA
 Central South University Press and Springer-Verlag Berlin Heidelberg 2017
Abstract: A practical approach for predicting the congestion boundary due to traffic incidents was proposed. Based on the kinematic wave theory and Van Aerde single-regime flow model, a model for estimating the congestion propagation speed for the basic road segment was developed. Historical traffic flow data were used to analyze the time variant characteristics of the urban traffic flow for each road type. Then, the saturation flow rate was used for analyzing the impact of the traffic incident on the traversing traffic flow at the congestion area. The base congestion propagation speed for each road type was calculated based on field data, which were provided by the remote traffic microwave sensors (RTMS), floating car data (FCD) system and screen line survey. According to a comparative analysis of the congestion propagation speed, it is found that the expressway, major arterial, minor arterial and collector are decreasingly influenced by the traffic incident. Subsequently, the impact of turning movements at intersections on the congestion propagation was considered. The turning ratio was adopted to represent the impact of turning movements, and afterward the corresponding propagation pattern at intersections was analyzed. Finally, an implementation system was designed on a geographic information system (GIS) platform to display the characteristics of the congestion propagation over the network. The validation results show that the proposed approach is able to capture the congestion propagation properties in the actual road network.
Key words: kinematic wave model; Van Aerde model; traffic incident; congestion propagation on network
1 Introduction
The continued expansion of the city��s boundary has generated a rapid increase of traffic on urban roads, resulting in worsened traffic congestions that have brought negative impacts on the daily life of citizens. Traffic congestions can be categorized into two types: recurrent congestion and non-recurrent congestion. The recurrent congestion generally happens at fixed time periods and fixed locations. This kind of congestion is usually less challengeable when traffic engineers and managers strive to develop effective congestion counter measures. However, the non-recurrent congestion, which is generally caused by traffic incidents with unexpected times and locations, is more difficult to be countered.This work attempts to develop an approach for analyzing the characteristics of the congestion propagation in the network caused by traffic incidents (e.g. non-recurrent congestion), which can be used by traffic engineers and managers to develop various effective traffic and congestion management strategies.
Numerous studies have been conducted to research the impact of traffic incidents on the road network. The models are able to be categorized into two types: microscopic models and macroscopic models. At the microscopic level, EDIE [1] suggested a variation in the car-following and continuum theories in an effort to make them more accurate for less-than-optimal traffic densities. LI et al [2] utilized an improved cellular automata (CA) model to analyze the traffic congestion propagation properties and to evaluate control strategies.
At the macroscopic level, much more models have been developed. ROBERG et al [3] developed several alternative strategies to gridlock and dissipate traffic congestions, in terms of the installation of bans at specific network locations. Furthermore, WRIGHT et al [4] proposed a simple analytical model for the incident- based congestion growth and discussed the effect of the length of the channelized path of roads and stop-line width assignment on congestion formation. Additionally, strategies for congestion control on idealized rectangular gird networks have been investigated. DAGANZO [5] proposed a cell transmission model (CTM) to simulate the evolution of multi-commodity traffic flows over complex networks, which is consistent with the kinematic wave theory [6, 7] under all traffic conditions. This model was improved by many scholars to generate more realistic results. XIE et al [8] developed a traffic light extended cell transmission model, where the influence of flow collisions and gridlocks are modeled by a single Collisions and Gridlocks (CG) parameter. LONG et al [9, 10] proposed a congestion propagation model of the urban network traffic based on the cell transmission model, and developed a selection of control strategies and demonstrated their effectiveness in dispersing incident-based traffic congestions in two-way rectangular grid networks. ZHANG et al [11] addressed the problem of the temporary vehicle movement bans design under incident-based traffic congestion situation based on cell transmission model. LI et al [12] proposed an improved mesoscopic traffic flow model to capture the speed-density relationship on segments, the length of queue, and the flow on links in a bidirectional grid network for different demand levels. QI et al [13, 14] proposed two indexes, speed of virtual signal (SVS) and velocity of spillover (VOS) to simulate the traffic congestion in large signalized road network. SVS modeled the propagation of queue within a link while VOS reflected the spillover velocity of vehicle queue. These models aforementioned are more or less useful for understanding partial congestion propagation properties. However, due to the virtual grid network-based analysis, the practical application of these models in the actual road network still needs to be testified.
In recent years, new methods are used to analyze the congestion properties based on the actual road network. LECUE et al [15] utilized semantic web technologies to predict the severity of road traffic congestion. ZHANG et al [16] proposed an intelligent- based prediction system, fuzzy-neural network prediction system (FNNPS), as a decision support to operators. MA et al [17] applied the extended deep learning theory to analyze the congestion propagation in large-scale transportation network. These models are on basis of large-scale data and are not feasible for a widely application since they did not reveal the internal mechanism of congestion propagation.
For the purpose of accurately capturing the congestion propagation in an actual road network, this work attempts to develop an analysis approach for predicting the congestion propagation in the actual road network caused by traffic incidents. The kinematic wave model was used to predict the congestion propagation speed on the basic road segment, and an algorithm for the congestion propagation in the network was designed. In addition, the predicted congestion evolution patterns can be visualized temporally and spatially through a map-based platform, which was also used by CHENG et al [18], ANWAR et al [19], and MA et al [17]. This approach is practical application oriented and supported by existing traffic data collection systems including the floating car data (FCD), remote traffic microwave sensor (RTMS) and screen line survey.
2 Methodology
2.1 Data preparation
The floating car system in Beijing, China includes 67 thousand taxis, which accounts for 1.3% of the total vehicle population. Due to the characteristics of high utilization and long running time, taxis account for around 10% of the total traffic flows in the road network. FCD contains fields of the time, link ID, speed, and length. The space mean speed is provided by FCD at a 5-min time interval. Based on a well calibrated fundamental diagram model, the corresponding density could be calculated. Therefore, FCD was utilized in this work to represent operating characteristics of the urban traffic flow in Beijing.
Remote traffic microwave sensors (RTMS) are installed on expressways in Beijing, China. The RTMS data include fields of the location, time, lane number, volume, speed, and occupancy. Traffic flow parameters such as the flow, time mean speed and occupancy are collected by RTMS at a 2-min time interval. The time mean speed from RTMS is not quite accurate, especially in low speed conditions, so it cannot be used in the fundamental diagram model. Moreover, it is unreliable to use the occupancy data from RTMS to calculate the density of the entire segment. Therefore, only the flow data collected from RTMS are used in this work.
For the road types of major arterials, minor arterials and collectors, there are no traffic detectors installed on these facilities. Therefore, historical screen line survey data were adopted for these road types. In 2010, a comprehensive screen line survey was conducted by beijing transportation research center (BJTRC). This survey designed 9 screen lines and involved 383 survey spots. 24 h continuous flows were investigated at 88 survey spots. So, the screen line survey data are sufficient to provide historical flow data for various road types.
The website of Beijing traffic management bureau provides the information of traffic incidents. The information of 46 typical traffic incidents was selected from 2010 to 2012. The primary information includes time, location and severity of the traffic incident. For instance, one traffic incident is described as follows: Siyuan bridge on the northeastern section of the 4th ring-road expressway, southbound direction, traffic accident occurred at the inner side of the main road, two inner lanes are occupied, and the congestion propagates to Wangjing bridge.
2.2 Model development
The kinematic wave model was used to develop the congestion propagation model for the basic road segment as
 (1)
(1)
where us is the congestion propagation speed (or shockwave speed), qA represents the upstream traffic flow in vehicles per unit time per lane, and qB is the number of vehicles that outflows from the congested area B to the downstream area per unit time per lane, kA and kB represent densities of the upstream area A and the congested area B, respectively.
The kinematic wave model has been widely used to model characteristics of the congestion propagation. Based on the kinematic wave model, MICHALOPOULOS et al [20] proposed an estimation model of the traffic congestion boundary caused by traffic incidents. Compared to the deterministic queuing theory, this model outputs more realistic results. Nevertheless, it is hard for the model to use in practical application because the field and accurate traffic density data could not be collected directly. However, the new floating car system could provide the space mean speed, and based on a well calibrated fundamental diagram model, the traffic density could be estimated. As discussed earlier, Van Aerde proposed a single regime unimodal model to model the speed-density relationship. Furthermore, RAKHA et al [21] analyzed the advantage of Van Aerde model according to a comparison with Greenshields and Pipes models. Based on the Van Aerde model, ZHAO et al [22] and ZHU [23] analyzed and calibrated the speed-density relationship on the 2nd, 3rd and 4th ring-road expressways in Beijing. It was found that the Van Aerde model outperformed other models. The Van Aerde model is described by

 (2)
(2)
where the free-flow speed (uf), speed-at-capacity (uc), capacity (qc), and jam density (kj) are four basic parameters that require the calibration. c1, c2 and c3 are intermediate variables.
Based on the standard traffic flow model, traffic parameters of the flow, density and speed could be combined into the relationship of q=ku. Therefore, the flow-density relationship could be derived as

 (3)
(3)
Traffic incidents have a serious impact on the road capacity, and the number of vehicles that can traverse the traffic incident section decreases depending on the severity of the traffic incident. The resulting congestion in area B then propagates along to the upstream area A, as shown in Fig. 1.
According to the above analysis, the practical application of the kinematic wave model is limited by the field data collection system. Hence, the derivation of each traffic parameter is of great importance for successful applications of the kinematic wave model. In this work, the saturation flow rate was used to represent the actual number of vehicles that traverse the incident section. For instance, in a road segment with three lanes where two lanes are closed due to a traffic incident, vehicles are forced to traverse the section through the remaining lane, as shown in Fig. 1. Vehicles in area B are transitioning from the jammed condition to the saturation flow rate, thus speed is low and the density is high. This
situation is similar to the concept of the saturation flow rate in a signal controlled intersection. The saturation flow rate is defined as the equivalent hourly rate at which previously queued vehicles can traverse an intersection under prevailing conditions. The saturation flow rate in this work was taken as the actual number of vehicles traversing the traffic incident section. Under the traffic incident, the saturation flow rate is determined by the number of closed lanes and the driving behavior. Therefore, the number of vehicles that traverse the traffic incident section needs to be adjusted according to the number of closed lanes as
 (4)
(4)
where QB is the number of vehicles that traverse the traffic incident section when some lanes are closed, in vehicles per unit time per lane; Qs is the saturation flow rate under prevailing conditions, in vehicles per unit time per lane; n is the total number of lanes; and n�� represents the number of closed lanes due to the traffic incident.

Fig. 1 Congestion propagation due to traffic incident
The number of vehicles that traverse the traffic incident section is also influenced by the high frequent lane changes in area B. YANG et al [24] developed a lane change model under the saturation flow rate based on four corresponding characteristics: 1) high frequency of lane changes; 2) little spacing of lane changes; 3) high influence on traffic operating conditions; and 4) relatively steady required time for lane changes. The number of vehicles that could traverse the congestion area B was adjusted further by taking the impact of the lane changing behavior into account and computed as
 (5)
(5)
where �� is the adjustment factor of the saturation flow rate, which is a constant for all segments.
The parameter �� was calibrated based on actual traffic incidents in this work. First, the congestion propagation speed was calculated based on field data of three traffic incidents as shown in Table 1. Then, based on the proposed model, the congestion propagation speed was estimated under various �� values. Further, the estimated propagation speeds were compared with the field measured propagation speed. Finally, the optimal �� value was recommended based on the minimum estimation error. Three typical traffic incidents on the western 4th ring-road expressway with four lanes in each direction and the eastern 3rd ring-road expressway with three lanes in each direction in 2012 were adopted for selecting the optimal �� value. The information of traffic incidents is shown in Table 1.
Based on various adjustments of the �� value, the mean absolute deviation (MAD) of the congestion propagation speed was calculated, as shown in Fig. 2. It is found that the optimal factors range from 0.51 to 0.59, thus the average value ��=0.54 is selected as the optimal adjustment factor.
The number of upstream vehicles that advance into the congested area B was obtained by the historical flow data from RTMS and the screen line survey data. The number of vehicles that traverse the congested area B was calculated according to the saturation flow rate and the �� adjustment factor shown in Eqs. (4) and (5).Further, the density of the upstream area A was calculated by the speed-density relationship of the Van Aerde model shown in Eq. (2). Because the real-time space mean speed of the congested area B could hardly be obtained, and the traffic flow of this area could be calculated according to Eqs. (4) and (5), the density of the congested area B was calculated by the flow-density relationship derived from the Van Aerde model shown in Eq. (3). Consequently, the model of the congestion propagation speed is derived as


 (6)
(6)
On the other hand, the congestion propagation speed is also affected by the traffic demand, which is a temporal- and spatial-variant parameter in the road network. The flow qA in the proposed model represents the corresponding traffic demand. According to the comparative analysis of historical flow curves of ordinary days, it is found that the historical traffic flow generally remained consistent. It is a steady curve with a slight fluctuation for ordinary days. Therefore, it is reasonable to adopt the road-specific historical flow to represent the traffic demand.
More specifically, this work selected data of the
western 3rd ring-road expressway in Beijing for an example analysis. Both RTMS data and FCD on June 21st, 2012 were identified. All data were aggregated into the 60-min time interval, as shown in Fig. 3.
Table 1 Information of traffic incidents


Fig. 2 MAD of congestion propagation speed under various �� values.
Based on the FCD speed, the corresponding density of the upstream area A was calculated by applying the Van Aerde model. The local parameters for the Van Aerde model were adopted according to the study by ZHAO et al [22], ZHU [23], and HESHAM [25], in which uf, uc, uc and kj are calibrated for the western 3rdring-road. The results are uf=70 km/h, uc=35 km/h, qc=1808 h-1, and kj=144 km-1. In addition, the western 3rd ring-road is a three-lane expressway, with an incident that happened at 7:00 A.M. with one lane closed. Consequently, the congestion propagation speed on the expressway was computed as follows.

Fig. 3 Time variant curve of FCD speed and RTMS volume on the Western 3rd Ring-Road Expressway in Beijing.
Step 1): Calculate the value of the intermediate variables c1=0, c2=0.48611 and c3=0.00016, and then calculate the density on the upstream area A at 7:00 A.M. based on Eq. (2).
 =1/[(0+0.48611/(70-34.28)+0.00016��34.28)] =52.37 km-1
Step 2): Calculate the number of vehicles that traverse the congested area B based on Eqs. (4) and (5). The saturation flow rate Qs was equal to qc.
 h-1
h-1
Step 3: Calculate the density on congested area B based on Eq. (3).


=(-0.00016��650.88��70+70)/(2��0.48611)+
{[(-0.00016��650.88��70+70)2-4��0.48611��
(650.88-0.00016��650.882)]1/2}/(2��0.48611)
=118.92 km-1
Step 4: Calculate the congestion propagation speed at 7:00 A.M based on Eq. (1).
 km��h-1
By following the above process, the congestion propagation speed under various traffic incidents could be calculated. The congestion propagation speed is different for different road types due to the variations in the traffic demand and the signal control. By using RTMS and screen line survey data, typical time variant traffic flows for each road type were derived, as shown in Fig. 4. The corresponding time variant curve of the speed was obtained from FCD, as shown in Fig. 4.
Based on the time variant volume and speed, time variant congestion propagation speeds on different road types were calculated according to the process provided above. A corresponding database was then established. The congestion propagation speed is shown in Fig. 5 under the condition that the road was blocked entirely.
2.3 Consideration of turning movements
It is necessary to consider the impact of turning movements at intersections when analyzing the characteristics of the congestion propagation in thenetwork. Vehicles at an intersection advance into various downstream segments because of different destinations and routine plans. However, when the downstream segments are congested, the number of vehicles that advance into these congested downstream segments decreases accordingly. As discussed earlier, the total number of vehicles in the segment was taken as the traffic demand for calculating the congestion propagation speed. However, only certain proportion of these vehicles actually advance into the congested downstream segment. Consequently, it is necessary to adjust the congestion propagation speed according to the ratio of turning movements in order to more accurately capture the characteristics of the congestion propagation in the network.

Fig. 4 Time variant curves of single lane volume and FCD speed for various road types
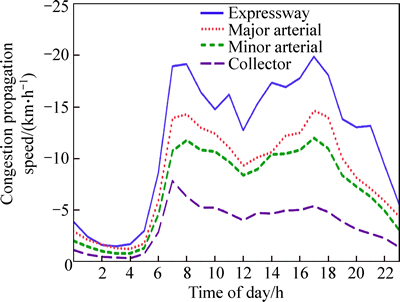
Fig. 5 Time variant congestion propagation speeds for various road types (Totally blocked)
The turning ratio is various according to road types. For instance, at a major-minor arterial intersection, drivers generally prefer to drive on the major arterial. This behavior also results in less vehicles advancing into the congested downstream segment and the congestion propagation speed decreases correspondingly. In addition, although the turning ratio on the major arterial varies at different intersections, which needs field surveys for specific locations, to simplify the analysis, this work assumed a constant turning ratio for the same road type. Based on the analysis and surveys, the average turning ratio was set as 0 for expressways, 0.55 for major arterials, 0.60 for minor arterials and 0.69 for collectors in Beijing. The adjustment of the congestion propagation speed at intersection is shown as
 (7)
(7)
where  represents the actual congestion propagation speed on the upstream segment and us represents the base congestion propagation speed based on the proposed model, Rt is the turning ratio of various road types at intersections.
It should be noted that when the congestion propagates in a straight backward direction (direction ��Westbound�� in Fig. 6) through the intersection ��I,�� the congestion propagation speed is adjusted only once at the first intersection during the whole process. The turning ratio is defined as the ratio of the number of vehicles that advance into other roads and the total number of vehicles on the segment. And the total number of vehicles on the segment is assumed remaining consistent for the same road type. For other directions of ��Northbound�� and ��Southbound�� connected to the intersection ��I,�� because the segments of ��d�� and ��e�� have been totally blocked, no matter how many lanes are closed on segment ��a,�� n and n�� in Eq. (6) are considered to have the same value for the segments of ��d�� and ��e��.

Fig. 6 Characteristics of congestion propagation in network
2.4 Implementation system design
Based on the proposed model for the congestion propagation speed and a geographic information system (GIS) platform, a system was designed to implement the proposed model according to a three-layer system framework. The framework consisted of the data layer, application support layer and application layer. The data layer consists of two databases, one for the time variant congestion propagation speed, and the other one for physical properties of the road network. The application support layer is used to implement the GIS-based algorithm by using the database and the proposed model. The application layer designs the interfaces with parameter inputs and the outputs of the network congestion displays.
The proposed implementation process mainly includes 6 steps.
Step 1): Develop the GIS cartographic database and the congestion propagation speed database. In the cartographic database, besides the basic fields of link ID, segment length and road type, two fields need to be added. One is for the segment congestion state, and the other one is for the pointer for the boundary segments of the congestion propagation.
Step 2): According to the traffic incident information from the Beijing Traffic Management Bureau, China, the severity of traffic incidents and the value of n and n�� in Eq. (6), and the incident occurrence time are identified.
Step 3): Identify the link ID, segment length and road type of the traffic incident based on the GIS Cartographic database.
Step 4): Based on the physical properties of the subject segment, calculate the base propagation speed based on the congestion propagation database.
Step 5): Identify the influenced segments, directions, and the turning ratio of the subject segments. Calculate the adjusted congestion propagation speed according to the base propagation speed and turning ratio.
Step 6): Update the segment congestion state, and the pointer for boundary segments at each 30 s interval.
The flowchart of the implementation system is shown in Fig. 7.
According to the designed implementation process, the congestion propagation speed and congestion boundary segments can be calculated at any time after the traffic incident by using the link ID, occurrence and duration time of the traffic incident as input parameters. Thus, the congestion propagation processes and patterns can be displayed on the GIS platform.
3 Case study
3.1 Information of traffic incidents
A comparative analysis between the modeled results and the field measurements was conducted to demonstrate the application of the proposed model. At 8:40 A. M. on July 7th, 2012, Beijing Traffic Management Bureau reported a traffic incident: at Wanliu bridge on the southern 3rd ring-road expressway, two eastbound lanes were occupied by the road work.
First, the model selected the link ID on the corresponding area influenced by the traffic incident on the GIS map. Then, FCD from 8:45 to 9:20 on July 7th, 2012 were selected. According to the road type and the speed, the traffic condition was categorized into five levels with different colors. Finally, it was able to obtain the field congestion conditions of surrounding areas. Based on the proposed model, the corresponding congestion propagation boundaries were estimated and outputted on the GIS platform.
3.2 Results and analysis
The results based on the proposed model are shown in Fig. 8.
Based on the field observations, it is found that the congestion respectively propagated to upstream direction about 1.7 and 2 km at 5 and 10 min after the incident. The modeled results for the corresponding time periods are 1.5 and 2 km, respectively. Further, at 30 min after the incident, the modeled results showed that the congestion propagated to not only upstream direction, but also other directions linked by ramps and intersections. And moreover, at 60 min after the incident, the propagation area has been enlarged to surrounding areas and intersected links. These predicted results are consistent with the field observations. Consequently, according to the comparative analysis, it is found that the proposed model performs well in the prediction of congestion propagation boundaries caused by the traffic incident.
4 Conclusions and recommendations
This work proposes an approach for predicting congestion propagation boundaries caused by traffic incidents. First, based on the kinematic wave theory and Van Aerde model, an estimation model of the congestion propagation speed for the basic road segment is developed. Historical traffic flow data are incorporated to represent the time variant characteristics of the urban traffic flow for each road type. Then, the saturation flow rate is used to analyze the impact of the traffic incident on the traversing traffic flow at the congested area. The
adjustment factor value represented by �� is calibrated based on field data, and ��=0.54 is recommended as the optimal value. In addition, the base congestion propagation speed for different road types was calculated and analyzed. According to the comparative analysis, it is found that the traffic incident affects the propagation most significantly on the expressway, on which the congestion propagation speed reaches as high as 19.9 km/h at the evening peak hour. The expressway, major arterial, minor arterial, and collector are affected decreasingly by the traffic incident, and the maximum congestion propagation speeds on the major arterial,
minor arterial, and collector are 10 km/h, 6.4 km/h and 4.8 km/h, respectively during the morning peak hour.Subsequently, the impact of turning movements at intersections on the propagation is considered. The turning ratio is taken to represent the turning movement impact factor, and the corresponding propagation pattern at intersections is analyzed.

Fig. 7 Flowchart of congestion propagation implementation system
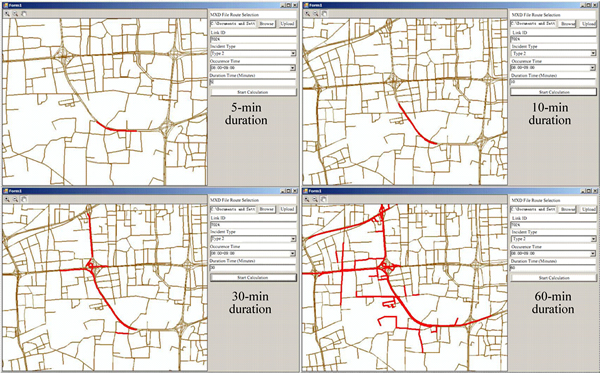
Fig. 8 Characteristics of modeled congestion propagation in network
In order to depict the congestion propagation characteristics in the network, a corresponding implementation system is designed based on the congestion propagation model on a GIS platform. The results show that the proposed model and system performed well in predicting congestion propagation boundaries caused by traffic incidents.
In the future work, the congestion dissipation models are recommended to be integrated to simulate both propagation and dissipation processes.
References
[1] EDIE L C. Car-following and steady-state theory for non-congested traffic [J]. Operations Research, 1966, 9(1): 66-76.
[2] LI Xian-sheng, ZHENG Xue-lian, GUO Wei-wei, REN Yuan-yuan, WANG Yu-ning, YANG Meng. Traffic accident propagation properties and control measures for urban links based on cellular automata [J]. Advances in Mechanical Engineering, 2013, 2013: 1-8.
[3] ROBERG P, ABBESS C R, WRIGHT C. Traffic jam simulation [J]. Journal of Maps, 2007, 3(1): 107�C121.
[4] WRIGHT C, ROBERG P. The conceptual structure of traffic jams [J]. Transport Policy, 1998, 5(1): 23-35.
[5] DAGANZO C. The cell transmission model: Network traffic [J]. Transportation Research Part B: Methodological, 1995, 29(2): 79-93.
[6] LIGHTHILL M J, WHITHAM G B. On kinematic waves II: A theory of traffic flow on long crowded roads [C]// Proceedings of the Royal Society of London A: Mathematical, Physical and Engineering Sciences. London, UK: The Royal Society, 1955: 317-345.
[7] RICHARDS P I. Shock waves on the highway [J]. Operations Research, 1956, 4(1): 42-51.
[8] XIE Bo, XU Ming, HARRI J, CHEN Ying-wen. A traffic light extension to cell transmission model for estimating urban traffic jam [C]// Personal Indoor and Mobile Radio Communications (PIMRC), IEEE, 2013: 2566-2570.
[9] LONG Jian-cheng, GAO Zi-you, REN Hua-ling, LIAN Ai-ping. Urban traffic congestion propagation and bottleneck identification [J]. Science in China Series F: Information Sciences, 2008, 51(7): 948-964.
[10] LONG Jian-cheng, GAO Zi-you, ORENSTEIN P, REN Hua-ling. Control strategies for dispersing incident-based traffic jams in two-way grid networks [J]. IEEE Transportation on Intelligent Transportation Systems, 2012, 13(2): 469-481.
[11] ZHANG Ao-mu-han, GAO Zi-you, REN Hua-ling. Incident-based traffic congestion control strategy [J]. Technological Sciences, 2011, 54(5): 1338-1344.
[12] LI Shu-bin, FU Bai-bai, ZHENG Jian-feng. Dynamic analysis of traffic state and congestion propagation on bidirectional grid network [J]. Discrete Dynamics in Nature and Society, 2013, 2013: 1-7.
[13] QI Hong-sheng, WANG Dian-hai, CHEN Peng, BIE Yi-ming. Traffic jam in signalized road network [J]. Journal of Central South University, 2014, 21: 832-842.
[14] QI Hong-sheng, WANG Dian-hai, CHEN Peng. Formation and propagation of local traffic jam [J]. Discrete Dynamics in Nature and Society, 2013, 2013: 1-12.
[15] LECUE F, TUCKER R, BICER V, TOMMASI P, DIOTALLEVI S T, SBODIO M. Predicting severity of road traffic congestion using semantic web technologies [C]// European Semantic Web Conference. Crete, Greece: Springer International Publishing, 2014: 611-627.
[16] ZHANG Xiao-li, PENG Hu. An intelligent-based prediction system for incident induced congestion spreading [C]// 2011 International Conference on Transportation, Mechanical, and Electrical Engineering (TMEE), 2011: 2021-2025.
[17] MA Xiao-lei, YU Hai-yang, WANG Yun-peng, WANG Yin-hai. Large-Scale Transportation network congestion evolution prediction using deep learning theory [J]. PloS One, 2015, 10(3): 1-17.
[18] CHENG Tao, TANAKSARANOND G, BRUNSDON C, HAWORTH J. Exploratory visualisation of congestion evolutions on urban transport networks [J]. Transportation Research Part C: Emerging Technologies, 2013, 36: 296-306.
[19] ANWAR A, NAGEL T, RATTI C. Traffic origins: A simple visualization technique to support traffic incident analysis [C]// Pacific Visualization Symposium (PacificVis), IEEE, 2014: 316-319.
[20] MICHALOPOULOS P G, PISHARODY V B. Derivation of delays based on improved macroscopic traffic models [J]. Transportation Research Part B: Methodological, 1981, 15(5): 299-317.
[21] RAKHA H, CROWTHER B. Comparison of the Greenshields, Pipes, and Van Aerde car-following and traffic stream models [J]. Transportation Research Record: Journal of Transportation Research Board, 2002, 2143, 248-262.
[22] ZHAO Na-le, YU Lei, ZHAO Hui, GUO Ji-fu, WEN Hui-min. Analysis of traffic flow characteristics on ring-road expressways in Beijing [J]. Journal of the Transportation Research Board, 2009, 2124: 178-185.
[23] ZHU Lin. Theory and method studies on traffic situation assessment for urban expressways [D]. Beijng, China: Beijing Jiaotong University, 2013. (in Chinese)
[24] YANG Xiao-bao, ZHANG Ning, HUANG Li-bing. Lane changing model in road capacity simulation [J]. Journal of Highway and Transportation Research and Development, 2007, 24(5): 109-113 (in Chinese).
[25] HESHAM R. Spd_cal [EB/OL]. [2015-4-23] http://filebox.vt.edu/ users/hrakha/software.htm#Integration.
(Edited by FANG Jing-hua)
Cite this article as: FEI Wen-peng, SONG Guo-hua, ZHANG Fan, GAO Yong, YU Lei. Practical approach to determining traffic congestion propagation boundary due to traffic incidents [J]. Journal of Central South University, 2017, 24(2): 413-422. DOI: 10.1007/s11171-017-3443-2.
Foundation item: Project(2012CB725403) supported by the National Basic Research Program of China; Projects(51678045, 51578052) supported by the National Natural Science Foundation of China; Project(2016JBM032) supported by the Fundamental Research Funds for the Central Universities, China
Received date: 2015-08-27; Accepted date: 2016-03-08
Corresponding author: SONG Guo-hua, Associate Professor, PhD; Tel: +86-10-51684022; E-mail: GhSong@bjtu.edu.cn

