J. Cent. South Univ. Technol. (2010) 17: 277-284
DOI: 10.1007/s11771-010-0042-2 
Equilibrium and kinetics of adsorption of Ca(Ⅱ) ions onto KCTS and HKCTS
DING Ping(丁萍)1, HUANG Ke-long(黄可龙)2, YANG Hua(杨桦)1, LI Gui-yin(李桂银)2, LIU Yan-fei(刘艳飞)2
1. School of Public Health, Central South University, Changsha 410078, China;
2. School of Chemistry and Chemical Engineering, Central South University, Changsha 410083, China
? Central South University Press and Springer-Verlag Berlin Heidelberg 2010
Abstract: The adsorption of Ca(Ⅱ) ions from aqueous solution by chitosan α-ketoglutaric acid (KCTS) and hydroxamated chitosan α-ketoglutaric acid (HKCTS) was studied in a batch adsorption system. The Langmuir and Freundlich adsorption models were applied to describing the equilibrium isotherms, and isotherm constants were determined. The kinetics of the adsorption with respect to the initial Ca(Ⅱ) ions concentration, temperature and pH was investigated. The pseudo-first-order and second-order kinetic models were used to describe the kinetic data and the rate constants were evaluated. The results show that the experimental data fit well to the Langmuir isotherms with a high correlation coefficient (R2). The pseudo-second-order rate expression provides the best fitting kinetic model. The pseudo second-order kinetic model is indicated with the activation energy of 26.22 kJ/mol and 6.16 kJ/mol for KCTS and HKCTS, respectively. It is suggested that the overall rate of adsorption of Ca(Ⅱ) ions is likely to be controlled by the chemical process.
Key words: chitosan α-ketoglutaric acid; hydroxamated chitosan α-ketoglutaric acid; Ca(Ⅱ) ions; adsorption kinetics
1 Introduction
Chitosan (CTS) is a biopolymer produced from chitin by partially deacetylating its acetamido groups with a strong alkaline solution, and contains high contents of amino and hydroxyl functional groups. Useful features of chitosan include its abundance, non-toxicity, hydrophilicity, biocompatibility, biodegradability, and anti-bacterial property [1]. Chitosan has been reported for the high potentials of adsorption metal ions [2], noble metal ions [3-5], dyes [6-7], proteins [8] and humic acid [9-10].
Several methods have been used to modify raw chitosan flake by either physical or chemical modifications [11-12]. These modifications were proposed in order to improve pore size, mechanical strength, chemical stability, hydrophilicity and biocompatibility. The presence of amine groups on the polymeric chain possibly masks a great number of chemical modifications, especially Schiff’s reaction with aldehydes and ketones [13]. Chitosan can be modified by α-ketoglutaric acid and hydroxylamine hydrochloride to obtain chitosan functional polymer containing Schiff-base group, and these novel CTS derivatives would have stronger complexation ability and better adsorption characterization for metal ions because of the synergistic effect of high relative molecular mass.
Today, metal contamination of various water resources is great concern because of the toxic effect on the human beings and other animals and plants in the environment. Although Ca can be an essential trace element for the human beings, it can cause harmful, acute and even fatal effect when a large dosage is ingested. Recently, the ability of chitosan and its derivatives to chelate metal ions such as Cu2+, Pb2+, Hg2+, Cr2+, Mg2+, Ca2+, Zn2+, A13+ and Mn2+ has been studied widely, suggesting the possibility of using these polymers in the removal of metal ions in waste and natural water [14]. Most of these studies only investigated the possible uses of chitosan and its derivatives to remove heavy metals. Little work related to kinetic studies has been examined [2]. Particularly, few researches pay attention to kinetics of adsorption of calcium ion onto chitosan derivatives.
In this work, chitosan derivatives (KCTS and HKCTS) were used as calcium ion adsorbents, the equilibrium and kinetics of adsorption of Ca (Ⅱ) ions onto the chitosan derivatives were studied, and the isothermal sorption kinetics of chitosan derivatives for Ca (Ⅱ) ions was investigated. The adsorption rates were determined quantitatively and compared by the pseudo- first-order, and the second-order models.
2 Experimental
2.1 Materials
Chitosan (CTS, relative molecular mass: 4.9×10⁵, degree of deacetylation: 95%) was procured from Dalian Xindie Chitin Co., Ltd., China. The α-ketoglutaric acid was purchased from Qianshan Science and Technology Development Company, Zhuhai, China. The other chemicals used in this work were of analytical grade and deionized water was used to prepare the test solutions.
2.2 Preparation of chitosan α-ketoglutaric acid (KCTS)
Fig.1 shows a schematic representation of the preparation of KCTS and HKCTS.
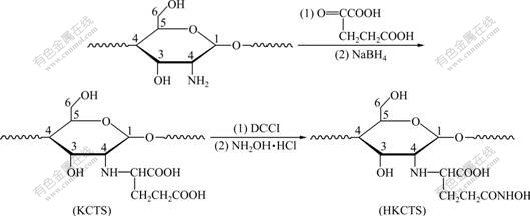
Fig.1 Reaction scheme for synthesis of KCTS and HKCTS
CTS (4.5 g) was dissolved in 100 mL of 1% acetic acid, and α-ketoglutaric acid (7.2 g) was added to the polymeric solution. The pH of the solution was adjusted to 4.5-5.0 using sodium hydroxide solution. Afterwards, sodium borohydride was added to the stirred mixture at 37 ℃. The pH of the polymeric solution was adjusted to 6.5-7.0 using hydrochloric acid and the reaction was further stirred for 24 h. At last, the reaction was terminated by 95% alcohol. The precipitated polymer was filtered, washed 3-4 times with ethanol and diethyl ether, respectively. The polymer was purified in Soxhlet with ethanol, and dried in an infrared drier.
2.3 Preparation of hydroxamated chitosan α- ketoglutaric acid (HKCTS)
KCTS (4.5 g) was swelling in water (100 mL). Subsequently, the pH of the polymeric solution was adjusted to 4.0-4.5 using hydrochloric acid solution (1.0 mol/L). Afterwards, dicyclohexylcarbodiimide (DCCI, 0.74 g) was added to the stirred mixture. 2 h later, hydroxylamine hydrochloride (4.5 g) was added and the reaction was further stirred for 1 h, then the pH of the reaction was adjusted to 6.0 using sodium hydroxide solution (1.0 mol/L), and the mixture was stirred for 2 h. Thereafter, the pH was raised again to 9.0, and the reaction mixture was stirred over 24 h at room temperature. The reaction was terminated by precipitation with concentrated HCl (12 mol/L, 20 mL) and acetone (200 mL). The precipitated polymer was filtered, washed 3-4 times with ethanol, followed by acetone and diethyl ether, respectively. The polymer was purified in Soxhlet with ethanol and acetone and dried at 60 ℃ for 4 h.
2.4 Characterization of adsorbents
The polymer samples were solubilized in CF3COOD/D2O (3%, mass fraction) and spectra of 13C NMR were obtained in 400 MHz with a Varian 300M Inova NMR spectroscopy instrument downfield from tetramethylsilane. X-ray diffraction patterns were obtained using a Japan Rigaku D/Max-2550VB+ 18KW X-ray diffractometer with graphite-monochromatized Cu Kα radiation (λ=0.154 178 nm)
2.5 Batch adsorption experiments
Batch adsorption experiments were conducted by placing 0.1 g of the chitosan derivatives in a 100 mL flask with 50 mL calcium chloride solution of a known initial concentration. The mixture in the flask was shaken at room temperature on an orbit shaker operated at 100 r/min for a period of up to 100 min or until adsorption equilibrium was established. The initial pH of the solutions was adjusted with NaOH to a desired value. The histories of Ca(Ⅱ) ions concentration in the solutions were determined spectrophotometrically by taking and analyzing solution samples periodically. The adsorbed amount of Ca(Ⅱ) ions per unit mass of chitosan derivatives at time t, Q(t) (mg/g) was calculated from the mass balance equation as:
 (1)
(1)
where C0 and Ct (mg/L) are the initial Ca(Ⅱ) ions concentration and Ca(Ⅱ) ions concentration at any time t, respectively; V is the volume of Ca(Ⅱ) ions solution; and m is the mass of the chitosan derivatives.
3 Results and discussion
3.1 Characterization of polymeric adsorbents
Fig.2 shows X-ray diffraction (XRD) patterns of CTS, KCTS and HKCTS. The wide-angle X-ray diffraction pattern of CTS showed the characteristic peaks at 2θ=10?, 20?. For KCTS the characteristic peaks at 2θ=10?, 20? decreased. For HKCTS the intensity of the characteristic peaks at 2θ=10?, 20? decreased more obviously than that of KCTS. It was thought that the decrease in crystallinity of KCTS could be attributed to the deformation of the strong hydrogen bond in the chitosan backbone chain, as the amino groups were substituted by α-ketoglutaric acid. In addition, the decrease in crystallinity of HKCTS because of the carboxyl groups in the KCTS reacted with hydroxylamine hydrochloride. Both KCTS and HKCTS had low crystallinity, indicating that they were considerably more amorphous than CTS [15] and pore size was improved.

Fig.2 XRD patterns of CTS (a), KCTS (b) and HKCTS (c)
More information about the chitosan derivatives was obtained by 13CNMR analysis. The 13CNMR spectra of CTS, KCTS and HKCTS are shown in Fig.3.
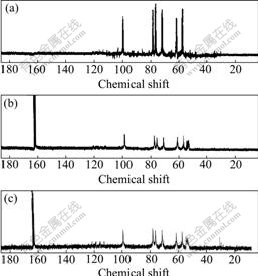
Fig.3 13CNMR spectra of CTS (a), KCTS (b) and HKCTS (c) (Solvent: CF3COOD/D2O)
The spectrum of CTS is the same as that reported by ZONG et al [16]. In comparison with CTS, in 13CNMR spectrum of KCTS, three signals at chemical shifts of 168.2, 53.8 and 39.7 were attributed to carbonyl carbons, methyne carbons and methylene carbons, respectively. This indicates that chitosan is successfully modified by α-ketoglutaric acid. In 13CNMR spectrum of HKCTS, three signals at 169.6, 54.1 and 40.6 were attributed to hydroxamic carbonyl carbons, methyne carbons and methylene carbons, respectively. Considering this NMR analysis, it is possible now to identify the chitosan derivatives obtained and to relate their structures to the preparation conditions.
3.2 Effect of pH on Ca(Ⅱ) ions adsorption
In this work, knowledge of pH is important because the pH of solution strongly affects the adsorption capacity of KCTS and HKCTS. The effect of pH on the adsorption of Ca(Ⅱ) ions onto chitosan derivatives is shown in Fig.4. This indicates that the adsorption capacity increases with increasing pH of the solution. The maximum adsorption of Ca(Ⅱ) ions on chitosan derivatives occurs at pH=9.5. This could be explained that at lower pH, more protons will available to protonate amine groups. While, at higher pH the adsorption of Ca(Ⅱ) ions increases as the inhibitory effect of H+ decreases with the increase in pH. But at pH higher than 11.3, Ca(Ⅱ) precipitation occurs simultaneously. Thus, pH 9.5 is chosen for the adsorption of Ca(Ⅱ) ions to avoid the formation of Ca(OH)2 that will affect the adsorption by the chitosan derivatives.

Fig.4 Effect of pH on adsorption of Ca(Ⅱ) ions
3.3 Effect of temperature on Ca(Ⅱ) ions adsorption
The influences of temperature on the adsorption capacity of KCTS and HKCTS are shown in Fig.5. It was carried out under the optimal conditions of pH 9.5 and an initial Ca(Ⅱ) ions concentration of 6 mg/L. Before the equilibrium time, the initial Ca(Ⅱ) ions adsorption rate (hi) increased with increasing temperature, which indicated a kinetically controlled process as shown in Table 1. This result may reflect an increase in the mobility of the large Ca(Ⅱ) ions with temperature and thus an increase in the number of molecules interacting with the active sites on the surface. After the equilibrium time, significant increase in the adsorbed amounts was not observed. The data show that the time necessary to reach equilibrium of sorption at different temperatures is 90-100 min. In general, an increase in temperature is followed by an increase in the diffusivity of the ion, and consequently by an increase in the sorption rate if diffusion is the rate controlling step.
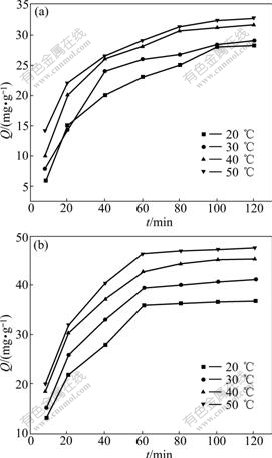
Fig.5 Adsorption rate of Ca(Ⅱ) ions on KCTS (a) and HKCTS (b) at different temperatures
3.4 Adsorption isotherms
Fig.6 shows the equilibrium adsorption data concerning the adsorption of Ca(Ⅱ) ions on KCTS and HKCTS at 20 ℃. The results clearly indicate that with an increase in equilibrium concentration of Ca(Ⅱ) ions, the adsorption capacity of both KCTS and HKCTS increased significantly. At lower initial Ca(Ⅱ) ions concentrations, the adsorption capacities increased linearly with the initial Ca(Ⅱ) ions concentrations, suggesting that the adsorption sites on the beads were sufficient and the amount of adsorption in these cases was dependent on the number of Ca(Ⅱ) ions that were transported from the bulk solution to the surfaces of polymers. At higher initial Ca(Ⅱ) ions concentrations, however, the adsorption capacities no longer increased proportionally with the initial Ca(Ⅱ) ions concentrations, indicating that the number of adsorption sites on the surfaces of the beads actually limited the adsorption capacities. It also shows that the adsorbing capacities for Ca(Ⅱ) ions on KCTS and HKCTS are significantly higher than those on CTS.

Fig.6 Adsorption capacities of Ca(Ⅱ) on CTS, KCTS and HKCTS for various initial Ca(Ⅱ) concentrations at 20 ℃
Adsorption isotherm is important to describe how solutes interact with adsorbent. The Langmuir and Freundlich models are frequently employed to describe the adsorption process. The Langmuir adsorption model is given as follows:
 (2)
(2)
where Q is the amount of Ca(Ⅱ) adsorbed per unit mass of the chitosan derivatives at equilibrium concentration,mg/g; C is the final concentration in the solution, mg/L; Q0 is the maximum adsorption at monolayer coverage, mg/g; and Ks is a constant of the Langmuir model, mg/L.
Freundlich adsorption isotherm model, which is an empirical equation used to describe heterogeneous adsorption systems, can be represented as follows:
 (3)
(3)
where K is a Freundlich constant representing the adsorption capacity, and n is a constant depicting the adsorption intensity (dimensionless).
We fit the adsorption isotherms in Fig.6 to Langmuir and Freundlich adsorption equations. The data are shown in Figs.7 and 8, respectively.
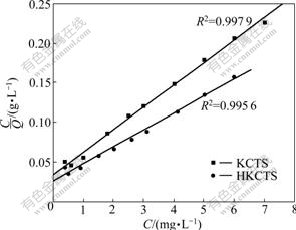
Fig.7 Langmuir adsorption isotherms
It is shown that Langmuir isotherm model isotherm is suitable for characterizing the experimental adsorption isotherms since all of the correlation coefficients are larger than 0.99. As known to us all, Langmuir isotherm is on the supposition that the surface of the adsorbent is a homogeneous surface, whereas Freundlich isotherm is applied to the adsorption process on a heterogeneous surface. Langmuir adsorption model is classically used for protein adsorption at an interface, surface, or membranes. The Langmuir model assumes that the adsorption can take place only at specific localized sites on the surface and that the saturation coverage corresponds to complete occupancy of these sites. From the experimental data, the adsorptions of Ca(Ⅱ) ions on KCTS and HKCTS correlated well (R2>0.99) with the Langmuir equation as compared to the Freundlich equation (R2<0.95) in the concentration range studied. From the slope and the intercept of the straight line, the values of Q0 and Ks can be estimated to be 35.285 8 mg/g and 1.195 8 mg/L for KCTS and 46.576 6 mg/g and 1.215 2 mg/L for HKCTS. The Langmuir equation is found to satisfactorily describe the adsorption isotherms.
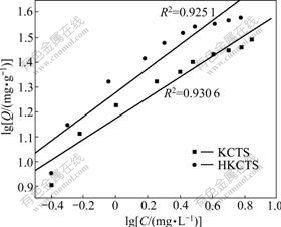
Fig.8 Freundlich adsorption isotherms
3.5 Kinetics of adsorption
In order to examine the controlling mechanism of the adsorption process, pseudo first-order and pseudo second-order equations were used to test the experimental data. A simple kinetic analysis of adsorption is the pseudo first-order rate expression of the Langergren equation [17-18]. In this equation the average value of the rate constant, k1, for adsorption of Ca(Ⅱ) onto chitosan derivatives can be calculated in the following equation:
 (4)
(4)
where Qe is the amounts of Ca(Ⅱ) adsorbed on adsorbent at equilibrium, mg/g; and k1 is the rate constant of first-order adsorption, min-1. The first-order kinetics only describes the sorption sites and does not describe the adsorption process as a whole. After definite integration by applying the initial conditions Qt=0 at t=0 and Q=Qt at t=t, Eq.(4) becomes
 (5)
(5)
A straight line of ln(Qe-Qt) versus t suggests the applicability of this kinetic model to fit the experimental data. The first-order rate constant k1 and equilibrium adsorption density Qe were calculated from the slope and intercept of this line.
The k1 values and equilibrium adsorption density Qe at four different temperatures were calculated from these plots (Fig.9) and are listed in Table 1. A comparison of results with the correlation coefficient (R2) is shown in Table 1. The correlation coefficients for the pseudo first-order kinetic model are all above 0.89. However, a large equilibrium adsorption density (Qe) difference between the experiment and calculation was observed, indicating a poor pseudo first-order fit to the experimental data.
Table 1 Comparison of the first- and second-order adsorption rate constants and calculated and experimental Qe values at different temperatures
![]()
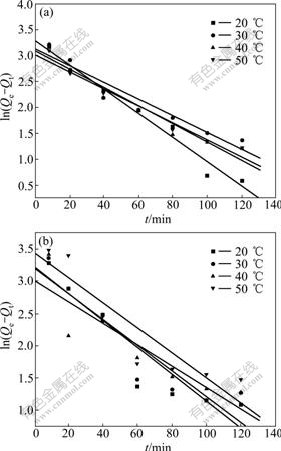
Fig.9 Plots of pseudo first-order equation of KCTS (a) and HKCTS (b) at different temperatures
The pseudo second-order kinetic model [17-18] is based on adsorption equilibrium capacity and can be expressed as:
 (6)
(6)
where k2 is the rate constant for pseudo second-order adsorption, g/(mg?min). Integrating Eq.(6) and applying the initial conditions, we have
 (7)
(7)
or equivalently,
 (8)
(8)
and
 (9)
(9)
where hi is the initial adsorption rate [7], mg/(g?min). The slope and intercept of (t/Qe) versus t were used to calculate the pseudo second-order rate constant k2 and Qe. It is likely that the behaviour over the whole range of adsorption is in agreement with the chemisorption mechanism being the rate-controlling step [19]. From Table 1, the adsorption of Ca(Ⅱ) by KCTS and HKCTS is considered to be pseudo second-order with high correlation coefficients above 0.99 as shown in Fig.10. In addition, Qe, which is the adsorption capacity, agreed very well with both experiment and calculation as listed in Table 1. These suggested that the pseudo second-order adsorption mechanism is predominant and that the overall rate of Ca(Ⅱ) adsorption process is most likely to be controlled by the chemisorption process [19].
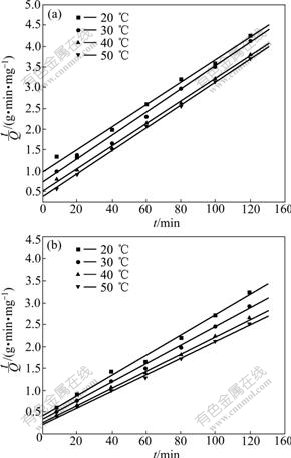
Fig.10 Plots of pseudo second-order equation of KCTS (a) and HKCTS (b) at different temperatures
3.6 Activation parameters
The rate constants k2 at different temperatures listed in Table 1 were then applied to estimating the activation energy of the adsorption of Ca(Ⅱ) onto KCTS and HKCTS by the Arrhenius equation [20-21]:
 (10)
(10)
where Ea, R and A refer to the Arrhenius activation energy, the gas constant and the Arrhenius factor, respectively. To extract A and Ea from kinetic data, we plot the series of rate constants measured at different temperatures in a graph of ln k versus 1/T. As shown in Fig.11, the corresponding activation energy was determined from the slope of linear plot. The values of Ea from the slope of the plot are 26.22 and 6.16 kJ/mol, respectively. The Ea obtained is very low, and thus the sorption of Ca(Ⅱ) by chitosan derivatives may involve not only an activated process but a physical sorption. At the same time, small values of Ea with 26.22 and 6.16 kJ/mol indicate that the sorption process is controlled by the chemical process.
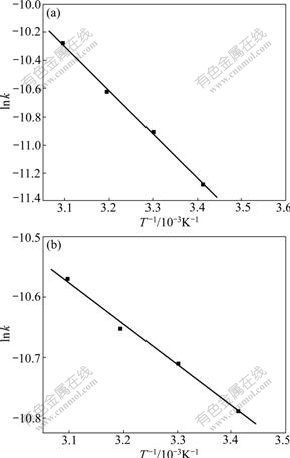
Fig.11 Arrhenius plots for adsorption of Ca(Ⅱ) on KCTS (a) and HKCTS (b)
4 Conclusions
(1) The equilibrium and the dynamics of the adsorption of Ca(Ⅱ) on KCTS and HKCTS are investigated, and the novel chitosan derivatives show a high adsorption capacity.
(2) Adsorption data are modeled by using the Freundlich and Langmuir adsorption isotherms. A high correlation coefficient (R2>0.99) with Langmuir adsorption isotherms is obtained. Initially, the rate of adsorption of Ca(Ⅱ) onto chitosan derivatives is very fast. This is then followed by a slower rate, and gradually approaches a plateau. Before equilibrium reaches, an increase in temperature leads to an increase in the Ca(Ⅱ) adsorption rate, which indicates a kinetically controlled process.
(3) A pseudo second-order kinetic model agrees well with the dynamical behavior for the adsorption of Ca(Ⅱ) on chitosan derivatives, consistent with chemical adsorption being the rate-limiting step but not the mass transport. It is predicted that these chitosan derivatives will have wide ranging applications in environmental and analytical areas and in the separation and pre- concentration of metal ions.
References
[1] RAVI KUMAR M N V. A review of chitin and chitosan applications [J]. React Funct Pol, 2000, 46: 1-27.
[2] SAG Y, AYTAY Y. Kinetic studies on sorption of Cr(Ⅵ) and Cu(Ⅱ) ions by chitin, chitosan and rhizopus arrhizus: Biochem [J]. Eng J, 2002, 12: 143-153.
[3] NGAH W S W, GHANI S A, HOON L L. Comparative adsorption of lead (II) on flake and bead-types of chitosan [J]. J Chin Chem Soc, 2002, 49: 625-628.
[4] GUIBAL E, MILOT C, TOBIN J M. Metal-anion sorption by chitosan beads: Equilibrium and kinetic studies [J]. Ind Eng Chem Res, 1998, 37: 1454-1463.
[5] GUIBAL E, MILOT C, ETERRADOSSI O, GAUFFIER C, DOMARD A. Study of molybdate ion sorption on chitosan gel beads by different spectrometric analyses [J]. Int J Biol Macromol, 1999, 24: 49-59.
[6] WU F C, TSENG R L, JUANG R S. Enhanced abilities of highly swollen chitosan beads for color removal and tyrosinase immobilization [J]. J Hazard Mater, 2000, 73: 63-75.
[7] CHIOU M S, LI H Y. Adsorption behavior of reactive dye in aqueous solution on chemical cross-linked chitosan beads [J]. Chemosphere, 2003, 50: 1095-1105.
[8] ZENG X F, RUCKENSTEIN E. Cross-linked macroporous chitosan anion-exchange membranes for protein separations [J]. J Membr Sci, 1998, 148: 195-205.
[9] NGAH W S W, MUSA A. Adsorption of humic acid onto chitin and chitosan [J]. J Appl Polym Sci, 1998, 69: 2305-2310
[10] ZHANG X, BAI R B. Mechanisms and kinetics of humic acid adsorption onto chitosan-coated granules [J]. Colloid Interface Sci, 2003, 264: 30-38.
[11] CHEN Xiao-qing, YU Hong-zhu, CAO Zuo-ying. Chemical modification of β-cyclodextrin chitosan and its adsorption on phenol, n-nonylphenol and resorcinol [J]. Journal of Central South University: Science and Technology, 2007, 37(1): 112-115. (in Chinese)
[12] YANG Zhi-kuan, YUAN Yang. Studies on the synthesis and properties of hydroxyl azacrown ether-grafted chitosan [J]. J Appl Polym Sci, 2001, 82: 1838-1843.
[13] XIA Jin-lan, LIAO Peng-fei, NIE Zhen-yuan, WANG Jing, XIAO Shui-ming. Preparation and characterization of magnetic carboxymethylated chitosan Fe3O4 nanocomposites [J]. Journal of Central South University: Science and Technology, 2006, 37(6): 1075-1080. (in Chinese)
[14] LIGIA F, VALFREDO T, FBVERE D E, MAURO C M L. Adsorption of calcium ions by graft copolymer of acrylic acid on biopolymer chitin [J]. Polymer, 1996, 37: 843-846.
[15] ZHANG Xue-yong, DING Shi-min, WANG Yu-ting, FENG Xiang-hua, PENG Qi, MA Shu-lan. Synthesis and adsorption properties of metal ions of novel azacrown ether crosslinked chitosan [J]. J Appl Polym Sci, 2006, 101(5): 2705-2709.
[16] ZONG Z, KIMURA Y, TAKAHASHI M, YAMANE H. Characterization of chemical and solid state structures of acylated chitosans [J]. Polymer, 2000, 41: 899-906.
[17] HO Y S, MCKAY G. Sorption of dye from aqueous solution by peat [J]. J Chem Eng, 1998, 70(2): 115-124.
[18] HO Y S, MCKAY G. The kinetics of sorption of divalent metal ions onto sphagnum moss peat [J]. Water Res, 2000, 34: 735-742.
[19] CHIOU M S, HO P Y, LI H Y. Adsorption of anionic dyes in acid solutions using chemically cross-linked chitosan beads [J]. Dyes and Pigments, 2004, 60: 69-84.
[20] DOGAN M, ALKAN M. Adsorption kinetics of methyl violet onto perlite [J]. Chemosphere, 2003, 50: 517-528.
[21] MONTRA C, SAOWANEE R, JOHN B B, VICHITR R. An adsorption and kinetic study of lac dyeing on silk [J]. Dyes and Pigments, 2005, 64: 231-241.
Foundation item: Project(20376085) supported by the National Natural Science Foundation of China
Received date: 2009-05-27; Accepted date: 2009-08-06
Corresponding author: DING Ping, PhD; Tel: +86-731-84805462; E-mail: psxf06@yahoo.com.cn
(Edited by YANG You-ping)

