���ղ������������ܽ��Ӱ�켰�Ż�
��Դ�ڿ����й���ɫ����ѧ��(Ӣ�İ�)2020���12��
�������ߣ�����Ԩ ����� ��ï �̱��� ��Դ
����ҳ�룺3390 - 3403
�ؼ��ʣ������ۣ��������ܽ⣻��Ӧ���淨������Ⱥ����������ȴ���
Key words��aluminum reduction cell; alumina dissolution; response surface methodology; desirability approach; heat and mass transfer
ժ Ҫ������Box-Behnken��ƺ�����Ⱥ������о����Ż����������ܽ��йص������ղ�����ѡ�������¶ȡ��������������������������¶���ΪӰ������������������ۻ��ܽ⺬��(CCDA)�����ƫ��Ŀ�꺬��(RDTC)��Ϊ��Ӧֵ������Ӱ���о�������������ӵ�����¶Ⱥ��������¶ȣ��Լ����������������������CCDA����ߵ�����¶Ⱥͽ��͵����������������ֲ����Ӿ��ȡ����ŵĹ�������Ϊ��������¶�958.8 ��C������������2.679%(��������)������300 kA�Լ��������¶�200 ��C��
Abstract: The Box�CBehnken design and desirability approach were used to investigate and optimize the process parameters for aluminum reduction cells related to alumina dissolution. The bath temperature, alumina content, current and alumina temperature were chosen as the design parameters. The content of cumulative dissolved alumina (CCDA) and the relative deviation from the target content (RDTC) were adopted as the responses. The interactive influence results show that increasing the bath temperature and alumina temperature, as well as decreasing the alumina content, can increase CCDA. Increasing the bath temperature and lowering the current are beneficial for obtaining a more uniform alumina distribution. The optimal operating parameters were determined to be as follows: bath temperature of 958.8 ��C, alumina content of 2.679 wt.%, current of 300 kA and alumina temperature of 200 ��C.
Trans. Nonferrous Met. Soc. China 30(2020) 3390-3403
Wen-yuan HOU, He-song LI, Mao LI, Ben-jun CHENG, Yuan FENG
School of Energy Science and Engineering, Central South University, Changsha 410083, China
Received 12 February 2020; accepted 27 September 2020
Abstract: The Box�CBehnken design and desirability approach were used to investigate and optimize the process parameters for aluminum reduction cells related to alumina dissolution. The bath temperature, alumina content, current and alumina temperature were chosen as the design parameters. The content of cumulative dissolved alumina (CCDA) and the relative deviation from the target content (RDTC) were adopted as the responses. The interactive influence results show that increasing the bath temperature and alumina temperature, as well as decreasing the alumina content, can increase CCDA. Increasing the bath temperature and lowering the current are beneficial for obtaining a more uniform alumina distribution. The optimal operating parameters were determined to be as follows: bath temperature of 958.8 ��C, alumina content of 2.679 wt.%, current of 300 kA and alumina temperature of 200 ��C.
Key words: aluminum reduction cell; alumina dissolution; response surface methodology; desirability approach; heat and mass transfer
1 Introduction
The Hall-H��roult process is the major industrial process used for smelting primary aluminum from alumina [1,2]. It involves dissolving alumina in the cryolite-based molten bath with complex heat and mass transfer, electrolyzing the molten salt bath, and driving the bath by anodic gases and electromagnetic forces, etc. Among these steps, alumina dissolution is the key process because the dissolution rate and the distribution uniformity of the alumina directly affect the stability of the electrolytic process. A lower alumina concentration in the anode-cathode distance (ACD) can lead to an anode effect, resulting in a significant increase in cell voltage and increase in greenhouse gas emissions (CF4, C2F6, etc). In addition, the low and locally non-uniform alumina concentration can cause spikes and other deformations on the bottom of the anodes [3-5]. Conversely, a higher alumina concentration can slow down the alumina dissolution rate, and the undissolved alumina can easily form sludge that is difficult to dissolve and erosive to the cathode. Therefore, the alumina concentration should be maintained in a certain range and evenly distributed.
To accelerate the dissolution and diffusion of the alumina particles, many researchers have experimentally or numerically studied the dissolution process of alumina and established some models to describe the process. WALKER [6] and KUSCHEL and WELCH [7,8] studied the effect of the physical properties of alumina and operating conditions on alumina dissolution, as well as the alumina behavior after addition to cryolite-based electrolytes. JAIN et al [9] and HAVERKAMP and WELCH [10] found that the dissolution time increased with increasing alumina concentration in the bath, which proves that a low alumina concentration is beneficial to the dissolution of alumina particles. Based on this phenomenon, WAI-POI et al [11] and VERHAEGHE et al [12,13] believed that the alumina concentration gradient is the driving force for alumina dissolution, and proposed a mass transfer model. KUSCHEL and WELCH [8], and YANG et al [14] found experimentally that a low superheat has a large impact on reducing the dissolution rate. Some researchers thought that superheat is the driving force for alumina dissolution and proposed a heat transfer model [15,16].
Due to the high temperature and corrosion characteristics of the bath and the inability to directly observe dissolution and diffusion behavior for alumina in industrial cells, computational fluid dynamics (CFD) has become an important means to study the dissolution behavior. FENG et al [17,18] studied the effect of the side channel width and the ACD on the alumina dissolution distribution, finding that reducing the ACD or reducing the side channel width results in greater extremes for the alumina concentration. ZHAN et al [19] and ZHANG et al [20,21] simulated the alumina-mixing process and concluded that anode bubbles are the main driving forces for alumina dissolution, while electromagnetic forces (EMFs) promote the diffusion of alumina. LIU et al [3] obtained the distribution characteristics of alumina particles in aluminum reduction cells using a VOF-DPM model. HOU et al [22,23] established mathematical models to describe the alumina particle dissolution process with heat and mass transfer, as well as the uniformity of the alumina distribution. The temperature response during alumina dissolution was first simulated.
In an industrial electrolytic cell, there are many factors that affect the dissolution and distribution of alumina. Some parameters can be controlled by the on-site process, including the bath temperature, alumina content, current and alumina temperature, etc. The above investigations are mainly based on a single factor, while alumina dissolution shows characteristics of multivariable nonlinear and strong coupling. LIANG et al [24] proposed a three-factor optimization control technology, which has been promoted in the BALCO Aluminum Plant, achieving significant results. The optimized parameters are bath temperature, liquidus temperature and superheat. In fact, the fundamental reason for the change in the liquidus temperature is a change in the bath composition, such as alumina content. The superheat is the difference between bath temperature and liquidus temperature. Therefore, it is necessary to carry out studies on the effects of basic controllable parameters on the alumina dissolution and distribution, which can provide theoretical guidelines for optimization design and process control for aluminum reduction cells to achieve better results.
Response surface methodology (RSM) is widely used to explore the interactive effects among different parameters, and desirability approach is employed for multi-objective optimization [25-29]. In this work, CFD was used to simulate the alumina dissolution and distribution based on our previous work [22,23]. A four-factor three-level Box-Behnken design and desirability function were used to explore and optimize the process parameters for an aluminum reduction cell. The major controllable parameters include bath temperature, alumina content, current and alumina temperature. The content of cumulative dissolved alumina (CCDA) and relative deviation from target content (RDTC) were adopted as responses. The parametric influence on the responses was analyzed using 2D contour plot and 3D response surface. The optimal parameters for the aluminum reduction cell were achieved to acquire maximal CCDA, minimal RDTC and superheat within a certain range.
2 Mathematical model
2.1 Physical model
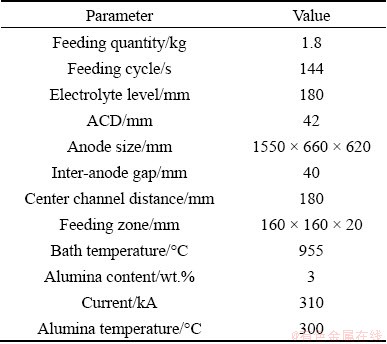
In this study, the dissolution process of alumina was simulated in a half of 300 kA aluminum electrolytic cell (Fig. 1) under the action of anodic bubbles [22]. The half-cell size is 3840 mm �� 7400 mm �� 180 mm. The specific cell parameters are given in Table 1. The alumina was fed into the feeding point.
2.2 Numerical method
An Euler-Lagrange approach was used to simulate the alumina dissolution, in which alumina particles were treated as a discrete phase and the bath was treated as a continuum phase. Dissolved alumina was treated as a species in the bath.
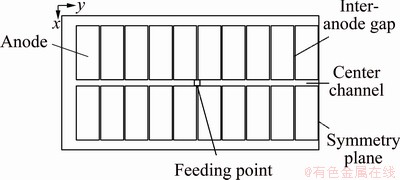
Fig. 1 Geometry model of a half of aluminum reduction cell
Table 1 Initial physical parameters for aluminum reduction cell
2.2.1 Liquid phase
The dissolution of alumina results in a decrease in bath temperature and an increase in alumina content, all of which have an effect on the dissolution rate of alumina. Therefore, the governing equations include the continuity equation, momentum equation, energy equation, and species transport equation. These equations can be expressed in the following general form:
 (1)
(1)
where �� is the time, ��L is the bath density, uL is the velocity of the bath, �� is the general dependent variable, ���� is the effective diffusion coefficient and S�� is the source term. The specific forms for the variables are listed in Table 2.
Table 2 General forms of governing equations
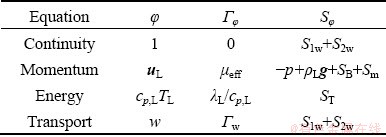
In Table 2, ��eff is the effective viscosity (the sum of the molecular viscosity, turbulent viscosity and bubble-induced turbulence viscosity), p is the pressure, SB is the bubble-bath interaction force, Sm is the particle-bath momentum exchange term, cp,L is the specific heat capacity of the bath, TL is the temperature of the bath, ��L is the thermal conductivity of the bath, ST is the heat source term containing heating alumina and enthalpy change, w is the alumina content, and ��w is the effective diffusion coefficient. S1w is the alumina dissolution rate and S2w is the alumina consumption rate under the anode bottom [22]:
 (2)
(2)
where I, M and F are the current, molar mass of alumina and Faraday constant, respectively; V is the volume between the anode bottom surface and the liquid aluminum interface in the anode-cathode distance. The larger the current, the larger the consumption rate of alumina.
2.2.2 Particle phase
The particle trajectories of alumina were solved by Lagrangian approach. The governing equation can be expressed as follows:
 (3)
(3)
FD is the drag force and described as [30,31]
 (4)
(4)
where CD is the drag coefficient related to the Reynolds number of alumina particles Rep, and AP is the cross-sectional area.
 (5)
(5)
2.2.3 Dissolution model
The dissolution of alumina particles is controlled by both heat and mass transfer mechanism [32]. Shrinking sphere models for alumina particles under two mechanisms were established in our previous work [22]. The alumina dissolution rate is the slowest under the two mechanisms of heat and mass transfer, because the slowest rate is the rate-controlling step.
The shrinking sphere model under the mass transfer mechanism can be expressed as follows:
 (6)
(6)
The shrinking sphere model under the heat transfer mechanism can be expressed as follows:
 (7)
(7)
where k is the mass transfer coefficient; h is the convection heat transfer coefficient; CAl is the specific heat capacity of alumina; ��Hdiss is the heat of dissolution for alumina; rS is the density of the alumina particle; wsat is the saturation content of alumina; TAlO is the temperature of the alumina particle; Tliq is the liquidus temperature of the bath [22,23].
2.2.4 Superheat
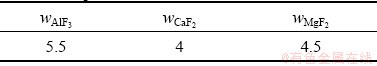
The superheat is the difference between the bath temperature TL and liquidus temperature Tliq. The liquidus temperature is closely related to the component content of the bath. The main component of the bath is cryolite, with a small amount of other components including AlF3, Al2O3, MgF2 and CaF2. The empirical formula for calculating the liquidus temperature was obtained by ZHANG et al [33]. The formula is expressed as Eq. (8) and the component contents in the bath are listed in Table 3. The larger the alumina content, the larger the superheat.


 (8)
(8)
where wAlF3, wCaF2 and wMgF2 are the contents of AlF3, CaF2 and MgF2, respectively.
Table 3 Component contents in bath (wt.%)
2.2.5 Numerical details
Based on the OpenFOAM software platform, an alumina dissolution solution module was developed to solve the established equations and to obtain the alumina distribution and bath temperature, etc. The PIMPLE algorithm was used in the simulation to couple the velocity and pressure. The first-order implicit Euler scheme was chosen for time discretization. The space discretizations were central differences for the diffusion terms and second-order upwind for the convection terms, respectively. The time step was set to be 0.001 s. The residuals for the transport and energy equations were set to be 1��10-8, while the residuals for the other equations were set to be 1��10-6.
2.2.6 Model validation
To verify the accuracy of the simulation, the simulation results were compared with the experimental results [34], as shown in Fig. 2. CCDA was selected to validate the numerical methods and results. It can be seen that the simulation shows good agreement with the experimental results, indicating that the model established can be used to predict alumina dissolution.
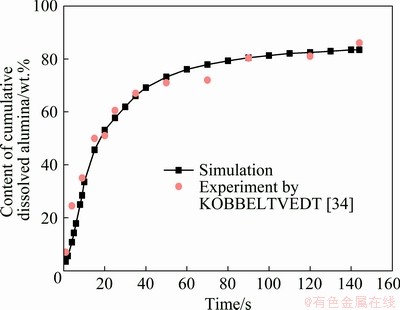
Fig. 2 Validation of numerical model
3 Box�CBehnken design and desirability approach
It can be seen from Eqs. (6) and (7) that the alumina dissolution rate is related to the alumina content, bath temperature and temperature of the alumina particles. From Eq. (2), the alumina consumption rate is related to the current. Therefore, there are four important factors (bath temperature, alumina content, current and alumina temperature) related to the alumina dissolution and alumina distribution, which are selected as the independent variables. CCDA reflects the alumina dissolution rate and RDTC reflects the uniformity of the alumina distribution. They are evaluation indices for the dissolution of alumina [22]. Thus, CCDA and RDTC were adopted as responses.
There are several experimental designs for response surface methodology that can be chosen depending on the number of design factors, such as Box�CBehnken design (BBD), and central composite design (CCD). In this work, BBD is employed to generate an experimental matrix in order to reduce the number of experiments and simulation time. A mathematical model generated by BBD defines the relationships between the independent variables and the responses. In this study, a modified two-factor interaction model is used to describe the interactive effect among the four factors on CCDA and is given as follows:
 (9)
(9)
A modified quadratic regression is used to describe the interactive effect among the four factors on RDTC, which is given as follows:
 (10)
(10)
where Y is the response of the experiment, Xi and Xj are independent variables, n is the number of variables, ��0, ��i, ��ii and ��ij (i =0, 1, 2, ��, n; j=0, 1, 2, ��, n) are the regression coefficients for the intercept, linear, quadratic and interaction terms, respectively, and �� is the statistical error.
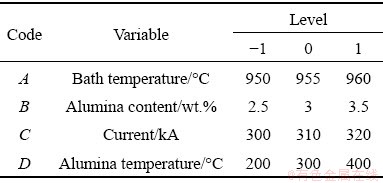
The factors for the four variables are coded by A, B, C and D and the levels vary from -1 to 1. The four variables and their levels are listed in Table 4. The range of parameters is obtained according to the control parameters of an aluminum reduction cell in Chongqing (China).
The desirability approach is an effective method to realize multi-objective optimization. In the desirability objective function O(X), each response Yi is converted to a dimensionless desirability value ranging from 0 to 1 (least to most desirable, respectively). If any of the responses or factors falls outside their desirability range, the overall function becomes zero. Importance (ri) varies from the least important (+), a value of 1, to the most important (+++++), a value of 5. The objective function is a function related to desirability and importance, which can be expressed as follows:
 (11)
(11)
where n�� is the number of responses.
Table 4 Ranges and levels of independent variables in BBD
For the goal of maximum, the desirability is defined by the following formulas:
 (12)
(12)
For the goal of minimum, the desirability is defined by the following formulas:
 (13)
(13)
For the goal within range, the desirability will be defined by the following equation:
 (14)
(14)
where wi is the weight ranging from 0.1 to 10. Weights greater than 1 give more emphasis to the goal, while weights less than 1 give less emphasis to the goal. Ylow,i and Yupper,i represent the lower and upper limits of the response Yi, respectively.
4 Results and discussion
Table 5 Box�CBehnken design arrangement and simulation results
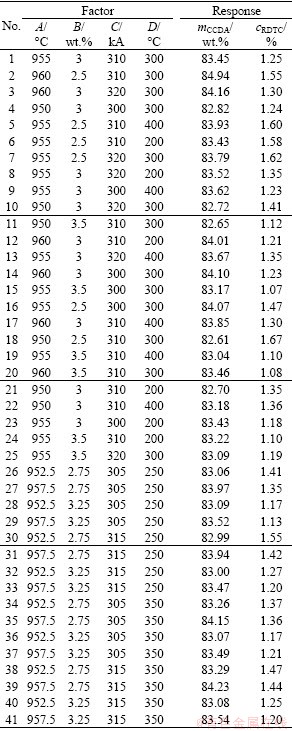
The experimental matrix is obtained according to the Box�CBehnken design and the responses are presented in Table 5. The values for CCDA and RDTC are obtained by numerical post-processing and their formulas are expressed as follows:
mCCDA=md/mf��100% (15)
 (16)
(16)
where md and mf are the dissolved mass and the feeding quantity of alumina, respectively. c is the alumina content of each node. ct is the initial concentration, which is selected as the target content. n�� is the number of cells.
4.1 Analysis of variance (ANOVA)
ANOVA is always used for descriptive statistics and statistical tests. In ANOVA, the significance and accuracy of the regression model will be discussed using the mean square value, F-value, p-value, Adeq precision, R2, Pred R2 and Adj R2.
Table 6 presents the results obtained from the analysis of variance test for CCDA. The Pred R2 value of 0.9188 is in reasonable agreement with the Adj R2 value of 0.9520 because the difference between them is less than 0.2. The Adeq precision measures the signal-to-noise ratio, with a ratio larger than 4 being desirable. The obtained ratio of 39.449 indicates an adequate signal. As given in Table 6, the regression model shows a large value for the goodness-of-fit (R2=0.9640). The p-value is less than 0.05, which means that the model terms are significant. Therefore, the regression model has high accuracy for predicting CCDA. In addition, the main effects of bath temperature (A), alumina content (B) and alumina temperature (D), as well as the interaction effects of AC, AD and BD are statistically significant for CCDA.
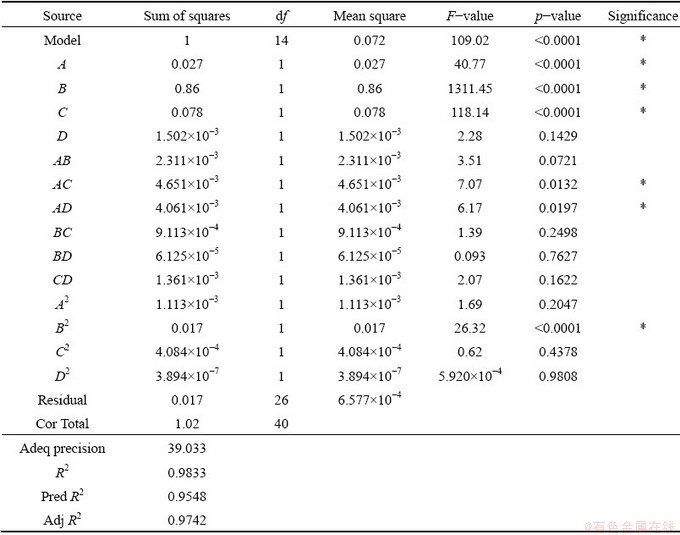
Table 7 presents the results obtained from the analysis of variance test for RDTC. The difference between the Pred R2 and Adj R2 values is 0.0194, which indicates an acceptable agreement. The Adeq precision value of 39.033 indicates an adequate signal. The R2 value of 0.9833 indicates that the regression model has a large value for the goodness-of-fit. As the p-value is less than 0.05, the regression model has high accuracy for predicting RDTC. Moreover, A, B, C, AC, AD and B2 are significant model terms.
Table 6 Analysis of variance test results for CCDA
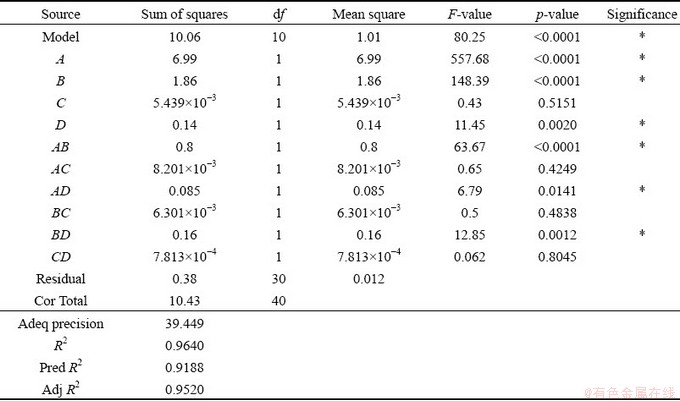
Table 7 Analysis of variance test results for RDTC
4.2 Regression models for responses
The regression models for CCDA and RDTC within the limits of the factors are obtained as follows:
mCCDA=-328.71639+0.43879A+150.80313B-0.80044C+0.25710D-0.1598AB+
8.1��10-4AC-2.61��10-4AD+7.1��10-3BC-3.59��10-3BD+1.25��10-5CD (17)
cRDTC=369.71986-0.93251A-9.18767B+0.65519C-0.049449D+8.6��10-3AB-
6.1��10-4AC+5.7��10-5AD-2.7��10-3BC+7��10-5BD-1.65��10-5CD+5.60484��10-4A2+
0.22105B2-8.4879��10-5C2+2.62097��10-8D2 (18)
Figure 3 shows the comparison of the predicted results and simulation results. It can be seen that the predicted values lie close to a straight line, and the deviations between the numerical values and the predicted values for CCDA and RDTC are within ��0.3% and ��3.5%, respectively. This indicates that the regression model is effective and has good prediction performance. Thus, these two regression models can be used to predict CCDA and RDTC within the limits of the factors.
4.3 Interactive effect of parameters on CCDA
4.3.1 Effects of bath temperature and alumina content
Figure 4 presents the 3D response surface and 2D contour plot for the interactive effect of the bath temperature and alumina content on CCDA for current of 310 kA and alumina temperature of 300 ��C. It can be seen that the alumina content has little effect on CCDA at lower bath temperature. As the bath temperature rises, CCDA increases with decreasing the alumina content. It can also be seen that the gradient of CCDA with bath temperature at high alumina content is smaller than that at low alumina content. The maximal CCDA can be achieved by increasing the bath temperature and decreasing the alumina content.
4.3.2 Effects of bath temperature and alumina temperature
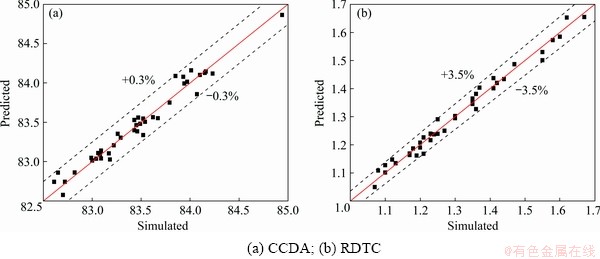
Fig. 3 Comparison of predicted results and simulation results
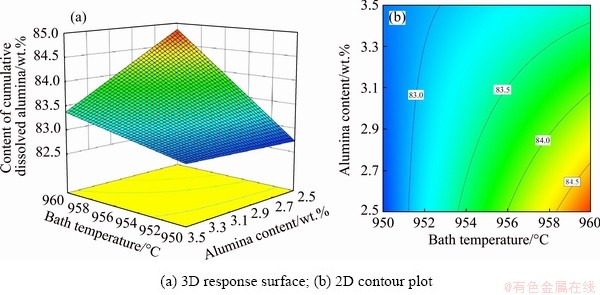
Fig. 4 Effects of bath temperature and alumina content on CCDA
The influence of bath temperature and alumina temperature on CCDA for alumina content of 3 wt.% and current of 310 kA is visualized by 3D response surface and 2D contour plot, as shown in Fig. 5. It can be seen that the bath temperature has a greater impact than that of the alumina temperature because the gradient of CCDA is larger along the bath temperature direction. CCDA increases with bath temperature and alumina temperature. An increment in bath temperature indicates an increase in superheat, thus accelerating the alumina dissolution to increase CCDA. When the bath temperature is higher, the effect of the alumina temperature on CCDA is negligible. However, when the bath temperature is lower, the higher the alumina temperature, the larger the CCDA. Therefore, when the bath temperature is high enough, the alumina temperature can be disregarded.
4.3.3 Effects of alumina content and alumina temperature
The influence of alumina content and alumina temperature on CCDA for bath temperature of 955 ��C and current of 310 kA is visualized in Fig. 6. As the alumina content goes up, CCDA decreases. For large alumina content, CCDA remains relatively constant. When the bath temperature and current are fixed, reducing the alumina content and increasing the alumina temperature can increase CCDA.
In conclusion, selecting appropriate parameters can effectively improve CCDA. Among the various process parameters, bath temperature and alumina content have larger contribution ratios towards CCDA. According to the 3D response surface and 2D contour plot, low alumina content, high bath temperature and high alumina temperature are beneficial for increasing CCDA.
4.4 Interactive effect of process parameters on RDTC
4.4.1 Effects of bath temperature and current
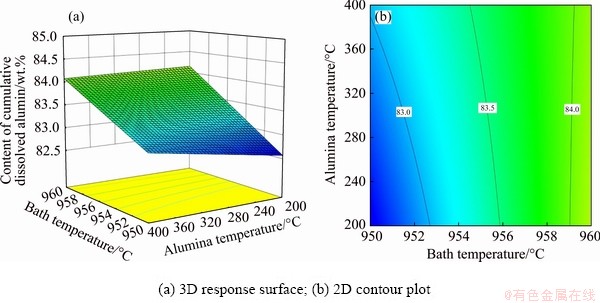
Fig. 5 Effects of bath temperature and alumina temperature on CCDA
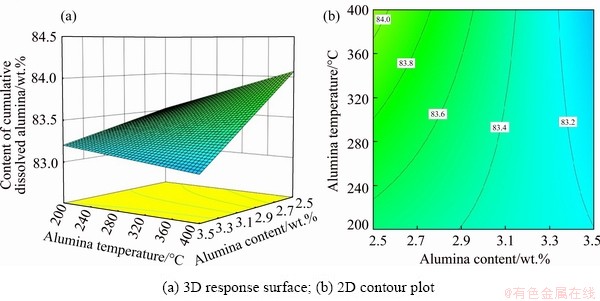
Fig. 6 Effects of alumina content and alumina temperature on CCDA
Fixing alumina content of 3 wt.% and alumina temperature of 300 ��C, the influence of the bath temperature and current on RDTC is presented in Fig. 7. The closer the value of RDTC is to 0, the more uniform the alumina distribution is. It is clear that an increase in current will increase RDTC, which means that the uniformity of the alumina distribution becomes worse. When the current is 300 kA, RDTC is the smallest. When the current is low, the bath temperature has little effect on the uniformity of the alumina distribution.
4.4.2 Effects of bath temperature and alumina temperature
The influence of bath temperature and alumina temperature on RDTC for alumina content of 3 wt.% and current of 310 kA is visualized in Fig. 8. When the bath temperature is low, RDTC decreases with increasing the alumina temperature; while when the bath temperature is high, RDTC increases with increasing the alumina temperature. For a low alumina temperature, the RDTC changes significantly with bath temperature, and a higher bath temperature makes the alumina distribution more uniform.
In one word, one needs to select the appropriate parameter to decrease RDTC to guarantee the uniformity of the alumina distribution. Among the various process parameters, bath temperature and current have larger contribution ratios towards RDTC. According to the 3D response surface and 2D contour plot, a high bath temperature and low current are beneficial for decreasing RDTC.
4.5 Multi-objective optimization
To determine the optimized process parameters for the aluminum reduction cell, the desirability approach is used to carry out the multi-objective optimization. The bath temperature, alumina content, current and alumina temperature vary in the designed range. The CCDA should be as large as possible; at the same time, the RDTC should be as small as possible. To ensure normal operation for the reduction cell, it is necessary to ensure superheat at 8-15 ��C. All variables and objectives are set to the same importance of 3 and same weight of 1. The optimization criteria used for the process parameters for the aluminum reduction cell are listed in Table 8.
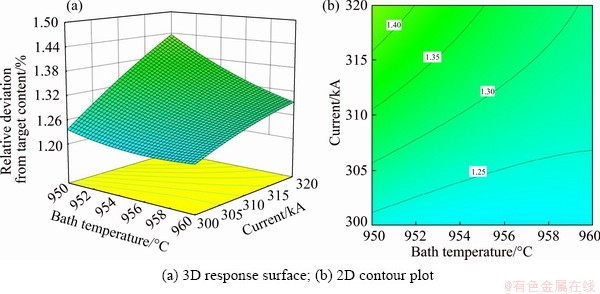
Fig. 7 Effects of bath temperature and current intensity on RDTC
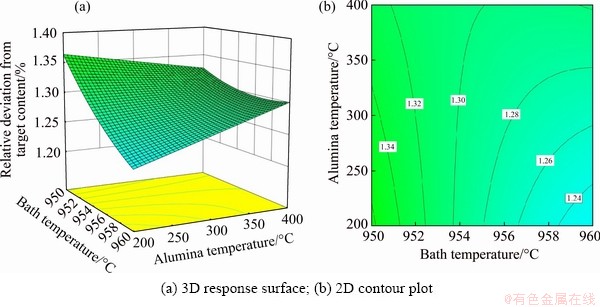
Fig. 8 Effects of bath temperature and alumina temperature on RDTC
The optimal parameters are determined to be as follows: bath temperature of 958.8 ��C, alumina content of 2.679 wt.%, current of 300 kA and alumina temperature of 200 ��C. From the viewpoint of increasing the cumulative dissolved alumina and alumina distribution uniformity, it is not necessary to increase the current and the alumina temperature. The obtained optimal parameters can be used to guide the control of the process parameters in an aluminum reduction cell.
4.6 Distribution characteristic between optimal conditions and initial conditions
The alumina content and bath temperature are compared between the initial conditions and the optimal conditions, as shown in Fig. 9 and Fig. 10.
Table 8 Optimization criteria for process parameters for aluminum electrolytic cell
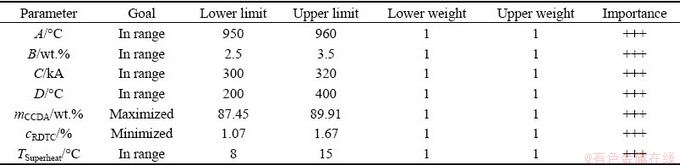
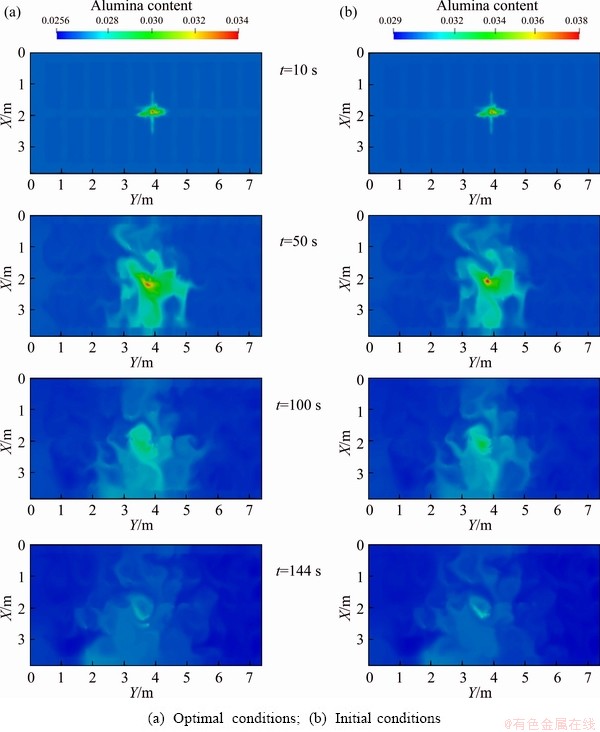
Fig. 9 Comparison of alumina distribution characteristics at different times
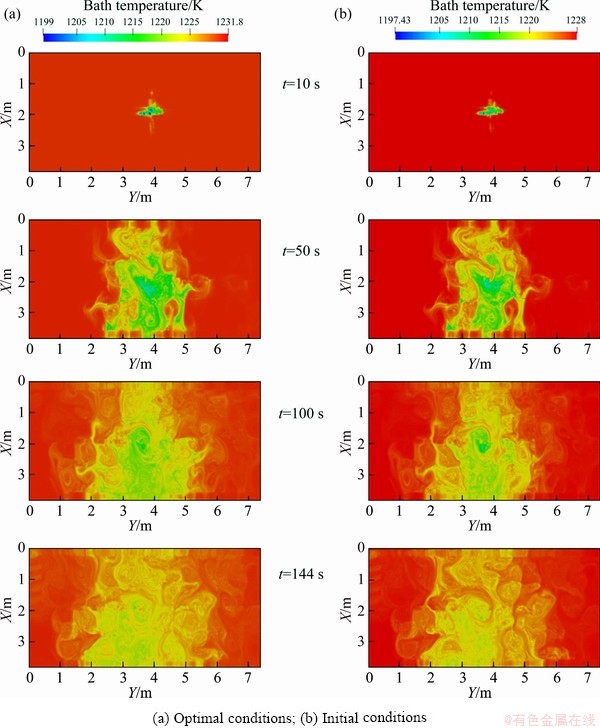
Fig. 10 Comparison of bath temperature distribution characteristics at different times
It can be seen from Fig. 9 that the alumina distribution characteristics between optimal conditions and initial conditions are similar, and dissolved alumina diffuses around to ensure that the consumed alumina can be replenished in time. Similarly, the distributions of the bath temperature under optimal conditions and initial conditions in Fig. 10 are similar. Therefore, use of optimal conditions to operate aluminum reduction cells will not affect the alumina content and bath temperature distribution characteristic, but will lead to the achievement of more dissolved alumina and a more uniform alumina distribution, which is more conducive to electrolysis.
5 Conclusions
(1) Bath temperature, alumina content and alumina temperature have a statistically significant impact on the content of cumulative dissolved alumina (CCDA). Bath temperature, alumina content and current have a statistically significant impact on the relative deviation from the target content (RDTC). Regression models are obtained and the errors between the numerical and predicted values show that a good fitting quality is achieved.
(2) The interactive influence of the process parameters on CCDA and RDTC is illustrated and analyzed via 3D surface plots and 2D contour plots. By increasing the bath temperature and alumina temperature as well as decreasing the alumina content, CCDA can be increased. Increasing the bath temperature and decreasing the current contribute to the uniformity of the alumina distribution.
(3) The desirability approach is used to obtain the following optimal parameters: bath temperature of 958.8 ��C, alumina content of 2.679 wt.%, current of 300 kA and alumina temperature of 200 ��C for achieving maximal CCDA, minimal RDTC and superheat within the range of 8-15 ��C.
(4) The combination of the Box�CBehnken design and desirability approach is effective for predicting and evaluating the dissolution process of alumina in actual production. A set of optimal parameter combinations can be applied to the process control for an aluminum electrolytic cell.
References
[1] FENG Y Q, YANG W, COOKSEY M, SCHWARZ M P. Development of bubble driven flow CFD model applied for aluminium smelting cells [J]. Journal of Computational Multiphase Flows, 2010, 2(3): 179-188.
[2] PADAMATA S K, YASINSKIY A S, POLYAKOV P V. Anodic process on Cu-Al alloy in KF-AlF3-Al2O3 melts and suspensions [J]. Transactions of Nonferrous Metals Society of China, 2020, 30(5): 1419-1428.
[3] LIU Xiao-zhen, YANG You-jian, WANG Zhao-wen, TAO Wen-ju, LI Tuo-fu, ZHAO Zhi-bin. CFD modeling of alumina diffusion and distribution in aluminum smelting cells [J]. JOM, 2019, 71(2): 764-771.
[4] YAO Yu-chen, CHEUNG C, BAO Jie, SKYLLAS- KAZACOS M, WELCH B J, AKHMETOV S. Estimation of spatial alumina concentration in an aluminum reduction cell using a multilevel state observer [J]. AIChE Journal, 2017, 63(7): 2806-2818.
[5] MOXNES B, SOLHEIM A, LIANE M, SVINSAS E, HALKJELSVIK A. Improved cell operation by redistribution of the alumina feeding [C]// BEARNE G. Light Metals. Warrendale, PA: TMS, 2009: 461-466.
[6] WALKER D I. Alumina in aluminum smelting and its behaviour after addition to cryolite-based electrolytes [D]. Toronto: University of Toronto, 1993.
[7] KUSCHEL G I. The effect of alumina properties and smelter operating conditions on the dissolution behaviour of alumina [D]. Auckland: University of Auckland, 1990.
[8] KUSCHEL G I, WELCH B J. Further studies of alumina dissolution under conditions similar to cell operation [C]// ROOY E. Light Metals. Warrendale, PA: TMS, 1990: 299-305.
[9] JAIN R K, TRICKLEBANK S B, WELCH B J, WILLIAMS D J. Interaction of aluminas with aluminum smelting electrolutes [C]//BEARNE G. Light Metals. Warrendale, PA: TMS, 1983: 609-622.
[10] HAVERKAMP R G, WELCH B J. Modelling the dissolution of alumina powder in cryolite [J]. Chemical Engineering and Processing, 1998, 37(2): 177-187.
[11] WAI-POI N, HAVERKAMP R, K��BLER S, M��LLER- STEINHAGEN H. Thermal effects associated with alumina feeding in aluminum reduction cells [C]//MANNWEILER U. Light Metals. Warrendale, PA: TMS, 1994: 219-225.
[12] VERHAEGHE F, BLANPAIN B, WOLLANTS P. Dissolution of a solid sphere in a multicomponent liquid in a cubic enclosure [J]. Modelling and Simulation in Materials Science and Engineering, 2008, 16(4): 045007.
[13] VERHAEGHE F, LIU J, GUO M, ARNOUT S, BLANPAIN B, WOLLANTS P. Dissolution and diffusion behavior of Al2O3 in a CaO�CAl2O3�CSiO2 liquid: An experimental- numerical approach [J]. Applied Physics Letters, 2007, 91(12): 124104.
[14] YANG You-jian, GAO Bing-liang, WANG Zhao-wen, SHI Zhong-ning, HU Xian-wei. Effect of physiochemical properties and bath chemistry on alumina dissolution rate in cryolite electrolyte [J]. JOM, 2015, 67(5): 973-983.
[15] LILLEBUEN B, BUGGE M, HLIE H. Alumina dissolution and current efficiency in hall-heroult cells [C]//BEARNE G. Light Metals. Warrendale, PA: TMS, 2009: 389-394.
[16] BEREZIN A I, ISAEVA L A, BELOLIPETSKY, V M, PISKAZHOVA T V, SINELNIKOV V V. A model of dissolution and heating of alumina charged by point-feeding system in ��virtual cell�� program [C]//KVANDE H. Light Metals. Warrendale, PA: TMS, 2005: 151-156.
[17] FENG Y, COOKSEY M A, SCHWARZ M P. CFD modelling of alumina mixing in aluminium reduction cells [C]// LINDSAY S J. Light Metals. Warrendale, PA: TMS, 2011: 543-548.
[18] FENG Y, COOKSEY M A, SCHWARZ M P. CFD Modelling of alumina mixing in aluminium reduction cells, [C]//JOHNSON J A. Light Metals. Warrendale, PA: TMS, 2010: 455-460.
[19] ZHAN Shui-qing, LI Mao, ZHOU Jie-min, YANG Jian-hong, ZHOU Yi-wen. CFD simulation of dissolution process of alumina in an aluminum reduction cell with two-particle phase population balance model [J]. Applied Thermal Engineering, 2014, 73(1): 803-816.
[20] ZHANG Hong-liang, YANG Shuai, ZHANG He-hui, LI Jie, XU Yu-jie. Numerical simulation of alumina-mixing process with a multicomponent flow model coupled with electromagnetic forces in aluminum reduction cells [J]. JOM, 2014, 66(7): 1210-1217.
[21] ZHANG Hong-liang, YANG Shuai, LI Jie. Relationship between alumina mixing characteristics and feeder configurations in aluminum reduction cells [J]. Transactions of Nonferrous Metals Society of China, 2017, 27(11): 2512-2520.
[22] HOU Wen-yuan, LI He-song, LI Mao, ZHANG Bing, WANG Yu-jie, GAO Yu-ting. Multi-physical field coupling numerical investigation of alumina dissolution [J]. Applied Mathematical Modelling, 2019, 67: 588-604.
[23] LI Si-yun, LI Mao, HOU Wen-yuan, LI He-song, CHENG Ben-jun. Simulation of alumina dissolution and temperature response under different feeding quantities in aluminum reduction cell [J]. Journal of Central South University, 2019, 26(8): 2119-2128.
[24] LIANG Zeng-sen, GUO Hai-dong, YANG Zhong-sheng. Application and improvement of three-factor optimization control technology [C]//Low Carbon Development of Non-ferrous Metals Industry. Changsha: Central South University Press, 2010: 111-114. (in Chinese)
[25] LEI Xiang-shu, SHUANG Jing-jing, YANG Peng, LIU Ying-wen. Parametric study and optimization of dimpled tubes based on Response Surface Methodology and desirability approach [J]. International Journal of Heat and Mass Transfer, 2019, 142: 118453.
[26] KAHRAMAN M F, OZT��RK S. Experimental study of newly structural design grinding wheel considering response surface optimization and Monte Carlo simulation [J]. Measurement, 2019, 147: 106825.
[27] YANG Peng, CHEN Hui, LIU Ying-wen. Application of response surface methodology and desirability approach to investigate and optimize the jet pump in a thermoacoustic Stirling heat engine [J]. Applied Thermal Engineering, 2017, 127: 1005-1014.
[28] YANG Peng, LIU Ying-wen, ZHONG Ge-yu. Prediction and parametric analysis of acoustic streaming in a thermoacoustic Stirling heat engine with a jet pump using response surface methodology [J]. Applied Thermal Engineering, 2016, 103: 1004-1013.
[29] MYERS R H, MONTGOMERY D C, ANDERSON-COOK C M. Response surface methodology: Process and product optimization using designed experiments [M]. New Jersey: John Wiley & Sons, 2016.
[30] HU Dao-he, XU De-long, CAI Yu-liang. Gas-solid process engineering and its application in the cement industry [M]. Wuhan: Wuhan University of Technology Press, 2003. (in Chinese)
[31] LI Mao, GAO Yu-ting, BAI Xiao, LI Yuan, HOU Wen-yuan, WANG Yu-jie. Simulation of alumina particle dissolution in 300 kA aluminum electrolytic cell [J]. The Chinese Journal of Nonferrous Metals, 2017, 27(8): 1738-1747 . (in Chinese)
[32] THONSTAD J, SOLHEIM A, ROLSETH S, SKAR O. The dissolution of alumina in cryolite melts [C]//BOXALL L G. Light Metals. Warrendale, PA: TMS, 1988: 105-111.
[33] ZHANG Ming-jie, QIU Zhu-xian. Study on mathematical model of electrolyte melting point industrial aluminum [J]. Light Metals, 1981, 9(1): 15-22. (in Chinese)
[34] KOBBELTVEDT O. Dissolution kinetics for alumina in cryolite melts [D]. Trondheim: Norwegian University of Science and Technology, 1997.
����Ԩ������ɣ��� ï���̱������� Դ
���ϴ�ѧ ��Դ��ѧ�빤��ѧԺ����ɳ 410083
ժ Ҫ������Box-Behnken��ƺ�����Ⱥ������о����Ż����������ܽ��йص������ղ�����ѡ�������¶ȡ��������������������������¶���ΪӰ������������������ۻ��ܽ⺬��(CCDA)�����ƫ��Ŀ�꺬��(RDTC)��Ϊ��Ӧֵ������Ӱ���о�������������ӵ�����¶Ⱥ��������¶ȣ��Լ����������������������CCDA����ߵ�����¶Ⱥͽ��͵����������������ֲ����Ӿ��ȡ����ŵĹ�������Ϊ��������¶�958.8 ��C������������2.679%(��������)������300 kA�Լ��������¶�200 ��C��
�ؼ��ʣ������ۣ��������ܽ⣻��Ӧ���淨������Ⱥ����������ȴ���
(Edited by Bing YANG)
Foundation item: Project (2010AA065201) supported by the High Technology Research and Development Program of China; Project (2018zzts157) supported by the Fundamental Research Funds for the Central Universities of Central South University, China
Corresponding author: He-song LI; Tel: +86-13667317943; E-mail: lihesong@csu.edu.cn
DOI: 10.1016/S1003-6326(20)65470-X

