
Strain distribution of strips with spherical inclusion during cold rolling
YU Hai-liang(喻海良)1, BI Hong-yun(毕鸿运)2, LIU Xiang-hua(刘相华)1, TU Yan-feng(涂艳峰)1
1. State Key Laboratory of Rolling and Automation, Northeastern University, Shenyang 110004, China;
2. Research Institute for Stainless Steel, R&D Center, Baoshan Iron and Steel Co. Ltd, Shanghai 201900, China
Received 25 September 2007; accepted 21 January 2008
Abstract: The deformation of 304 stainless steel strips with a spherical inclusion during cold rolling was simulated by 3D finite element method, and the strain distribution was calculated for a variety of the material attribution of inclusion (hard inclusions and soft inclusions) and the inclusion size (10, 20, 30, 40, and 50 μm). During rolling, the strain in front of inclusion is larger than that in rear of inclusion for both the hard and soft inclusions. For hard inclusions, the strain in front and rear of inclusions is larger than that of inclusions, and the maximum and minimum strains increase with the increase of inclusion diameter (from 10 μm to 50 μm). For soft inclusions, the strain in front and rear of inclusions is smaller than that of inclusions, and the maximum and minimum strains decrease with the increase of inclusion sizes when the inclusion diameter is larger than 20 μm but increase when the inclusion diameter is smaller than 20 μm. Finally, the relationship between the inclusion deformation and the crack generation was discussed.
Key words: strain distribution; inclusion; stainless steel; cold rolling; FEM
1 Introduction
The equivalent strain distribution of workpieces during rolling affects their microstructure and mechanical properties[1]. The strain distribution is influenced by the work roll diameter, workpiece temperature, etc. The non-uniform strain distribution decreases with the increase of the roll diameter, friction coefficient[2], and with the decrease of the rolling speed, reduction ratio[3]. The authors[4] analyzed the strain distribution in slab during vertical-horizontal rolling and found out that there were two strain islands near the slab surface for the flat vertical roll. The researches above were carried out on the assumption that there were no defects in workpieces. The strain distribution around a void in porous metal sheet during rolling was analyzed with the rigid-plastic finite element method(FEM) by CHEN[5]; and NUGENT et al [6] investigated the stress and strain fields in a ductile matrix surrounding an elastic inclusion by experiments. In the reviewed papers, the strain distribution of strip with a plastic inclusion under a large deformation has been less investigated.
The inclusions inevitably exist in steel strips because of the deoxygenation, cover cinder, chemical aliquation, etc, which is one of the most important topics during continuous casting although their quantity, size, shape, distribution and composition are at a low level [7-8]. Studying the behavior of inclusions during rolling is significant for improvement of the strip quality. The behavior of inclusions during deformation of workpiece can be investigated by physical experiments[9-10] which are difficult for studying the strain distribution between the inclusions and the strip matrix in rolling process. The FEM has been widely used for analyzing the deformation of inclusions. ERVASTI and ST?HLBERG[11] simulated the behavior of macro- inclusions during hot rolling, and analyzed the inclusion shape for a variety of the pass reduction ratio and the roll radii. LUO and ST?HLBERG[12] developed a rigid- viscoplastic 2D FE code for analyzing the deformation of MnS inclusions in flat rolling process, and obtained the inclusion shape along the direction at different rolling temperatures. HWANG and CHEN[13] simulated the void generation and development around a rigid inclusion during sheet rolling, and found that the void length in front of inclusion was larger than that in rear of inclusion under different rolling conditions. A FE model with a transition layer between the inclusion and the strip matrix was used to analyze the inclusion deformation and the crack generation under various bonding strength of the inclusion and the strip matrix by the authors[14]. However, few researches have been carried out on the deformation of inclusion under various inclusion sizes and inclusion material attribution.
In this work, a 3D FE analysis is carried out to simulate the behavior of inclusions in 304 stainless steel strips during cold rolling on the platform of LS-DYNA. Attention was focused on analyzing the influence of the inclusion sizes on the strain distribution in different profiles for the hard and soft inclusions, respectively. And the maximum and minimum strain between the inclusions and the strip matrix under various conditions during rolling were obtained. In addition, the relationship between the inclusion deformation and the crack generation was discussed.
2 FE analysis
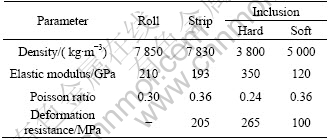
Fig.1 shows the schematic drawing of strip rolling with an inclusion, where X is rolling direction, Y is the strip thickness direction, and Z is the strip width direction. In the simulation, the work roll diameter(DW) is 400 mm which is assumed to be rigid. The strip thickness is 3.0 mm before rolling and 2.0 mm after rolling. The inclusions are assumed to be spherical and in the position of 1/4 of strip thickness whose diameters(DI) are 10, 20, 30, 40 and 50 μm, respectively. The friction coefficient between the strip and the roll is 0.15. During rolling, the strip is the 304 stainless steel, and two kinds of inclusions are employed: hard inclusions (such as Al2O3[14]), and soft inclusions (such as MnS[12]). The bilinear isotropic material model is employed for the strip matrix and the inclusion. The main material parameters of the roll, strip matrix[15] and inclusion[16] are listed in Table 1.
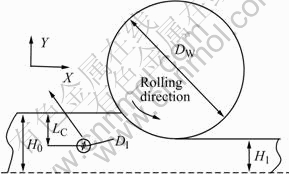
Fig.1 Schematic drawing of strip rolling with inside inclusion
Table 1 Material parameters during rolling
A quarter of the strip and the rolls are considered in the geometrical model owing to the symmetry. The 3D rolling model of the strip with an inclusion is built with the parameters above. The models are meshed with 8-node hexahedral elements. There are 6 912 elements in the inclusion and 43 520 elements in the strip matrix. In the rolling process, the roll rotates with a stable angular velocity, and the strip enters the roll with an initial velocity and exits under the action of friction force. The nodes on the middle cross section of strip thickness are constrained, UY=0; and the nodes in the middle cross section of strip width are constrained, UZ=0. The meshing of the strip around the inclusion before rolling is shown in Fig.2.
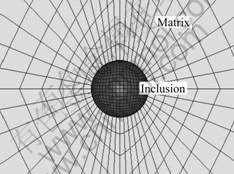
Fig.2 FE meshing of strip with inclusion
3 Results and discussion
In order to better describe the strain distribution around the inclusion, a schematic illustration of local areas around the inclusion is shown in Fig.3.
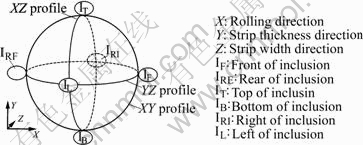
Fig.3 Schematic illustration of local areas around inclusion
Figs.4, 5, and 6 show the equivalent strain distribution in different profiles between the inclusion and the strip matrix after rolling when the inclusion diameters are 10, 20, and 50 μm, respectively, with (a), (c), and (e) for the hard inclusion, (b), (d), and (f) for the soft inclusion.
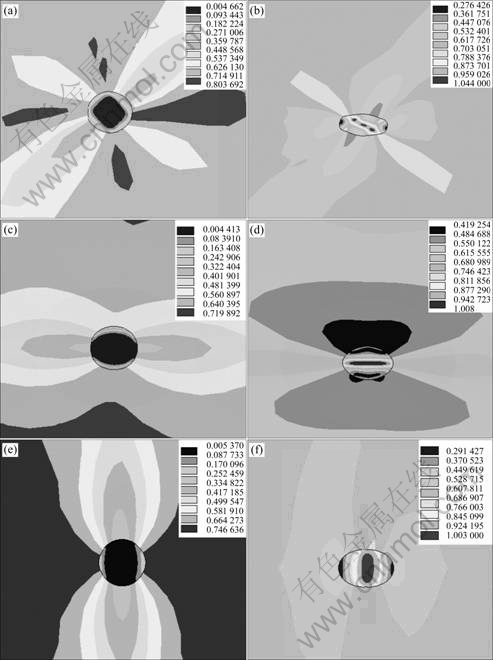
Fig. 4 Strain distribution for strip with 10 μm inclusion in XY (a, b), XZ (c, d) and YZ (e, f) profiles: (a), (c) and (e) Hard inclusion; (b), (d) and (f) Soft inclusion
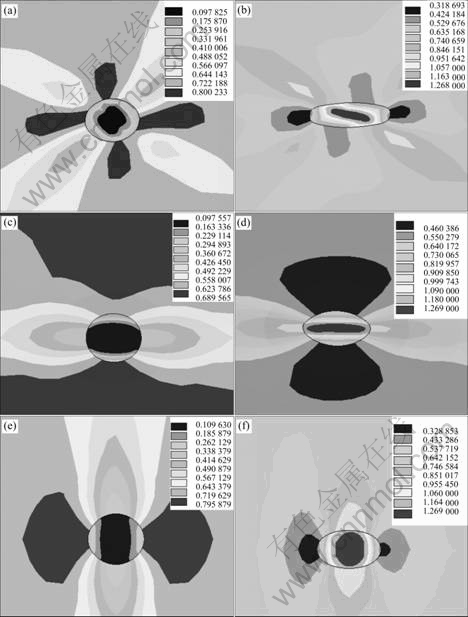
Fig.5 Strain distribution for strip with 20 μm inclusion in XY (a, b), XZ (c, d) and YZ (e, f) profiles: (a), (c) and (e) Hard inclusion; (b), (d) and (f) Soft inclusion
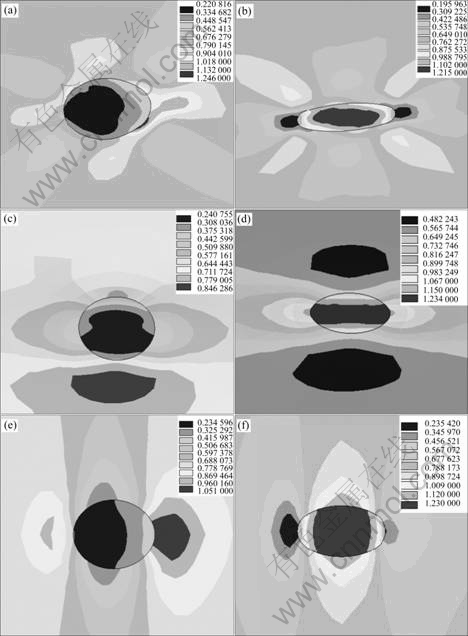
Fig.6 Strain distribution for strip with 50 μm inclusion in XY (a, b), XZ (c, d) and YZ (e, f) profiles: (a), (c), and (e) Hard inclusion; (b), (d) and (f) Soft inclusion
For the hard inclusions, as shown in Figs.4, 5 and 6 (a), the strain in front of inclusion (IF) and in rear of inclusion (IRE) are larger than that of inclusion. Meanwhile, the strain in IF is larger than that in IRE. With the increase of the inclusion size, the strain in IF increases, but the concentration area of strain decreases. The strain of inclusion increases as the inclusion size increases. When the inclusion diameter is 10 μm, the minimum strain of inclusion is 0.005 and the maximum strain of strip matrix is 0.804. When the inclusion diameter gets to 50 μm, the minimum strain of inclusion becomes 0.221 and the maximum strain of strip matrix becomes 1.246. Fig.6(a) shows that the strain in front of inclusion is larger than that in rear of inclusion. As seen in Figs.4(c), 5(c) and 6(c), a large strain gradient between the inclusions and the strip matrix appears in right of inclusion (IRI) and in left of inclusion (IL), which is similar to Figs.4(a), 5(a) and 6(a). So the largest strain gradient is around the inclusions in YZ plane (IF, IRE, IRI, and IL), as shown in Figs.4(e), 5(e) and 6(e).
For the soft inclusions, as shown in Figs.4(b), 5(b) and 6(b), the strain in IF and IRE is smaller than that of inclusions, and the minimum strain appears in IRE. When the inclusion diameter is 20 μm, the maximum strain of inclusion is 1.269 and the minimum strain of strip matrix is 0.319. The maximum strain with the inclusion diameter of 10 μm is much smaller than that with the inclusion diameter of 20 μm. The minimum strain of strip matrix with inclusion diameter of 20 μm is larger than that with the inclusion diameter of 10 μm. When comparing the maximum strain with the inclusion diameter of 20 μm and that with the inclusion diameter of 50 μm, the variation of the maximum strain is little. The minimum strain of strip matrix with inclusion diameter of 20 μm is larger than that with the inclusion diameter of 50 μm. As shown in Figs.4(d), 5(d) and 6(d), the strain of strip matrix in the inclusion center is much larger than that in other positions. By comparing Figs.4(b), 5(b) and 6(b) with Figs.4(d), 5(d) and 6(d), the strains in IRI and IL are much smaller than those in IF and IRE, as shown in Figs.4(f), 5(f) and 6(f).
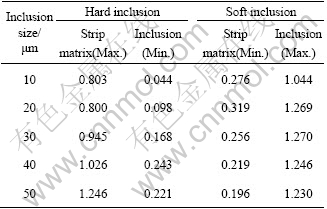
The maximum and minimum strains of the inclusion and the strip matrix are listed in Table 2. For the hard inclusions, the maximum and minimum strains increase with the increase of inclusion size. The difference between the maximum and minimum strain increases with the increase of inclusion size, and so does the non-uniform deformation. For the soft inclusions, when the inclusion diameter is larger than 20 μm, the maximum strain of inclusion changes slightly, and the maximum and minimum strains decrease with the increase of inclusion sizes when the inclusion diameter is larger than 20 μm, but increase when the inclusion diameter is smaller than 20 μm.
Table 2 Maximum and minimum strain of inclusion and strip matrix
During rolling, the cracks (voids) might appear and generate because of the non-uniform deformation in a local area of strip, and the strain gradient can be an effective way to describe the phenomenon. From the above results, the strain gradient between the inclusion and the strip matrix increases with the increase of inclusion size both for the hard and the soft inclusions, so does the appearance possibility of cracks. For some kinds of hard inclusions, the strain gradient in IF and IRE is much larger than that in other positions, so the cracks will firstly appear around these regions. Meanwhile, the strain gradient in IF is larger than that in IRE, so the cracks (voids) (as shown in Fig.7(a)) in IF might be larger than that in IRE[13] when the bonding strength between the inclusions and the strip matrix is not large enough. If the hard inclusion is brittle, the cracks will firstly appear in the inclusions (Fig.6(a)) as the results in Ref.[17]. For the soft inclusions, they could suffer a large deformation (as shown in Fig.7(b)), so they just elongate along rolling direction and few cracks will take place around the inclusions[9].
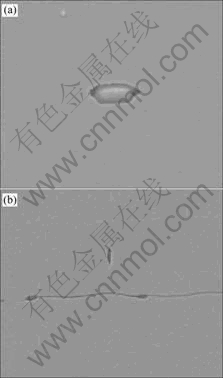
Fig.7 Hard inclusion (a) and soft inclusion (b) shape after cold rolling
4 Conclusions
1) During rolling, the strain in front of inclusion is larger than that in rear of inclusion for both the hard and soft inclusions in XY profile. For the hard inclusions, the maximum strain appears in front of inclusion, and the minimum strain appears in the inclusions. On the contrary, for soft inclusions, the maximum strain appears in the inclusions, and the minimum strain appears in rear of inclusions.
2) For hard inclusions, the maximum and minimum strains increase with the increase of inclusion size (from 10 μm to 50 μm); however, for soft inclusions, the maximum and minimum strains decrease with the increase of inclusion size when inclusion diameter is larger than 20 μm, and increase when inclusion diameter is smaller than 20 μm.
3) The maximum strain gradient between the inclusions and the strip matrix appears in front, rear, right and left of inclusion where the appearance possibility of defects is larger than that in other places, which increases with increase of inclusion size. And with the increase of inclusion size, the strain gradient in inclusions increases for the hard inclusions, where the cracks will firstly appear if the inclusions are brittle.
References
[1] JIAN W W, KANG Z X, LI Y Y. Effect of hot plastic deformation on microstructure and mechanical property of Mg-Mn-Ce magnesium alloy [J]. Trans Nonferrous Met Soc China, 2007, 17(6): 1158-1163.
[2] LI Q, TANG G D, LIU Z D TIAN Z L. Analysis of nonuniform strain in hot strip rolling deformation process [J]. Journal of Iron and Steel Research, 2007, 19(6): 52-55.
[3] SERAJZADEH S, KARIMI TAHERI A, NEJATI M, IZADI J, FATTAHI M. An investigation on strain inhomogeneity in hot strip rolling process [J]. Journal of Materials Processing Technology, 2002, 128(1/3): 88-99.
[4] YU H L, LIU X H, LI C S, ZHAO X M, KUSABA Y. Influences on the plastic strain distribution of slab of vertical roll shape during multi-pass V-H rolling process [J]. Acta Metallurgical Sinica (English letters), 2006, 19(1): 51-56.
[5] CHEN D C. Rigid-plastic finite element analysis of plastic deformation of porous metal sheets containing internal void defects [J]. Journal of Materials Processing Technology, 2006, 180(1/3): 193-200.
[6] NUGENT E E, CALHOUN R B, MORTENSEN A. Experimental investigation of stress and strain fields in a ductile matrix surrounding an elastic inclusion [J]. Acta Materialia, 2000, 48(2): 1451-1467.
[7] MASTSUMIYA T. Recent topics of research and development in continuous casting [J]. ISIJ International, 2006, 46 (12): 1800-1804.
[8] ATKINSON H V, SHI G. Characterization of inclusions in clean steels: A review including the statistics of extremes methods [J]. Progress in Materials Science, 2003, 48(5): 457-520.
[9] LOU D C, CUI K, WU X C, ZHOU F Y. Behavior of MnS during hot deformation [J]. Journal of Iron and Steel Research, 1996, 8(6): 11-14.
[10] VIGNAL V, OLTRA R, JOSSE C. Local analysis of the mechanical behaviour of inclusions-containing stainless steels under straining conditions [J]. Scripta Materialia, 2003, 49(8): 779-784.
[11] ERVASTI E, ST?HLBERG U. Void initiation close to a macro-inclusion during single pass reductions in the hot rolling of steel slabs: A numerical study [J]. Journal of Materials Processing Technology, 2005, 170(1/2): 142-150.
[12] LUO C H, ST?HLBERG U. An alternative way for evaluating the deformation of MnS inclusion in hot rolling of steel [J]. Scandinavian Journal of Metallurgy, 2002, 31(1): 184-190.
[13] HWANG Y M, CHEN D C. Analysis of the deformation mechanism of void generation and development around inclusions inside the sheet during sheet rolling process [J]. Proc Instn Mech Engrs Part B: J Engineering Manufacture, 2003, 217(10): 1373-1381.
[14] YU H L, LIU X H, LI X W. FE analysis of inclusion deformation and crack generation during cold rolling with a transition layer [J]. Materials Letters, 2008, 62(10/11): 1595-1598
[15] SUN S T. Steel materials handbook-stainless steel [M]. Beijing: Standards Press of China, 2001. (in Chinese)
[16] LI R J. Ceramic-metal complex materials [M]. Beijing: Metallurgical Industry Press, 1995. (in Chinese)
[17] FAN H M, ZENG Y P, WANG X S, CUI Z Q, XIE X S. Study on inclusion induced fatigue crack initiation and propagation in ultra-high strength steel for aerospace application [J]. Iron and Steel, 2007, 42(7): 72-75.
Foundation item: Project(50534020) supported by the National Natural Science Foundation of China; Project(2006CB605208-1) supported by the National Basic Research Program of China
Corresponding author: YU Hai-liang; Tel: +86-24-83681803; Fax: +86-24-23906472; E-mail: yuhailiang1980@tom.com
(Edited by YANG Bing)

