
Effect of temperature on mechanical alloying of Cu-Zn and Cu-Cr system
ZUO Ke-sheng(左可胜)1, 2, XI Sheng-qi(席生岐)2, ZHOU Jing-en(周敬恩)2
1. School of Earth Science and Resources, Chang’an University, Xi’an 710054, China;
2. State Key Laboratory for Mechanical Behavior of Materials,
School of Materials Science and Engineering, Xi’an Jiaotong University, Xi’an 710049, China
Received 21 August 2008; accepted 13 March 2009
Abstract: Cu-Zn and Cu-Cr powders were milled with an attritor mill at room temperature, -10, -20 and -30 ℃, respectively. Phase transformation and morphology evolution of the alloyed powder were investigated by X-ray diffractometry(XRD), X-ray photoelectron spectroscopy(XPS) and scanning electron microscopy(SEM). The results show that lowering temperature can delay mechanical alloying(MA) process of Cu-Zn system with negative mixing enthalpy, and promote MA process of Cu-Cr system with positive mixing enthalpy. As for Cu-Cr and Cu-Zn powders milled at -10 ℃, lamellar structures are firstly formed, while fewer lamellar particles can be found when the powder is milled at -20 ℃. When the alloyed powder is annealed at 1 000 ℃, Cu(Cr) solid solution is decomposed and Cr precipitates from Cu matrix, whereas Cu(Zn) solid solution keeps stable.
Key words: Cu-Cr system; Cu-Zn system; mechanical alloying; phase transformation; mixing enthalpy
1 Introduction
Mechanical alloying(MA) is a solid-state powder processing technique involving repeated welding, fracturing and rewelding of powder particles in a high- energy ball mill[1]. MA can be used to synthesize supersaturated solid solutions[2], nanostructures[3-4], amorphous alloys[5], intermetallic and chemical compounds[6-7]. MA process is mainly influenced by thermodynamic and kinetic properties of the original powder system, milling intensity and temperature.
MA is a process of competition between external forcing diffusion and thermally activated diffusion. The steady state that the system reaches is determined by a dynamic balance between the forced mixing events and diffusion events. BELLON and AVERBACK[8] proposed a forcing parameter Γ, which was defined as
Γ=Γb/Γt
where Γb is the atomic jump frequency caused by external forcing which drives alloying or disordering, and Γt is the atomic jump frequency due to thermal diffusion[8]. For systems of positive heat of mixing, atomic thermal diffusion led to phase decomposition. And for systems of negative heat of mixing, atomic thermal diffusion drove alloying. According to this point of view, lowering milling temperature could promote alloying process for systems of positive heat of mixing but hinder alloying process for systems of negative heat of mixing.
Several papers have reported the effect of milling temperature on MA of systems of positive mixing heat[9-12]. It was reported that the solubility of Ni-Ag system was extended by cryomilling for only a few hours, while it was difficult to be mechanically alloyed at room temperature[10]. CHERDYNTSEV et al[11] reported that MA process of Cu-Cr system was hindered at higher milling temperature. But for Cu-Ta system, cryomilling only accelerated the process of microstructural refinement, without apparent evidence of alloying, so XU et al[12] pointed out that the Bellon model could not be simply used for systems of positive mixing enthalpy. Since the radius of Ta (0.134 nm) is apparently larger than that of Cu (0.128 nm), the diffusion of Ta in Cu will cause large elastic strain energy in the Cu lattice. The Cu-Ta system is hard to be mechanically alloyed even in liquid-N2 temperature. The above reports indicated that alloy system should be carefully chosen to study the temperature effect on the MA of binary systems of positive heat of mixing. The radius of component elements should be similar.
Much of the above researches focused on the effect of temperature on binary system of positive mixing heat, and few on the effect of temperature on the binary systems of both positive and negative mixing heat.
To avoid the effect of elemental size difference, Cu-Zn system with negative mixing enthalpy and Cu-Cr system with positive mixing enthalpy were selected and the effects of temperature on MA of different systems were studied in this work. The phase transformation of the solid state reaction and morphology evolution were investigated by XRD, XPS and SEM, respectively. The effect of temperature was discussed based on thermodynamics calculation.
2 Experimental
The parameters of original powder used in experiments are listed in Table 1. The milling process was carried out in an attritor mill. The milling balls with 6 mm in diameter were made of tool steel. Low temperature was realized by using a DLSB-5220 cryogenic recycle pump with ethanol as coolant, and the room temperature was kept by using recycling water. MA was performed in argon with rotational speed of 300 r/min. Cu-Zn powder was milled for 10 h at -30 ℃ and room temperature, respectively, with ball-to-powder mass ration of 10?1; and Cu-Cr powder was milled for 36 h at -30 ℃, -20 ℃, -10 ℃ and room temperature, respectively, with ball-to-powder mass ratio of 20?1. When Cu-Cr (or Cu-Zn) powders were milled at room temperature and -10 ℃, 0.5% (mass fraction) of stearic acid was added as process control agent (PCA) in order to prevent excessive cold welding, while no PCA was added in lower-temperature milling experiments.
Table 1 Parameters of original powder used in experiments

A Rigaku D/max-3C diffractometer was used to investigate the structural evolution of the powder during milling process. And JEM-200CX scanning electron microscope was used to study the morphology of the as-milled powder. The analysis of surfacial elemental composition was made by using an ESCALAB220I-XL X-ray photoelectron spectroscope.
3 Results and discussion
3.1 Phase transformation
Fig.1 shows the X-ray diffraction patterns of Cu-Zn powder milled at room temperature for 2 h and 10 h. When the powder was milled for 2 h, the XRD pattern consisted of six phases: Cu, Zn, ZnO, ε phase (CuZn5), γ phase (Cu5Zn8) and α phase (Cu0.64Zn0.36). Cu was the main phase. Zn peaks remained, but they were very weak. The peak position of Zn (100) deviated from 38.75? to 39.08?, and the peak position of Zn (002) deviated from 36.01? to 36.34?. Radius of Zn atom is 0.133 nm, and radius of Cu atom is 0.128 nm. Since Cu atom is smaller than Zn atom, Cu atom diffuses in Zn more easily than Zn atom does in Cu. The diffusion of Cu in Zn reduced lattice parameter of Zn, and the angle of Zn peaks deviated to a larger value. In Fig.1, Cu peaks did hardly deviate, which indicated that little Zn diffused in Cu. The diffusivities of Cu in Zn and Zn in Cu extrapolated from high temperature data are 3.0×10⁻¹⁸ and 8.2×10⁻²⁷, respectively[13]. Since diffusivity of Cu in Zn is about eight orders of magnitude higher than that of Zn in Cu, the formation of Zn-rich phases such as CuZn5 and Cu5Zn8 was expected to initiate by the diffusion of Cu in Zn in the early stage of milling. And Cu(Zn) solid solution was finally formed after milled up to 10 h.

Fig.1 XRD patterns of Cu-Zn powder milled at room temperature
PABI and MURTY[13] reported that the MA of Cu-40%Zn (mass fraction) system followed ε+γ→β+α→ α+ZnO. Judging from Table 2, we can see that there should be a peak at 30.273? for β phase (CuZn). But no peak appears at 30.273? in XRD pattern (Fig.1). This demonstrates that no β phase forms during the process of MA of Cu-40%Zn system.
Table 2 Data of CuxZn1-x in PDF cards
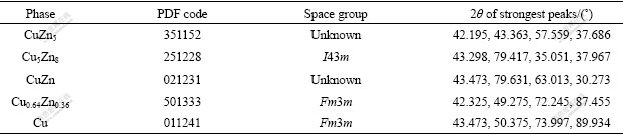
Fig.2 shows XRD patterns of Cu- Zn powder milled at -30 ℃ and room temperature for 10 h and the images of balls. When Cu-Zn powder was milled at -30 ℃, the resultants consisted of Cu, Zn, ZnO and α phase (Cu0.64Zn0.36). The existence of Zn and Cu peaks indicated that the MA process hadn’t completed. We could see that Zn had dissolved into Cu lattice and no zinc-rich phase existed in the powder prepared at room temperature. It can be concluded that MA process is suppressed at lower temperature for Cu-Zn system.
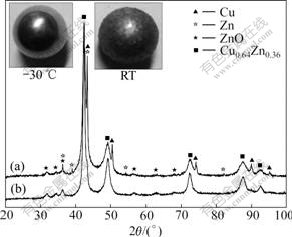
Fig.2 XRD patterns of Cu-Zn powder milled at -30 ℃ (a) and RT (b) and images of milling balls
Since Cu-Zn system belongs to ductile-ductile system, the powder adheres to the surface of milling balls during milling process easily. In room temperature (RT) milling process, PCA was added. Still there was much powder adhering to the ball (Fig.2). From the image of the ball used in -30 ℃ milling, we can see that the ball surface was clean, and no powder adhered to the ball surface. This indicated that cold welding was suppressed in -30 ℃ milling.
Fig.3 shows the XRD patterns of Cu-5%Cr (mass fraction) powder milled at different temperatures. The powder milled at -10 ℃ and above consisted of Cu and Cr. This indicated that MA hadn’t completed yet. Cr peaks disappeared in the XRD patterns for the powders prepared at -20 ℃ and -30 ℃. This indicated that Cr dissolved in Cu. Since radius of Cr (0.126 nm) equals about that of Cu (0.128 nm), the dissolving of Cr in Cu leads to no apparent peak deviation in XRD pattern (Fig.3).
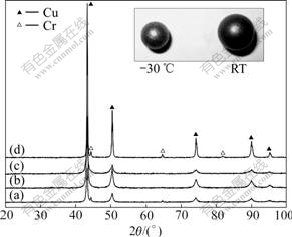
Fig.3 XRD patterns of Cu-5%Cr powder milled at different temperatures and image of milling balls: (a) -10 ℃, 36 h; (b) -20 ℃, 36 h; (c) -30 ℃, 36 h; (d) 20 ℃, 100 h
The images of balls used in RT and -30 ℃ milling are presented in Fig.3. There is more powder adhering to the ball used in RT milling, and the ball used in RT milling is larger in size than that used at -30 ℃. The powder adhering to the ball formed a porous shell, and the shell could reduce the impacting energy when two balls collided. Thus, it was unfavorable for mechanical alloying of Cu-Cr mixtures at room temperature.
X-ray photoelectron spectroscopy(XPS) was used to investigate the surface elements of the Cu-5%Cr powders prepared at different temperatures. XPS data of Cu-Cr powders prepared at different temperatures are listed in Table 3. The high carbon content on the powder surface was due to wear of graphite gasket around the upper shaft. The diffusivity of C and O is larger on surface than in lattice. Thus most C and O aggregated on powder surface, and C and O contents were high. From Table 3, it can be seen that more O was absorbed in the powder prepared at lower temperatures, which can be explained that it is easier for O to escape from the powder at higher temperatures.
Table 3 XPS data of Cu-5%Cr powder milled at different temperatures

Fig.4 shows the Cr contents (mCr/(mCr+mCu)) on surface of the powder prepared at different temperatures. Cr content was much higher on surface of the powder milled at room temperature than in the original mixtures. Cr content on the surface of the powder prepared at -30 ℃ equaled about 5% (the Cr content of original powder). Since the diffusivity(D) follows DSurface>DGrain boundary>DLattice, during the MA process, concentration of Cr in Cu follows wSurface>wGrain boundary>wLattice. When MA process completes, Cr will be homogenously distributed in Cu, and wSurface=wGrain boundary=wLattice finally. It could be included that low temperature milling promoted MA of Cu-Cr system from XRD patterns and XPS data.

Fig.4 Cr content (derived from XPS) for powders milled at different temperatures
3.2 Morphology evolution
Fig.5 shows the SEM images of Cu-5%Cr powder milled at -10 ℃ and -20 ℃ for different time. As for the powder prepared at -10 ℃, particles deformed into lamellae structure by the impact of the balls in the early stage (Fig.5(a)). When the powder was milled for 5 h, the ratio of lamellar particles reduced, and the small particles became equiaxed (Fig.5(b)). In Fig.5(c), the equiaxed particles became coarser due to cold welding of the small particles. Particles got finer with further milling and the lamellar particles disappeared (Figs.5.(d)-(f)).

Fig.5 SEM images of Cu-Cr powder during MA process: (a) T=-10 ℃, t=0.5 h; (b) T=-10 ℃, t=5 h; (c) T=-10 ℃, t=10 h; (d) T=-10 ℃, t=20 h; (e) T=-10 ℃, t=30 h; (f) T=-10 ℃, t=36 h; (g) T=-20 ℃, t=0.5 h; (h) T=-20 ℃, t=12 h; (i) T=-20 ℃, t=17 h; (j) T=-20 ℃, t=25 h
At a lower temperature, the ductility of powder decreases, and it is easy for powder to fracture in milling process. In the early stage, compared with Fig.5(a), the fracture of powder led to fewer lamellar particles (Fig.5(g)). When being milled for 12 h, particles were welded and got coarser (Fig.5(h)). With further milling, the size of particles got smaller (Figs.5(i)-(j)).
Feret’s diameters of particles were measured and the statistic results are presented in Fig.6. For powder milled at higher temperature (-10 ℃), the formation of lamellar structure was apparent, which caused the growth in granular size in the early stage of milling (t=0.5 h). The deformation of particles led to fracture, and the granular size reduced (t=5 h). The cold welding of small particles led to the increase in granular size when the powder was milled for 10 h. The granular size kept reducing with decrease in metallic plasticity in the following milling process (Fig.6(a)). There was a peak when the milling time was about 10 h for -10 ℃ and -20 ℃ groups in Fig.6(a). The difference of granular size between groups, -10 ℃ and -20 ℃, was apparent before 15 h. After 15 h, the granular size of both groups coincided with each other. For powder milled at -20 ℃, the formation of lamellar structure was not very apparent, and there was not a decrease in particle size before 12 h. By comparing curves 2, 3, 4, 5 in Fig.6(b) with curve 1, 2, 3, 4 in Fig.6(c), we can notice that the probability data followed normal distribution or skewed distribution. The variation of granular size distribution for the two groups with milling time followed: narrow→wide→narrow. The widest distribution appeared at 10-20 h period.

Fig.6 Variation in granular size with milling time (a) and granular distribution curves (b) and (c) for Cu-Cr powder
The characteristics of SEM images for Cu-Zn system are similar to Cu-Cr system (Fig.7). When the powder was milled for 0.5 h, particles milled at RTdeformed into lamellar structure (Fig.7(a)). But few lamellar particles milled at a lower temperature could be found (Fig.7(b)). When being milled up to 10 h, particles were welded into larger particles (Figs.7(c)-(d)).

Fig.7 SEM images of Cu-Zn powder during MA process: (a) T=17 ℃, t=0.5 h; (b) T=-30 ℃, t=0.5 h; (c) T=17 ℃, t=10 h; (d) T= -30 ℃, t=10 h
4 Thermodynamics analysis
Fig.8 shows Gibbs free energy for solid solution of Cu-Cr and Cu-Zn system. The mixing enthalpy of Cu-Cr system is positive (Fig.8(a)[14]), which means there exists no thermodynamics driving force to form solid solution for Cu-Cr system. Cu-Cr solid solution formed by MA is metastable at room temperature due to low diffusion coefficient. When Cu-Cr MA powder was annealed at 1 000 ℃, the diffusivity of Cr in Cu gets much larger, and Cr precipitates from the Cu matrix (Fig.9(a)).

Fig.8 Gibbs free energy for solid solution of Cu-Cr[14] (a) and Cu-Zn (b) system

Fig.9 XRD patterns of Cu-50%Cr (a) and Cu-40% Zn (b) MAed powders annealed at 1 000 ℃
4.1 Forming Gibbs free energy of solid solution
If the original powders are in the standard state, the forming Gibbs free energy of disordered solid solution is
?GS=?HSm+RT(cAlncA+cBlncB) (1)
where cA and cB are the molar concentrations of element A and element B, respectively, cA+cB=1; R is the gas constant; and T is the reaction temperature.
?HSm is the enthalpy of solid solution[15]:
?HSm=?HC+?HE+?HS (2)
The first term on the right-hand side represents the chemical contribution. The second term represents the elastic mismatch energy which appears in solid solutions. The third term represents the lattice stability which is supposed to vary continuously with the average number of valence electrons.
4.2 Chemical contribution, ΔHC
A semiempirical model that can predict the enthalpy of formation was constructed by MIEDEMA in Ref.[15]. The complete form of ?HC is

 (3)
(3)
It can be written as


 (4)
(4)
where
 (5)
(5)

 ,
,

For solid solutions
 (6)
(6)
For inter-metallic compounds:
 (7)
(7)
 and
and  are the surface concentrations of A and B, respectively, and they have the forms as
 ,
,  (8)
(8)
VA=VB, =cA, =cB. VA, VB are the molar volumes of A and B, respectively;  and nws are the work function and the electron density; and P, Q and R′ are constants depended on the components.
4.3 Elastic contribution, ΔHE
Elastic contribution is as follows[16]:
?HE=cAcB(cA?EA in B+cB?EB in A) (9)
?EA in B (?EB in A) is the elastic energy caused by A (B) dissolving in B (A):

 (10)
(10)
where K and u are bulk modulus and shear modulus.
4.4 Structure contribution, ΔHS
For the binary system between the transitional and non-transitional elements: ?HS=0[16].
By calculating with the parameters in Table 4, the forming Gibbs free energy of solid solution of Cu-Zn is shown in Fig.8(b). The mixing Gibbs free energy of Cu-Zn system is negative according to Fig.8(b), which indicates that there exists driving force to form solid solution for Cu-Zn binary system, and the diffusion of Zn in Cu will promote the formation of solid solution. Cu(Zn) solid solution is stable when the MAed powder is annealed at 1 000 ℃ (Fig.9(b)).
Table 4 Parameters for calculating Gibbs free energy of Cu-Zn system[15]

Combining experimental results with thermo- dynamics calculation, we can see that lowering temperature could delay MA process of Cu-Zn system with negative mixing enthalpy, but promote MA process of Cu-Cr system with positive mixing enthalpy.
5 Conclusions
1) Lowering temperature can delay MA process of Cu-Zn system with negative mixing enthalpy, but promote MA process of Cu-Cr system with positive mixing enthalpy. Cu(Zn) solid solution is stable when being annealed at 1 000 ℃, but Cu(Cr) solid solution is decomposed and Cr precipitates from Cu matrix.
2) Temperature affects the powder morphology evolution during MA process. As for Cu-Cr and Cu-Zn powders milled above -10 ℃, lamellar structures are firstly formed, while fewer lamellar particles can be found when the powder is milled below -20 ℃.
References
[1] SONI P R. Mechanical alloying: Fundamental and applications [M]. Cambridge: Cambridge International Science Publishing, 2000.
[2] NAYAK S S, MURTY B S, PABI S K. Structure of nanocomposites of Al-Fe alloys prepared by mechanical alloying and rapid solidification processing [J]. Bulletin of Materials Science, 2008, 31(3): 449-454.
[3] MANISHIAN M H, SIMCHI A, SIMCHI Z R. Structural changes during synthesizing of nanostructured W-20wt%Cu composite powder by mechanical alloying [J]. Mater Sci Eng A, 2007, 445/446: 86-93.
[4] SUNOL J J, GONZALEZ A, ESCODA L, MORA M T. Development of Fe-based nanocrystalline materials by mechanical alloying [J]. Revista de Metalurgia, 2008, 44(3): 216-221.
[5] IPUS J J, BLAZQUEZ J S, FRANCO V, CONDE A. Mechanical alloying of Fe100-x-yNbxBy (x=5, 10; y=10, 15): From pure powder mixture to amorphous phase [J]. Intermetallics, 2008, 16(9): 1073-1082.
[6] MOUSAVI T, KARIMZADEH F, ABBASI M H. Synthesis and characterization of nanocrystalline NiTi intermetallic by mechanical alloying [J]. Mater Sci Eng A, 2008, 487(1/2): 46-51.
[7] de MEDEIROS S N, MACHADO F, ZAMPIERE R B, SANTOS I A, PAESANO J A. Preparation of AlRu intermetallic compounds by mechanical alloying [J]. Journal of Non-Crystalline Solids, 2006, 352(32/35): 3718-3720.
[8] BELLON P, AVERBACK R S. Nonequilibrium roughening of interfaces in crystals under shear: Application to ball milling [J]. Physical Review Letters, 1995, 74(10): 1819-1822.
[9] BONYUET D, OCHOA J, GONZALEZ G. Mechanical alloying in the immiscible systems Ag-M (M=Fe, Co, Ni) [J]. Journal of Metastable and Nanocrystalline Materials, 2004, 20/21: 225-230.
[10] XU J, HERR U, KLASSEN T. Formation of supersaturated solid solutions in the immiscible Ni-Ag system by mechanical alloying [J]. Journal of Applied Physics, 1996, 79: 3935-3945.
[11] CHERDYNTSEV V, KALOSHKIN S D, SERDYUKOV V N. Kinetics of mechanical alloying in the immiscible system Cu50Cr50 [J]. Fizika Metallov I Metallovedenie, 2004, 97(4): 71-78. (in Russian)
[12] XU J, HE J H, MA E. Effect of milling temperature on mechanical alloying in the immiscible Cu-Ta system [J]. Metallurgical and Materials Transactions A, 1997, 28(7): 1569-1580.
[13] PABI S K, MURTY B S. Mechanism of mechanical alloying in Ni-Al and Cu-Zn systems [J]. Mater Sci Eng A, 1996, 214: 146-152.
[14] GERASIMOV K B, MYTNICHENKO S V, PAVLOV S V. Structural study of mechanically alloyed Cu30Cr70 by anomalous X-ray diffraction and EXAFS-spectroscopy [J]. Journal of Alloys and Compounds, 1997, 252: 179-183.
[15] MIEDEMA A R. Cohesion in alloys―Fundamentals of a semi- empirical model [J]. Physica B, 1980, 100: 1-28.
[16] BAKKER H, ZHOU G G, YANG H. Mechanically driven disorder and phase transformations in alloys [J]. Progress in Materials, 1995, 39(3): 159-241.
Foundation item: Project(20050698017) supported by the Specialized Research Fund for the Doctoral Program of Higher Education of China; Key Project(105159) supported by Chinese Ministry of Education; Project(NCET-05-0839) supported by Program for New Century Excellent Talents in University
Corresponding author: ZUO Ke-sheng; Tel: +86-29-82339076; E-mail: keshengz@chd.edu.cn
DOI: 10.1016/S1003-6326(08)60430-6
(Edited by YANG Bing)

