


Trans. Nonferrous Met. Soc. China 22(2012) 873-878
Preparation and photocatalytic performance of porous ZnO microrods loaded with Ag
JIA Zhi-gang, PENG Kuan-kuan, LI Yan-hua, ZHU Rong-sun
School of Chemistry and Chemical Engineering, Anhui University of Technology, Maanshan 243002, China
Received 18 April 2011; accepted 6 June 2011
Abstract: Porous silver-modified ZnO microrods photocatalysts were synthesized through direct thermal decomposition of the Ag-doped zinctartrate precursor, which was prepared by homogeneous precipitation method at 80℃ for 2 h. The obtained samples were characterized by XRD, FTIR, TG-DTA and UV-VIS absorption spectroscopy. The photocatalytic activity of the as-prepared porous Ag/ZnO microrods was tested with the photocatalytic degradation of methyl orange. The results indicate that doping Ag greatly improves the photocatalytic efficiency of ZnO and 3% Ag-doped (mole fraction) ZnO porous microrod photocatalyst exhibits the highest photocatalytic decolorization efficiency, leading to as much as 80% reduction of MO concentration in 120 min. Moreover, the 3% Ag-doped porous microrods also possess higher photocatalytic activity under the real sunlight irradiation.
Key words: Ag/ZnO; porous material; photocatalytic performance; decoloration
1 Introduction
Over the past few years, the degradation of organic pollutants in wastewater has been a serious concern throughout the world. Several methods, such as Fenton technology [1,2], catalytic wet oxidation [3], hydrogen peroxide [4], and photocatalysis [5,6], have been developed. Among them, semiconductor-based photocatalytic degradation has attracted great interest as an effective, economic, and environment-friendly method.
As one of the most important II-VI semiconductors, ZnO with a wide band gap of 3.37 eV is an environmentally friendly and chemically stable material and is also an ideal photocatalyst besides TiO2. In some cases, ZnO exhibits better degradation capacity than TiO2 [7-10]. The photocatalytic activity of ZnO has been widely explored and reported. Principally, the electrons and holes generated from the semiconductor are responsible for the efficient photocatalytic degradation of organic pollutants. However, the photoinduced electrons and holes can also recombine to decrease the available photocatalytic efficiency.
To improve the photocatalytic efficiency of ZnO, many efforts have been done to improve the segregation of electrons and holes. The modification of semiconductors with metals has attracted significant attention especially in heterogeneous photocatalysis. ZnO doped with various transition metal dopants has been investigated in detail [11-15]. In fact, doping metals except for Ag has shown the intangible (positive and negative) impact because of the complicated factors, such as electronic structure, dopant concentration, energy level positions of the dopants within the band gap, and distribution of dopant on semiconductor surface. Ag/ZnO heterostructure photocatalyst with high catalytic activity has been intensively researched [16-20]. Meanwhile, the higher surface area is also an important factor for the enhancement of photocatalytic performance of Ag/ZnO catalyst. Therefore, the synthesis of the porous catalyst materials was intensively concerned. Although the synthesis of Ag/ZnO heterostructures or porous ZnO was intensively reported in large quantities, there are few reports about porous Ag/ZnO superstructure so far in the literatures.
In the present work, we presented a single-source precursor method of rod-like porous Ag/ZnO microrods, and tartaric acid (Tar) was employed as coordination agent because of the strong coordination capacity with Zn2+ and Ag+. The photocatalytic performance of the as-prepared porous Ag/ZnO microrods was investigated in deionized water under both the UV light (15 W, 365 nm) and real sunlight irradiation.
2 Experimental
2.1 Sample preparation
All the chemicals used in this study were of analytical grade and used without further purification. In a typical procedure, 10 mmol tartaric acid was dissolved in 20 mL of ethanol, and 10 mmol metal salt with various mole ratios (n(Zn(NO3)2/n(AgNO3)=0, 0.01, 0.03, 0.05, 0.07) was dissolved in 20 mL distilled water. Then, tartaric acid solution was slowly added into metal salt solution under magnetic stirring, and the transparent mixture was transferred into an autoclave, which was then tightly sealed and hydrothermally treated at 80℃ for 2 h an on oven. The product was collected by filteration and washed with deionized water and absolute ethanol several times and dried in air at 80℃ for 10 h. In the next step, the as-prepared products were annealed in air at 450℃ for 4 h. The obtained samples were labeled as AZ0, AZ1, AZ3, AZ5, and AZ7, respectively, according to the difference of n(Zn(NO3)2/n(AgNO3) during the preparation.
2.2 Sample characterization
All the samples were characterized by powder XRD on a D5000 X-ray diffractometer in the diffraction angle range 2θ=20°-80°, using Cu Kα radiation. Thermal behaviors of the precursors were examined with a Netzsch STA449C thermogravimetric analyzer (TGA) at a heating rate of 5℃/min from 30 to 700℃ in a flow of air. The morphologies of the samples were investigated on a field-emission scanning electron microscope (SEM) using a JEOL JSM-6700 apparatus. Infrared (IR) absorption spectroscopy (Nicolet Nexus 870) was carried out at room temperature in the range of 450-4000 cm-1 on the FTIR spectrophotometer. UV-VIS absorption spectra were recorded on a TU-1900 UV-VIS double-beam spectrophotometer. The scanning wavelength range was 220-800 nm.
2.3 Photocatalytic activity test
Methyl orange dye (MO), a typical azo dye, was used as a probe molecule to evaluate the photocatalytic reactivity of the samples in response to ultraviolet light. The temperature throughout these experiments was (20±2)℃. The experiments were carried out as follows. 100 mg samples were dispersed in 100 mL of 1×10⁻⁵ mol/L MO (c0) aqueous solution in a 200 mL beaker. Prior to illumination, the suspensions were magnetically stirred in the dark for 30 min to ensure the establishment of absorption/desorption equilibrium of MO on the sample surfaces. Subsequently, the suspension was irradiated under a 15 W UV lamp with a main peak wavelength of 365 nm positioned about 15 cm away from the breaker. At given intervals, 4 mL of the suspension was extracted and subsequently centrifuged at a rate of 5000 r/min for 5 min. The MO concentration (c) was analyzed on a UV-VIS spectrophotometer at a wavelength of 462 nm.
Photocatalytic tests under the real sunlight irradiation were performed from 11:20 a.m. to 1:00 p.m. on 15 May (sunnyday), 2010, at latitude 31.69° North and longitude 118.49° East (Maanshan city, Anhui province, China). The temperature throughout these experiments was (20± 2)℃. The reaction cells were 200 mL beakers with a diameter of about 11 cm, which were equipped with a magnetic stirrer. The sunlight photocatalytic procedure was the same as that under the UV light.
3 Results and discussion
Figure 1 shows the XRD patterns of Ag-doped and undoped ZnO. The main diffraction peaks could be readily indexed as wurtzite type ZnO (hexagonal structure; JCPDS: 36-1451) for both pure and Ag-doped ZnO samples, which is accorded well with the reported data (JCPDS File No. 36-1451). The peaks at 2θ of 31.8°, 34.5°, 36.3°, 47.6° and 56.5°, correspond to the crystal planes (100), (002), (101), (102), and (110) of crystalline ZnO, respectively. However, no such shift in the peak positions or diffraction peaks from any other chemical species, such as silver and/or silver oxide, was observed in any of the modified samples, which might be ascribed to a low amount, the amorphous state or the high dispersion of Ag [21].

Fig. 1 X-ray diffraction patterns of calcined samples
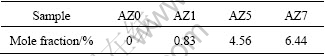
The typical SEM images of the zinctartrate precursor and Ag/ZnO composite (AZ3) are shown in Fig. 2. In Fig. 2(a), the zinctartrate precursor was rod-like with a average diameter about 1 μm and a length up to 10 μm. Figure 2(b) demonstrates the SEM image of the calcined sample. It can be seen that the precursor morphology has been well retained, and the surface became rough compared with the precursor. The microstructure of the sample AZ3 was further investigated by TEM. As shown in Fig. 2(c), the Ag/ZnO microrods consist of plenty of nanocrystals. The nanocrystals are bound to each other to form porous structure. The nanoholes with a size of several nanometers are also clearly found, which may greatly enhance the surface area of the sample. The void space between the nanocrystals in microrods should be generated during the calcinations. The content of silver was 2.86% (mole fraction) from the EDS spectrum (Fig. 2(d)). The loading of silver for the other calcined samples (AZ0,AZ1,AZ5,AZ7) was also tested by EDS technology, as listed in Table 1. It can be seen that the Ag content in samples show a increase tendency with the increasing mole ratio of Ag+ to Zn2+ in the preparation process of the tartrate precursor.
Table 1 Content of Ag in calcined samples tested by EDS
The thermal analysis of the Ag-doped precursor (AZ3) was investigated in a static air atmosphere from ambient to 450℃. Figure 3 shows the TG-DTA curves of the precursor at a heating rate of 5℃/min. It can be seen that there is only exothermal peak at 400℃, corresponding to the decomposition of the precursor. There is a rapid change in mass loss in the TG curve, suggesting the removal of the carbon monoxide and carbon dioxide molecules for the tartrate precursor. These curves also show that the compound is anhydrous. Figure 4 shows the schematic diagram of the formation process of rod-like porous Ag/ZnO superstructure. Aqueous solutions of tartaric acid and metal salts react to precipitate a mixed-metal tartrate particles (a). The polarization and viscosity of the ethanol-water binary solvent may also play an important role in the formation of rod-like morphology. The in-stiu decomposition of the rod-like precursor resulted in the formation of Ag/ZnO. Pore structures are generated via the thermal decomposition of the tartrate precursor from rod-like particles (b). The decomposition process of the tartrate can be expressed as follows:
(Ag, Zn)(Tar)→Ag/ZnO+CO2+CO
Figure 5 shows FTIR spectra of pure and doped ZnO samples. The FT-IR spectrum of samples shows that there are broad peaks at 3450 and 1630 cm-1, corresponding to the surface-adsorbed water and hydroxyl groups, respectively [22]. The strong peak at 500 cm-1 was assigned to the characteristic of ZnO [23]. FTIR spectra also show numerous vibrational modes at low frequency (830-1200 cm-1, 1380 cm-1), which could be attributed to the different group frequencies of residual group and reaction byproducts. No vibrations in relation with Ag were detected in doped ZnO samples, indicating that there is no chemical bonding between Ag and ZnO.

Fig. 2 SEM images of zinctartrate precursor (a) and calcined sample (b), TEM image (c) and EDS analysis (d) of sample AZ3

Fig. 3 TG-DTA curves of tartrate precursor

Fig. 4 Schematic diagram for growth process of porous Ag/ZnO microrod

Fig. 5 Infrared spectra of calcined samples doped with Ag
Photocatalytic activity evaluations were investigated by the degradation of MO in aqueous solution. Figure 6 shows the degradation of MO in the presence of the ZnO and doped ZnO samples under UV irradiation. It can be seen that all doped ZnO possessed higher photocatalytic activities than ZnO. The photocatalytic activities of Ag/ZnO samples first increased with the doping Ag content up to 3% (AZ3), and then slightly decreased with further doping Ag to 5% (AZ5) and 7% (AZ7). AZ3 was found to be the most active, which shows a photocatalytic activity about 2 times higher than pure ZnO sample (AZ0). Therefore, 3% silver is found to be the optimum concentration, and the higher content of silver could be unfavorable to photocatalytic efficiency, which are consistent with the reported results [24].

Fig. 6 Relative photocatalytic activity of samples under UV light irradiation
It has been reported that Ag deposits on ZnO surface acted as electron sinks and hindered the recombination of photoinduced electrons and holes, resulting in the better charge separation than ZnO, and thus enhanced the photocatalytic activity of Ag/ZnO photocatalysts [25]. When the content of Ag was below the optimal value, the higher the content of Ag in composite is, the higher the photocatalytic activity of Ag/ZnO heterostructure photocatalyst should be. When the content of Ag is above the optimal value, metallic silver may act as recombination centers, which is caused by the electrostatic attraction of negatively charged silver and positively charged holes [26]. Furthermore, excessive silver may reduce the number of photons absorbed by the photocatalyst because of a light-filtering effect, which lowered the apparent photoquantum efficiency of the photocatalytic reaction and also decreased the probability of holes reacting with absorbed species on the ZnO surface [27].
The time-dependent absorption spectra of MO aqueous solution during the UV light irradiation in the presence of sample AZ3 are shown in Fig. 7. It is seen that the characteristic absorption peaks of MO at approximately 465 nm became weaker as the irradiation time increased. No new absorption peaks appeared, and no obvious hypsochromic shift was observed, which indicated that the degradation of MO occurred under UV exposure. MO solution over AZ3 was greatly degraded after irradiation for 120 min.
Figure 8 shows the degradation evolution of MO in the absence or presence of AZ3 photocatalyst under the real sunlight irradiation. As can be seen, in the absence of any photocatalyst, the degradation of MO hardly occurred when subjected to the real sunlight irradiation for 100 min. The concentration of MO decreased about 70% with sample AZ3 as photocatalyst under 15 W UV light. In contrast, the degradation rate of MO under the real sunlight irradiation could be completely degraded after irradiation for 100 min by adding sample AZ3. The photocatalytic activity under sunlight was higher than that with 15 W UV light as light source, which may be ascribed to the higher UV light intensity of sunlight.

Fig. 7 UV-visible spectra of MO aqueous solution as function of reaction time with sample AZ3 as catalyst

Fig. 8 Photocatalytic activity of sample AZ3 under sunlight and UV light
4 Conclusions
1) Porous Ag/ZnO microrods were successfully synthesized by the decomposition of the tartrate precursor, which was prepared by homogeneous precipitation method. The structure and properties of the resultant materials were characterized by XRD, FTIR, UV-VIS and TG-DTA.
2) Photocatalytic activities of all samples were determined by analyzing the degradation of MO in the presence of the powdered suspensions.
3) Silver modification causes the material to show significant improvement in the photocatalytic activity. 3 % silver is considered the optimum concentration, which shows two times higher rate of degradation of dye than that of unmodified ZnO.
References
[1] AI Z H, LU L R, LI J P, ZHANG L Z, QIU J R, WU M H. Fe@Fe2O3 core-shell nanowires as iron reagent: 1 Efficient degradation of rhodamine B by a novel sono-fenton process [J]. J Phys Chem C, 2007, 111: 4087-4093.
[2] MA J H, SONG W J, CHEN C C, MA W H, ZHAO J C, TANG Y L. Fenton degradation of organic compounds promoted by dyes under visible irradiation [J]. Environ Sci Technol, 2005, 39: 5810-5815.
[3] AKOLEKAR D B, BHARGAVA S K, SHIRGOANKAR I, PRASAD J. Catalytic wet oxidation: An environmental solution for organic pollutant removal from paper and pulp industrial waste liquor [J]. Applied Catalysis A: General, 2002, 236: 255-262.
[4] ZHAN Y Z, LI H L, CHEN Y L. Copper hydroxyphosphate as catalyst for the wet hydrogen peroxide oxidation of azo dyes [J]. J Hazard Mater, 2010, 180: 481-485.
[5] LINSEBIGLER A L, LU G Q, YATES J T. Photocatalysis on TiO2 surfaces: Principles, mechanisms, and selected results [J]. Chem Rev, 1995, 95: 735-758.
[6] THOMPSON T L, YATES J T. Surface science studies of the photoactivation of TiO2―New photochemical processes [J]. Chem Rev, 2006, 106: 4428-4453.
[7] KHODJA A A, SEHILI T, PILICHOWSKI J F, BOULE P J. Photocatalytic degradation of 2-phenylphenol on TiO2 and ZnO in aqueous suspensions [J]. Photochem Photobiol A, 2001, 141: 231-239.
[8] DANESHVAR N, SALARI D, KHATAEE A R. Photocatalytic degradation of azo dye acid red 14 in water on ZnO as an alternative catalyst to TiO2 [J]. J Photochem Photobiol A, 2004, 162: 317-322.
[9] GOUVEA C A K, WYPYCH F, MORAES S G, DURAN N, NAGATA N, PERALTA-ZAMORA P. Semiconductor-assisted photocatalytic degradation of reactive dyes in aqueous solution [J]. Chemosphere, 2000, 40: 433-440.
[10] DINDAR B, ICLI S J. Unusual photoreactivity of zinc oxide irradiated by concentrated sunlight [J]. Photochem Photobiol A: Chem, 2001, 140: 263-268.
[11] KLOSEK S, RAFTERRY D. Visible light driven V-doped TiO2 photocatalyst and its photooxidation of ethanol [J]. J Phys Chem B, 2001, 105: 2815-2819.
[12] SAYAN B, GEDANKEN A. Microwave-assisted insertion of silver nanoparticles into 3-D mesoporous zinc oxide nanocomposites and nanorods [J]. J Phys Chem C, 2008, 112: 659-665.
[13] COLON G, MAICU M, HIDALGO M C, NAVIO J A. Cu-doped TiO2 systems with improved photocatalytic activity [J]. Appl Catal B, 2006, 67: 41-51.
[14] QIU X Q, LI L P, ZHENG J, LIU J J, SUN X F, LI G S. Origin of the enhanced photocatalytic activities of semiconductors: A case study of ZnO2 doped with Mg [J]. J Phys Chem C, 2008, 112: 12242-12248.
[15] BARICK KC, SINGH S, ASLAM M, BAHADUR D. Porosity and photocatalytic studies of transition metal doped ZnO nanoclusters [J]. Micro Meso Mater, 2010, 134: 195-202.
[16] ZHANG Y H, ZHENG L R, ZHAN Y G, LIN X Y, ZHENG Q, WEI K M. Ag/ZnO heterostructure nanocrystals: Synthesis, characterization, and photocatalysis [J]. Inorg Chem, 2007, 46: 6980-6986.
[17] HEIGHT M J, PRATSINIS S E, MEKASUWANDUMRONG O, PRASERTHDAM P. Ag-ZnO catalysts for UV-photodegradation of methylene blue [J]. Appl Catal B: Eniron, 2006, 63: 305-312.
[18] ZHANG Y, MU J. One-pot synthesis, photoluminescence, and photocatalysis of Ag/ZnO composites [J]. J Colloid Interface Sci, 2007, 309: 478-484.
[19] KUBO W, TATSUMA T. Photocatalytic remote oxidation with various photocatalysts and enhancement of its activity [J]. J Mater Chem, 2005, 15: 3104-3108.
[20] ZHANG Y, ZHANG Z Y, LIN B X, FU Z X, XU J. Effects of Ag doping on the photoluminescence of ZnO films grown on Si substrates [J]. J Phys Chem B, 2005, 41: 19200-19203.
[21] GUIN D, MANORAMA S V, LATHA J N L, SINGH S. Photoreduction of silver on bare and colloidal TiO2 nanoparticles/nanotubes: Synthesis, characterization, and tested for antibacterial outcome [J]. J Phys Chem C, 2007, 111: 13393-13397.
[22] PILLAISC, PERIYAT P, GEORAGE R, MCCORMACK D E, SEERY M K, HAYDEN H. Synthesis of high-temperature stable anatase TiO2 photocatalyst [J]. J Phys Chem C, 2007, 111: 1605-1611.
[23] JAYKRUSHNA D, DEEPA K, NONHYDROLYTI C. Route for synthesis of ZnO and its use as a recyclable photocatalyst [J]. J Phys Chem C, 2010, 114: 2544-2550.
[24] GEORGEKUTTY R, SEERY M K, PILLAI S C. A highly efficient Ag-ZnO photocatalyst: Synthesis, properties, and mechanism [J]. J Phys Chem C, 2008, 112: 13563-13570.
[25] ZHENG Y H, CHEN C Q, ZHAN Y Y, LIN X Y, ZHENG Q, WEI K M, ZHU J F. Photocatalytic activity of Ag/ZnO heterostructure nanocatalyst: Correlation between structure and property [J]. J Phys Chem C, 2008, 112: 10773-10777.
[26] LU W W, GAO S Y, WANG J J. One-pot synthesis of Ag/ZnO self-assembled 3D hollow microspheres with enhanced photocatalytic performance [J]. J Phys Chem C, 2008, 112: 16792-16800.
[27] SHAN Z C, WU J J, XU F F, HUANG F Q, DING H M. Highly effective silver/semiconductor photocatalytic composites prepared by a silver mirror reaction [J]. J Phys Chem C, 2008, 112: 15423-15428.
载银氧化锌多孔微棒的合成与光催化性能
贾志刚, 彭宽宽, 李艳华, 诸荣孙
安徽工业大学 化学与化工学院, 马鞍山 243002
摘 要:采用均匀沉淀法于80℃下水热2 h合成棒状掺银酒石酸锌,以此为前驱体通过直接热分解制备不同含银量的多孔载银氧化锌微米棒。利用X 射线衍射仪(XRD)、扫描电子显微镜(SEM)、透射电子显微镜(TEM)、紫外可见光谱(UV-VIS)和傅里叶红外光谱(FTIR)等手段对所得产物的结构和形貌进行表征,并进一步研究多孔载银氧化锌的光催化活性。结果表明:银的掺入提高了多孔氧化锌的光催化效率。掺杂量为3%(摩尔分数)的多孔氧化锌微棒的光催化效率最高,在120 min内可使80%的甲基橙降解,且在太阳光下显示良好的光催化活性。
关键词:Ag/ZnO;多孔材料;光催化性能;脱色
(Edited by LI Xiang-qun)
Foundation item: Project (20907001) supported by the National Natural Science Foundation of China; Project (KJ2010A336) supported by the University Natural Science Research Project of Anhui Province, China; Project (KJ2009A010Z) supported by the Educational Commission of Anhui Province, China
Corresponding author: JIA Zhi-gang; Tel: +86-13685553472; E-mail: zjchemyue@126.com
DOI: 10.1016/S1003-6326(11)61259-4

