Mg、Ag、Zn多元复合微合金化Al-Cu-Li合金在均匀化中的显微组织演变
来源期刊:中国有色金属学报(英文版)2016年第3期
论文作者:刘晴 朱瑞华 李劲风 陈永来 张绪虎 张龙 郑子樵
文章页码:607 - 619
关键词:Al-Cu-Li合金;均匀化;显微组织演变;Al7Cu2Fe;AlCuMn
Key words:Al-Cu-Li alloy; homogenization; microstructural evolution; Al7Cu2Fe; AlCuMn
摘 要:利用光学显微镜(OM)、差示扫描热分析法(DSC)、电子探针(EPMA)、X衍射(XRD)等研究手段分析Mg、Ag、Zn复合微合金化的Al-3.8Cu-1.28Li(质量分数,%)合金在均匀化过程中的组织转变。结果表明:合金的铸态组织中存在严重的枝晶偏析,此时合金中含有TB(Al7Cu4Li)、θ(Al2Cu)、R(Al5CuLi3)、S(Al2CuMg) 相以及少量的(Mg+Ag+Zn)复合相与AlCuFeMn相。当第二级均匀化时间为2 h时,第二相含量大幅度降低。随着均匀化时间的延长,TB、θ、R、S和(Mg+Ag+Zn)复合相能全部溶入基体,从而合金的枝晶偏析消除,且合金的均匀化过程可以用一指数方程描述。但是AlCuFeMn相似乎转变成Al7Cu2Fe 和AlCuMn相,其中Al7Cu2Fe的尺寸几乎不发生变化。
Abstract: The microstructural evolution of a Mg, Ag and Zn micro-alloyed Al-3.8Cu-1.28Li (mass fraction, %) alloy ingot during two-step homogenization was examined in detail by optical microscopy (OM), differential scanning calorimetry (DSC), electron probe micro-analysis (EPMA) and X-ray diffraction (XRD) methods. The results show that severe dendritic segregation exists in the as-cast ingot. There are many secondary phases, including TB (Al7Cu4Li), θ(Al2Cu), R(Al5CuLi3) and S(Al2CuMg) phases, and a small amount of (Mg+Ag+Zn)-containing and AlCuFeMn phases. The fractions of intermetallic phases decrease sharply after 2 h of second-step homogenization. By prolonging the second-step homogenization time, the TB,θ, R, S and (Mg+Ag+Zn)-containing phases completely dissolve into the matrix. The dendritic segregation is eliminated, and the homogenization kinetics can be described by a constitutive equation in exponential function. However, it seems that the AlCuFeMn phase is separated into Al7Cu2Fe and AlCuMn phases, and the size of Al7Cu2Fe phase exhibits nearly no change when the second-step homogenization time is longer than 2 h.
Trans. Nonferrous Met. Soc. China 26(2016) 607-619
Qing LIU1, Rui-hua ZHU1, Jin-feng LI1, Yong-lai CHEN2, Xu-hu ZHANG2, Long ZHANG1, Zi-qiao ZHENG1
1. School of Materials Science and Engineering, Central South University, Changsha 410083, China;
2. Aerospace Research Institute of Materials and Processing Technology, Beijing 100076, China
Received 22 April 2015; accepted 8 September 2015
Abstract: The microstructural evolution of a Mg, Ag and Zn micro-alloyed Al-3.8Cu-1.28Li (mass fraction, %) alloy ingot during two-step homogenization was examined in detail by optical microscopy (OM), differential scanning calorimetry (DSC), electron probe micro-analysis (EPMA) and X-ray diffraction (XRD) methods. The results show that severe dendritic segregation exists in the as-cast ingot. There are many secondary phases, including TB (Al7Cu4Li), θ(Al2Cu), R(Al5CuLi3) and S(Al2CuMg) phases, and a small amount of (Mg+Ag+Zn)-containing and AlCuFeMn phases. The fractions of intermetallic phases decrease sharply after 2 h of second-step homogenization. By prolonging the second-step homogenization time, the TB, θ, R, S and (Mg+Ag+Zn)-containing phases completely dissolve into the matrix. The dendritic segregation is eliminated, and the homogenization kinetics can be described by a constitutive equation in exponential function. However, it seems that the AlCuFeMn phase is separated into Al7Cu2Fe and AlCuMn phases, and the size of Al7Cu2Fe phase exhibits nearly no change when the second-step homogenization time is longer than 2 h.
Key words: Al-Cu-Li alloy; homogenization; microstructural evolution; Al7Cu2Fe; AlCuMn
1 Introduction
For high fuel efficiency and low operation cost, Al-Cu-Li alloys are widely used in aviation and aerospace industries because of their low density and high elastic modulus [1-3]. However, there is still an interest in developing the next generation of Al-Li alloy with improved specific strength, damage tolerance and reduced mechanical property anisotropy [4]. This interest comes from the fact that Li is the lightest metal in nature, and each 1% (mass fraction) Li added to the alloy contributes to about 3% density reduction and nearly 5% elastic modulus increase [5,6].
The as-cast microstructure, heat treatment, and subsequent processing have effects on the final microstructures and mechanical properties of Al-Cu-Li alloys. A considerable amount of undissolved secondary phases and dendritic segregation inevitably exist in the as-cast microstructure. The microstructural changes during homogenization influence the deformation, recovery and recrystallization behavior (i.e., grain size, grain morphology and crystallographic texture) during subsequent thermo-mechanical processing, e.g., high temperature extrusion [7-10]. Thus, the homogenization heat treatment is a primary and crucial step in manufacturing route for Al-Cu-Li alloys. Both industrial and academic research efforts have been made towards homogenization [11,12]. The as-cast ingot consists of a plenty of aluminum dendrites. Segregation is observed to occur at two levels: I) macrosegregation from the surface to the center of billet, over the length scale of hundreds of millimeters; II) microsegregation over the length scale of the average secondary dendritic arm spacing, typically in micrometers [10].
JIA et al [13] examined the 1469 Al-Cu-Li alloy with trace amount of Sc addition, which contained AlCu phase and (Mg+Ag)-containing non-equilibrium phase in the as-cast ingot. They limited to neglect the existence of Li because of its light mass. Alternatively, HEKMAT-ARDAKAN et al [14] have found that T1(Al2CuLi), θ and S phases presented under the solidification of AA2195 DC alloy. However, its phase evolution behavior during homogenization has not been investigated. JIA et al [15] and  et al [16] paid attention to the transformation process of primary eutectic structures to residual coarse constitutes, which provided a great idea to investigate the evolution behavior of Mg, Ag and Zn micro-alloyed Al-Cu-Li alloy during homogenization. There are two major microstructural changes during homogenization. The first is the transformation of constituent particles, in which the changes involve the diffusional transport of Cu, Li and Mg from the aluminum dendrites to the interdendritic region. The second which occurs in the as-cast material during homogenization is the formation of some small Fe-, Mn- and Cu-bearing particles. This process leads to a reduction in the level of super-saturation in the aluminum dendrites.
The present study aims to investigate the effect of a two-step homogenization heat treatment on the microstructure and composition distribution of a Mg, Ag, Zn micro-alloyed Al-Cu-Li alloy in detail. A high-temperature step of homogenization was applied to providing the complete dissolution of secondary phases and the uniform distribution of alloying elements within the Al matrix. Meanwhile, two major microstructural changes were examined during the whole homogenization process. A model [17-21] is often used for describing the concentrations of elements along the interdendritic region, but it is just an unbalanced view. So, the authors paid attention to the spacing (L) and thickness (m) of the interdendritic phase simultaneously, which would give a overall understanding of homogenization kinetic equation and dissolution time for the secondary phases. Those results can give indispensable information for optimizing the actual homogenization processing parameters.
2 Experimental
The composition of Al-Cu-Li alloy was Al-3.8Cu- 1.28Li-0.4Mg-0.4Ag-0.4Zn-0.3Mn-0.1Zr-0.05Ti
(mass fraction, %). Specimens with sizes of 12 mm × 12 mm × 15 mm were cut from the center of ingot with a width of 1.2 m and a thickness of 280 mm. A two-step homogenization was carried out. The first-step was performed at 470 °C for 8 h, and the second-step was performed at 510, 520, 530 and 540 °C for 24 h, respectively. At an optimized temperature of the second- step homogenization, the specimens were also homogenized for 0.5-36 h.
DSC analysis was carried out on an SDT-Q600 differential scanning calorimeter at a constant heating rate of 10 °C/min from 25 to 700 °C. XRD studies were performed on a D/max 2500PC diffractometer with Cu Kα1 radiation. A combination of optical microscopy (OM), scanning electron microscopy (SEM) and electron probe microanalysis (EPMA) was conducted to characterize the as-cast and homogenized microstructures. OM images were undertaken on a Leica DMILM optical microscope. SEM observation, in the backscattered electron imaging mode, was conducted on an FEI quanta 650FEG scanning electron microscope operated at 20 kV. EPMA was performed on a JEOL JXA-8230 electron probe microanalyzer operated at 15 kV. A quantitative X-ray wavelength dispersive spectroscope (WDS) system attached to the EPMA instrument was used to analyze the particles present in arbitrarily selected area in the as-cast and homogenized alloys.
3 Results and discussion
3.1 Characterization of as-cast microstructure
The XRD patterns of as-cast and homogenized alloys are shown in Fig. 1. In addition to the matrix α(Al), the main secondary phases in the as-cast ingot are TB and θ phases, and a small amount of S and R phases also can be detected. After the first-step homogenization at 470 °C for 8 h, the amount of TB and θ phases significantly decreases, while S phase seems to disappear. There are no other obvious diffraction peaks in the XRD patterns except for those of α(Al) after the second-step homogenization at 530 °C for 2 and 24 h, indicating that most TB and θ phases dissolve into the matrix α(Al).

Fig. 1 XRD patterns of as-cast and homogenized alloys
The optical micrograph of as-cast alloy is presented in Fig. 2(a). It consists of typically large, dendritic grains, of which the average size is 400-500 μm. Its back-scattered SEM image is shown in Fig. 2(b). Lots of coarse and continuous non-equilibrium phases are observed, exhibiting serious dendritic segregation, which requires further heat treatment process to eliminate them.
EPMA is used to verify the constitution of phases in the as-cast alloy. Large amounts of intermetallic phases with different colors are presented in Fig. 3(a), and their compositions detected by EPMA are shown in Table 1. In the grey intermetallic phase of point A, the molar ratio of Cu to Mg is close to 1:1, it is therefore considered as S phase. The white particle of point B mainly consists of Al and Cu elements, which is nearly the same to point C. Therefore, the particles marked as B and C are the same phase. In the particle marked as D, in addition to a mass of Al and Cu elements, the amount of other elements are almost the same as those of B (or C). However, these two particles can be distinctly distinguished because of well-defined difference in their color. The XRD detection indicates that the secondary phases of TB and θ exist. Meanwhile, the molar ratio of Al to Cu in particle D is about 2:1, and that in particle C is close to 7:4. In addition, it should be noted that Li element is difficult to be detected for its light mass. Hence, the white particles of B and C are identified as TB phase, while the particle D is believed to be θ phase.
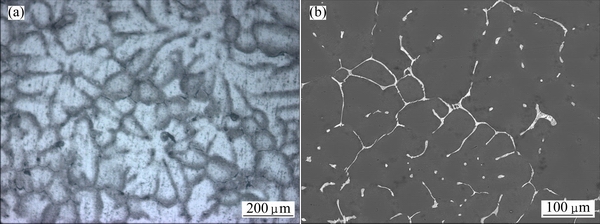
Fig. 2 OM image (a) and back-scattered SEM image (b) of as-cast alloy

Fig. 3 SEM images of intermetallic phases constitution in as-cast structure (a-c) and corresponding concentration profiles measured by EPMA along lines across coarse phases (d, e)
The composition distributions along the lines across the particles are shown in Figs. 3(d) and (e), respectively. The area marked with F in Fig. 3(b) can be easily distinguished. Its main composition is Al and Cu, but a small amount of Mg, Ag and Zn is also detected (Fig. 3(d)). As a result, this area is defined as (Mg+Ag+Zn)-containing non-equilibrium phase. The area G in Fig. 3(c) contains higher concentrations of Fe and Mn than surroundings, which means that the as-cast alloy also contains a small amount of AlCuFeMn phase.
HEKMAT-ARDAKAN et al [14] have established the isopleth diagram of Al-Cu-Li-Mg system with given contents of 1.05% Li and 0.28% Mg (mass fraction), which verified the existence of R phase. Although R phase is not detected in Fig. 3, it is observed in the XRD pattern. This may be due to its small size or low content. Hence, we can conclude that in the as-cast alloy, the secondary phases include TB, θ, S and R. There also exist a small amount of AlCuFeMn phase and (Mg+Ag+Zn)-containing phase.
Table 1 Compositions of particles in Fig. 3(a) measured by EPMA (mole fraction, %)
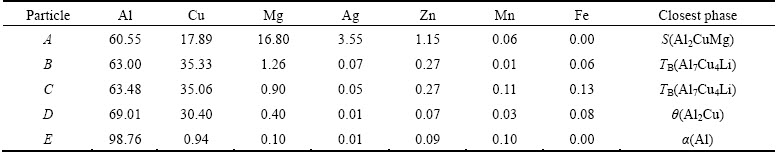
Table 2 Temperatures and enthalpy values to endothermic peaks of thermal analysis in Fig. 4
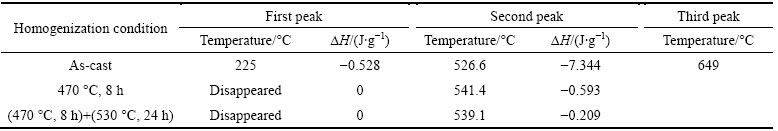

Fig. 4 DSC curve of as-cast alloy (a) and enlarged DSC curves of alloy with different homogenization in temperature range indicated by frame in (a) (b)
3.2 DSC analysis
The DSC curve of as-cast alloy is shown in Fig. 4(a), and Fig. 4(b) shows the enlarged DSC curves of alloy with different homogenization in the selected temperature range indicated by the frame in Fig. 4(a). The area under a given DSC peak relates to the volume fraction of phase, calculated qualitatively by its enthaply value. The peak temperature of a given reaction is dependent on the phase composition under the same condition. The temperatures and enthaply values, corresponding to different endothermic dissolution peaks, are shown in Table 2.
For the as-cast alloy, three endothermic peaks, sited at 225.2, 526.6 and 649.7 °C, respectively, are observed. The first endothermic peak at 225.2 °C disappears after the first-step homogenization at 470 °C for 8 h. It may be corresponding to the dissolution of some phase into the matrix totally during the first-step homogenization (Fig. 3(a)). The third endothermic peak sited at 649.7 °C always exists and is related to the melting point of alloy.
The second endothermic peak is associated with overburning and different with different homogenization processes. After the first-step homogenization, its temperature increases to 541.4 °C (Fig. 4(b)), which means that some secondary phases with low melting point dissolve into the matrix. After a further second-step homogenization at 530 °C for 24 h, it still exists at the same temperature site (Fig. 4(b)), but the corresponding enthaply value decreases (Table 2). This variation indicates that the intermetallic phases gradually dissolve into the matrix after the first-step and the second-step homogenization. According to the DSC analysis, it is therefore concluded that the upper limit temperature of the second step homogenization should be lower than 540 °C.
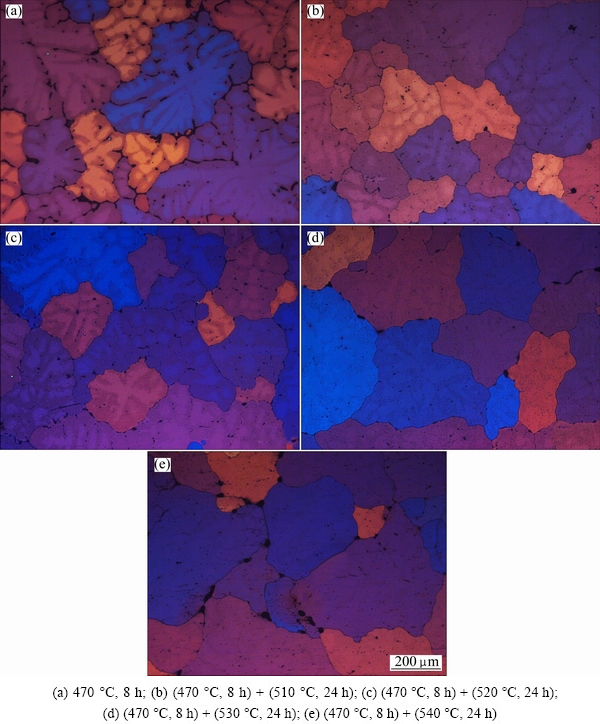
Fig. 5 OM images with cross-polarized light of alloy after different homogenization
3.3 Grain structures and segregation after homogenization
Figure 5 exhibits the OM images with cross-polarized light after different homogenization. After the first-step homogenization at 470 °C for 8 h, the dendritic grains are still clearly observed (Fig. 5(a)). After the second-step homogenization at 510 and 520 °C for 24 h, the dendritic structure is significantly reduced, as shown in Figs. 5(b) and (c), respectively, and the grain boundaries become thinner. When the second-step homogenization temperature is elevated to 530 °C, the dendritic structure disappears, and the grain boundaries become clear (Fig. 5(d)), indicating that the grain interior segregation is eliminated. As the second-step homogenization temperature is further elevated to 540 °C, the alloy is overburnt, which is characterized by the melting of local area both at the grain boundaries and triple conjunctions (Fig. 5(e)). This is in good accordance with the DSC results. Meanwhile, it is also found that the grains grow and their size is enlarged.
Figure 6 shows the SEM images and the elements mappings of Cu, Mg, Fe and Mn in the as-cast alloy and the alloy after the second-step homogenization at 530 °C for 24 h. In the as-cast alloy, a lot of coarse secondary phases are continuously distributed to form network structure. It is found that Cu element is enriched to form this continuous network structure, and Mg element is also enriched in some areas. This indicates that the main secondary phases formed during solidification are Cu-containing phase (TB, θ, R and S). In some local areas, Fe and Mn elements have a tendency to coexist, which corresponds to a small amount of Fe- and Mn-containing phase (AlCuFeMn). Meanwhile, it is difficult to distinguish the segregation of Ag and Zn elements due to their small content, their distribution images are therefore omitted.
After homogenization, the particle sizes of secondary phases greatly decrease, and their distribution becomes discontinuous. The segregation of Mg is eliminated, only small segregation of Cu, Fe and Mn exists in localized spots. It is manifested that the remained secondary phases after the second-step homogenization at 530 °C for 24 h are Cu-, Fe- and Mn-containing phases.

Fig. 6 SEM images (a1, b1) and elements mappings of Cu (a2, b2), Mg (a3, b3), Fe(a4, b4) and Mn (a5, b5) in as-cast alloy (a1-a5) and alloy after second-step homogenization at 530 °C for 24 h (b1-b5)
3.4 Phase constituent after homogenization
3.4.1 Phase constituent after first-step homogenization
Figure 7(a) shows the SEM image of alloy after the first-step homogenization. There still exist continuously distributed coarse particles. According to the WDS analysis, particles A and B in Fig. 7(a) are believed to be θ and TB phases, respectively. The chemical composition of particle C is of interest. The mole fraction of Cu is nearly 15%, while that of Mg is around 8%. Although its chemical composition is slightly close to that of detected S phase in the as-cast alloy, its Mg content is much lower. Therefore, we cannot define this particle as S phase simply. It can be classified as (Cu+Mg)-enriching non-equilibrium phase.
The composition distributions along the lines across some coarse particles are shown in Figs. 7(d) and (e). Two types of phases in Fig. 7(b) can be apparently distinguished because of well-defined difference in their color: the grey phase in the left part and the white part in the right part. According to the XRD pattern (Fig. 1), the molar ratio of Al to Cu as well as the detection difficulty of Li, the particles in the right and left are determined as TB phase and θ phase, respectively. Seen from Fig. 7(c), some areas contain higher contents of Mg, Ag and Zn than other areas. Meanwhile, some areas contain higher contents of Fe and Mn. Hence, according to the XRD detection and particle analysis, after the first-step homogenization, the remained secondary phases include TB, θ, R and (Cu+Mg)-enriching phase, AlCuFeMn phase and some (Mg+Ag+Zn)-contining phases.
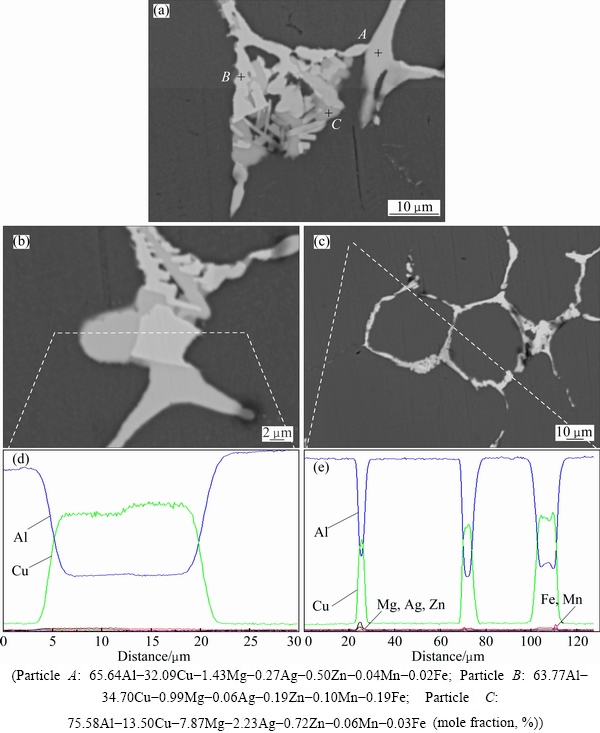
Fig. 7 SEM images (a-c) and corresponding concentration profiles measured by EPMA across coarse particles (d, e) in alloy after first-step homogenization
After the first-step homogenization, most phases partially dissolve, S phase disappears and a new (Cu+Mg)-enriching phase forms. This new phase may be related to the original S phase. It was reported that the diffusion coefficient of Cu in Al alloy was much lower than that of Mg [21]. During the dissolution of S phase into the matrix, Mg atoms may move to the matrix faster than Cu atoms, which results in the formation of (Cu+Mg)-enriching non-equilibrium phase.
3.4.2 Phase constituent after second-step homogenization at 530 °C
The back-scattered SEM images after the second- step homogenization at 530 °C for different time are shown in Fig. 8. The particle compositions detected from quantitative X-ray WDS analysis are given in Table 3. After the second-step homogenization at 530 °C for 0.5 h (Figs. 8(a) and (b)), the intermetallic compounds gradually dissolve into the matrix, resulting in that the elongated parts shrink and break off (as indicated by the arrows in Fig. 8(a)). Four types of secondary phases (particles A, B, C and D) are observed and detected. In Table 3, particles A and B are identified as TB phase and θ phase, respectively. As for particle C, according to the WDS analysis, the molar ratio of Cu to Fe is about 2:1. Therefore, we consider that it is Al7Cu2Fe phase. While particle D is identified as AlCuMn phase. When the second-step homogenization time extends to 2 h, the phase types do not change, but the amount of intermetallic compounds further decreases and the network structures of secondary phases become thinner and more discontinuous. According to the composition analysis of particles in Figs. 3(a), 7(a), 8(a) and 8(c), the disappearance rate of TB phase is much faster than that of θ phase. Meanwhile, the R phase is not detected by the XRD pattern (Fig. 1) after the second-step homogenization at 530 °C for 2 h.
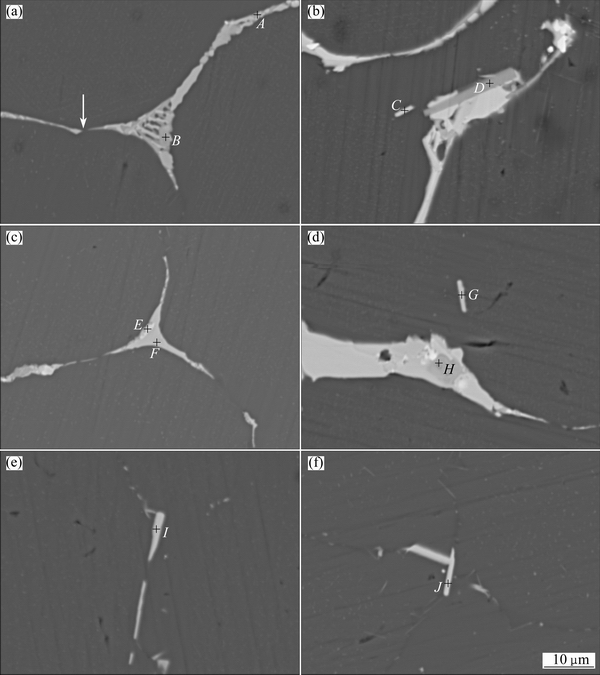
Fig. 8 SEM images of alloy after second-step homogenization at 530 °C for 0.5 h (a, b), 2 h (c, d), 8 h (e) and 24 h (f)
Table 3 Chemical compositions of particles in Fig. 8 (mole fraction, %)
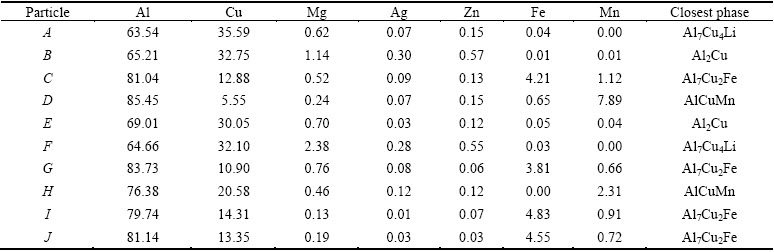
During the second-step homogenization, TB, θ, R and (Cu+Mg)-enriching non-equilibrium phases gradually dissolve into the matrix, and finally disappear after 24 h of second-step homogenization. However, Al7Cu2Fe phase (arrowed as C, G, I and J) always exists though the second-step homogenization time is extended. This indicates that Al7Cu2Fe phase is an indissolvable impurity intermetallic phase, and cannot be eliminated by homogenization treatment. In Fig. 1, Al7Cu2Fe phase is not detected by the XRD pattern because of its low content.
The area fraction of residual secondary phase is analyzed using an image tool software-Image pro plus. At least five back-scattered SEM images are used for every homogenization time at 530 °C. The average statistical area fraction of secondary phases after homogenization is shown in Fig. 9. After the first-step homogenization, the area fraction firstly decreases sharply from 10.4% in the as-cast alloy to 5.5%. Then, it still reduces rapidly to 1.1% within the initial 2 h of second-step homogenization at 530 °C. As the second-step homogenization time is further extended to 36 h, there is only a little decrease of fraction.
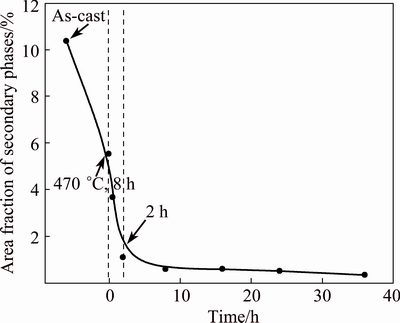
Fig. 9 Average statistical area fraction of secondary phases as function of second-step homogenization time at 530 °C
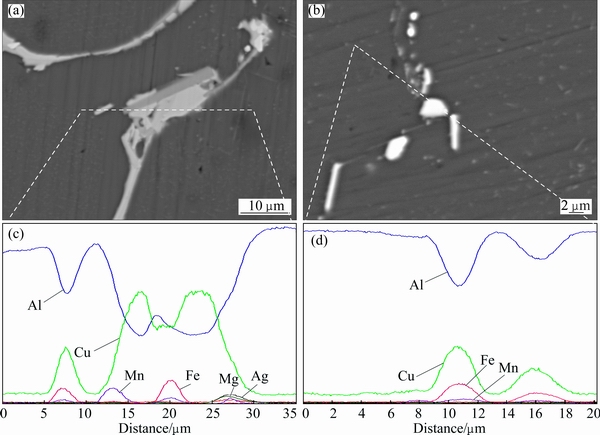
Fig. 10 SEM images (a, b) and corresponding concentration profiles along lines across coarse particles (c, d) after second-step homogenization at 530 °C for 0.5 h (a, c) and 24 h (b, d)
3.4.3 Evolution of trace amount of intermetallic phases during homogenization process
Compared wiht TB, θ, S and R phases, the amount of (Mg+Ag+Zn)-containing phase and AlCuFeMn phase is much smaller. Their evolution is different during the homogenization process. Figure 10 shows the high magnification of back-scattered SEM images (Figs. 10(a) and (b)) and the corresponding compositions distribution along the lines across the coarse particles after the second-step homogenization at 530 °C for 0.5 and 24 h. (Mg+Ag+Zn)-containing phase forms in the as-cast ingot (Fig. 3(b)), and after the first-step homogenization, it still exists. From Fig. 10(a), it can be seen that Mg, Ag and Zn coexist in the right part, indicating that the (Mg+Ag+Zn)-containing phase does not completely dissolve after the second-step homogenization at 530 °C for 0.5 h. However, it totally dissolves into the matrix when the second-step homogenization time is extended to 24 h (Figs. 8(f) and 10(b)).
In the as-cast alloy and the alloy after the first-step homogenization, it is found that Fe and Mn coexist in Figs. 3(c) and 7(c). However, the coexistence effect of Fe and Mn is largely weakened after the first-step homogenization. After the second-step homogenization at 530 °C, the elements of Fe and Mn are separated and appear in different intermetallic phases, respectively (Figs. 10(c) and (d)). In addition, the Fe-containing phase is believed to be Al7Cu2Fe phase and the Mn-containing phase is identified as AlCuMn phase (Table 3).
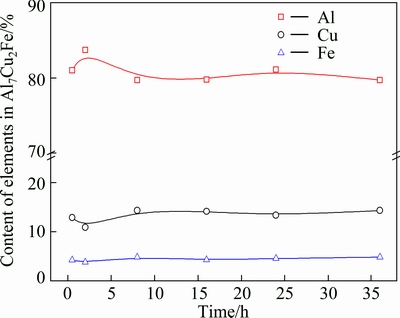
Fig. 11 Compositions of Al7Cu2Fe type phase as function of second-step homogenization time at 530 °C
Table 4 Sizes of Al7Cu2Fe after different time of second-step homogenization at 530 °C
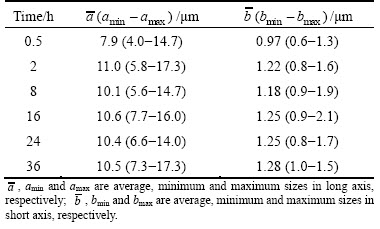
One purpose of homogenization is to make the soluble secondary phases formed during solidification dissolve into the matrix. As summarized above, most of secondary phases dissolve into the matrix gradually, and after the second-step homogenization at 530 °C for 24 h, they completely disappear. Only a small amount of Fe-bearing phase Al7Cu2Fe still exists until the second step holding time is extended to 36 h. Its composition as a function of the second-step homogenization time at 530°C is given in Fig. 11. The fractions of Al, Cu and Fe elements are basically stable. Its statistical size during homogenization is shown in Table 4. After 0.5 h of second-step homogenization at 530 °C, the average sizes are 7.9 and 0.97 μm in the long and short axes, respectively. When the second-step homogenization time prolongs to 2 h, the average size in the long axis ( ) increases from 7.9 to 11.0 μm, while that in the short axis (
 ) increases from 0.97 to 1.22 μm. However, it should be noted that the size ratio of long axis to that of short axis is stable. Then, it remains stable with further prolonging the homogenization time to 36 h. The above results indicate that homogenization does not have a significant influence on the content, size and morphology of the Fe-bearing phase Al7Cu2Fe. As suggested by DENG et al [18] and FAN et al [23], Al7Cu2Fe cannot be eliminated through homogenization treatment.
3.5 Homogenization kinetic analysis
As shown in Fig. 3, the distribution of main alloying elements along the interdendritic region varies periodically. As marked in Fig. 6(a), the spacing (L) and thickness (m) of interdendritic phases are therefore used to describe their distribution in the first-step homogenized alloy. Nearly 96% of the interdendritic spacing L is less than 85 μm while the maximum L is about 95 μm (Fig. 12(a)). Most of the interdendritic phase thickness m is between 2 and 5 μm while the maximum m is about 6.0 μm (Fig. 12(b)).
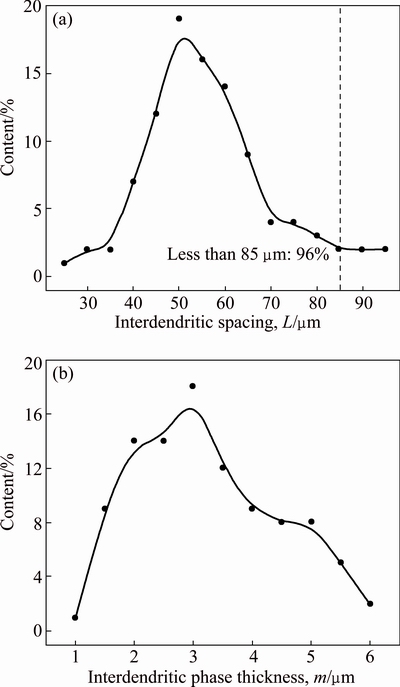
Fig. 12 Spacing (a) and thickness (b) of interdendritic phase of alloy after first-step homogenization at 470 °C for 8 h
It is feasible to use Fourier series components in a cosine function (Eq. (1)) to approach the initial concentrations of elements along the interdendritic region due to their periodical distribution [24]:
 (1)
(1)
where  is the average concentration of element, L is the interdendritic spacing and A0 is the initial amplitude of composition segregation which can be expressed as
 (2)
(2)
where △c0 is the concentration difference between the grain (or dendrites) boundary and grain. According to the second Fick’s law and the boundary (or dendrites) conditions, during the second-step homogenization, the amplitude of composition segregation A(t) is given as [25]
 (3)
(3)
where t is the homogenization time, D is the diffusion coefficient which is described as follow:
 (4)
(4)
Therefore, Eq. (3) can be rewritten as
 (5)
(5)
where T is the homogenization temperature, R, D0 and Q are the gas constant, diffusion constant and diffusion activation energy, respectively.
Assuming that the element distribution is homogeneous when the composition segregation amplitude reduces to 1% [18], i.e.,
 (6)
(6)
Then, the corresponding equation describing the homogenization kinetic can be expressed as
 (7)
(7)
For a given alloy, the values of D0 and Q can be obtained. Hence, the corresponding kinetic curve can be simulated. It was reported that the diffusion coefficient of Cu element in Al alloy was much lower than those of Mg and Zn at the same time [22], and from the element distribution results in Fig. 6, similar qualitative conclusion also can be drawn. Therefore, the homogenization kinetic during the second-step process is mainly controlled by the diffusion of Cu. The diffusion constant (D0) and diffusion activation energy (Q) of Cu in Al alloy are D0(Cu)=0.084 cm2/s and Q(Cu)=136.8 kJ/mol [26]. The homogenization kinetic curves of the interdendritic phase with different spacings are therefore plotted, as shown in Fig. 13(a). It is quite clear that with the increase of interdendritic phase spacing, higher temperature and longer time are necessary for homogenization. Moreover, temperature has a more significant influence on the homogenization than time. However, according to the DSC analysis, the homogenization temperature should not exceed 540 °C. Therefore, at a chosen second-step homogenization temperature of 530 °C, the complete homogenization time as a function of spacing L is plotted in Fig. 13(b). It increases with increasing the spacing L, and the complete homogenization time for interdendritic phase with spacings of 85 and 95 μm are 22.1 and 27 h, respectively. As mentioned above, the spacing of more than 96% interdendritic phase is less than 85 μm, the corresponding second-step homogenization at 530 °C is therefore about 22.1 h. It is in good accordance with the observation that the segregation of alloying elements Cu and Mg is almost eliminated after 24 h of second-step homogenization.
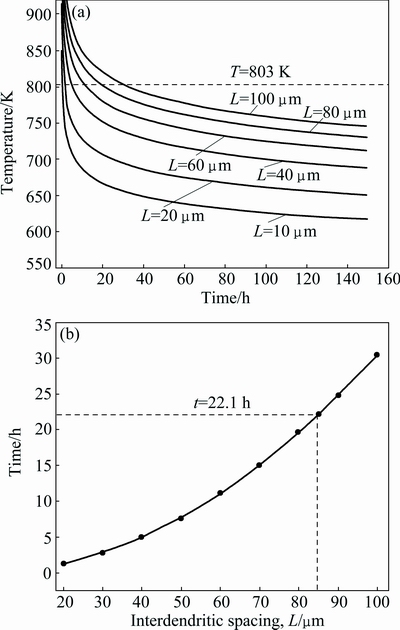
Fig. 13 Homogenization kinetic curves for different phase spacings (a) and homogenization time as function of spacing at 530 °C (b)
The effect of dendritic thickness (m) on the dissolution time of non-equilibrium dendritic phases τs can be expressed as [26]
τs=amb (8)
where a and b are the constants.
From Eq. (8), it is apparent that a little increase of dendritic thickness (m) will significantly increase the time for complete homogenization. In the present work, the dendritic thickness is between 0.8 and 6.0 μm. In Al alloy, the value of b is usually varied from 1.5 to 2.5 [27]. The dissolution time for 6.0 μm particles will be about 55 times that for 0.8 μm particles if b=2 is adopted. Therefore, the dendritic phases with small thickness first break off in Figs. 8(a) and (c), leading to the discontinuous distribution of dendritic phases, while it will take a much longer time for the dendritic phases with large thickness to be fully dissolved.
4 Conclusions
1) Serious dendritic segregation exists in the as-cast ingot. The main elements Cu and Mg are largely enriched at the grain boundaries or in dendrites. The secondary phases in the as-cast ingot include TB, θ, R and S. Meanwhile, a small amount of (Mg+Ag+Zn)- containing phase and AlCuFeMn phase are found.
2) The evolution of secondary phases during homogenization is as follows. S phase dissolves into the matrix and (Cu+Mg)-enriching no-equilibrium phase forms after the first-step homogenization. By prolonging the second-step homogenization time, the TB, θ, R, (Cu+Mg)-enriching no-equilibrium phase and (Mg+Ag+Zn)-containing phase can completely dissolve into the matrix and the rate of dissolution of TB is much faster than that of θ. The dendritic segregation is eliminated. However, it seems that the AlCuFeMn phase is separated to Al7Cu2Fe and AlCuMn phases.
3) Insoluble Al7Cu2Fe intermetallic phase exhibits nearly no change in size, morphology and content when the second-step homogenization time increase from 2 to 36 h.
4) The proper homogenization process is (470 °C, 8 h) + (530 °C, 24 h), which is consistent with the results of homogenization kinetic analysis.
References
[1] RIOJA R J, LIU J. The evolution of Al-Li base products for aerospace and space applications [J]. Metallurgical Materials Transaction A, 2012, 43(9): 3325-3337.
[2] LI Jin-feng, ZHENG Zi-qiao, REN Wen-da, CHEN Wen-jing, ZHAO Xu-shan, LI Shi-chen. Simulation on function mechanism of T1(Al2CuLi) precipitate in localized corrosion of Al-Cu-Li alloys [J]. Transactions of Nonferrous Metals Society of China, 2006, 16(6): 1268-1273.
[3] YOSHIMURA R, KONNO T J, ABE E, HIRAGA K. Transmission electron microscopy study of the evolution of precipitates in aged Al-Cu-Li alloys: The θ and T1 phases [J]. Acta Materialia, 2003, 15(14): 4251-4266.
[4] FRAGOMENI R, WHEELER R, JATA K V. Effect of single and duplex aging on precipitation response, microstructure, and fatigue crack behavior in Al-Li-Cu alloy AF/C-458 [J]. J Materi Eng Perform, 2005, 14: 18-27.
[5] EDDAHBI M, THOMSON C B, CARRENO F, RUANO O A. Grain structure and microtexture after high temperature deformation of an Al-Li (8090) alloy [J]. Materials Science and Engineering A, 2000, 284: 292-300.
[6] LI Hong-ying, TANG Yi, ZENG Zai-de, ZHENG Feng. Exfoliation corrosion of T6- and T8-aged AlxCuyLiz alloy [J]. Transactions of Nonferrous Metals Society of China, 2008, 18(4): 778-783.
[7] WU Ling-mei, WANG Wen-hsiung, HSU Yong-fu, TRONG Shan. Effect of homogenization treatment on recrystallization behavior and dispersoid distribution in an Al-Zn-Mg-Sc-Zr alloy [J]. Journal of Alloys and Compounds, 2008, 456: 163-169.
[8] TOTIK Y, SADELER R, KAYMAZ I, GAVGALI M. The effect of homogenization treatment on cold deformations of AA 2014 and AA 6063 alloys [J]. Journal of Materials Processing Technology, 2004, 147: 60-64.
[9] YANG Z, LI J P, ZHANG J X, GUO Y C, WANG B W, XIA F, LIANG M X. Effect of homogenization on the hot-deformation ability and dynamic recrystallization of Mg-9Gd-3Y-0.5Zr alloy [J]. Materials Science and Engineering A, 2009, 15: 102-107.
[10] DU Q, POOLE W J, WELLS M A, PARSON N C. Microstucture evolution during homogenization of Al-Fe-Mg-Si alloys: Modeling and experimental results [J]. Acta Materialia, 2013, 61: 4961-4973.
[11] LI Hong-yin, SU Xiong-jie, YIN Hao, HUANG De-sheng. Microstructural evolution during homogenization of Al-Cu-Li- Mn-Zr-Ti alloy [J]. Transactions of Nonferrous Metals Society of China, 2013, 23(9): 2543-2550.
[12] ZHANG F, SHEN J, YAN X D, SUN J L, YANG Y. Homogenization heat treatment of 2099 Al-Li alloy [J]. Rare Met, 2014, 33: 28-36.
[13] JIA Min, ZHENG Zi-qiao, GONG Zhu. Microstructure evolution of the 1469 Al-Cu-Li-Sc alloy during homogenization [J]. Journal of Alloys and Compounds, 2014, 614: 131-139.
[14] HEKMAT-ARDAKAN A, ELGALLAD E M, AJERSCH F, CHEN X G. Microstructural evolution and mechanical properties of as-cast and T6-treated AA2195 DC alloy [J]. Materials Science and Engineering A, 2012, 558: 76-81.
[15] JIA P F, CAO Y H, GENG Y D, HE L Z. Effect of d.c. current on the phase transformation in 7050 alloy during homogenization [J]. Materials Characterization, 2014, 96: 21-27.
[16] T, POPOVIC M, ROMHANJI E. Microstructure evolution of a modified AA5083 aluminum alloy during a multistage homogenization treatment [J]. Materials Characterization, 2012, 65: 16-27.
[17] LI Wen-bin, PAN Qing-lin, XIAO Yan-ping, HE Yun-bin, LIU Xiao-yan. Microstructural evolution of ultra-high strength Al-Zn-Cu-Mg-Zr containing Sc during homogenization [J]. Transactions of Nonferrous Metals Society of China, 2011, 21(10): 2127-2133.
[18] DENG Ying, YIN Zhi-min, CONG Fu-guan. Intermetallic phase evolution of 7050 aluminum alloy during homogenization [J]. Intermetallics, 2012, 26: 114-121.
[19] LIU Xiao-yan, PAN Qing-lin, FAN Xi, HE Yun-bin, LI Wen-bin. Microstructural evolution of Al-Cu-Mg-Ag alloy during homogenization [J]. Journal of Alloys and Compounds, 2009, 484: 790-794.
[20] ROBSON J D, PRANGNELL P B. Modelling Al3Zr dispersoid precipitation on multicomponent aluminium alloys [J]. Materials Science and Engineering A, 2003, 352: 240-250.
[21] SAMARAS S N, HAIDEMENOPOULOS G H. Modelling of microsegregation and homogenization of 6061 extrudable aluminuim alloys [J]. Journal of Materials Processing Technology, 2007, 194: 63-73.
[22] ROKHLIN L L, DOBTKINA T V, BOCHVAR N R, LYSOVA E V. Investigation of phase equilibrium alloys of the Al-Zn-Mg-Cu- Zr-Sc system [J]. Journal of Alloys and Compounds, 2004, 367: 10-16.
[23] FAN Xi-gang, JIANG Da-ming, MENG Qing-chang, ZHONG Li. The microstructural evolution of an Al-Zn-Mg-Cu alloy during homogenization [J]. Materials Letters, 2006, 16: 1475-1479.
[24] SHEWMON P. Diffusion in solids [M]. New York: Wiley, 2013.
[25] LIU X T, CUI J Z. Study on the diffusion kinetics of aluminum alloy cast during homogenization treatment [J]. Materials Review, 2004, 18: 102-104.
[26] LIU Yan, JIANG Da-ming, XIE Wen-long, HU Jie, MA Bo-ran. Solidification phases and their evolution during homogenization of a DC cast Al-8.35Zn-2.5Mg-2.25Cu alloy [J]. Materaials Characterization, 2014, 93: 173-183.
[27] MONDOLFO L F. Aluminum alloy: Structure and properties [M]. London, UK: Butterworths, 1976.
刘 晴1,朱瑞华1,李劲风1,陈永来2,张绪虎2,张 龙1,郑子樵1
1. 中南大学 材料科学与工程学院,长沙 410083;
2. 航天材料及工艺研究所,北京 100076
摘 要:利用光学显微镜(OM)、差示扫描热分析法(DSC)、电子探针(EPMA)、X衍射(XRD)等研究手段分析Mg、Ag、Zn复合微合金化的Al-3.8Cu-1.28Li(质量分数,%)合金在均匀化过程中的组织转变。结果表明:合金的铸态组织中存在严重的枝晶偏析,此时合金中含有TB(Al7Cu4Li)、θ(Al2Cu)、R(Al5CuLi3)、S(Al2CuMg) 相以及少量的(Mg+Ag+Zn)复合相与AlCuFeMn相。当第二级均匀化时间为2 h时,第二相含量大幅度降低。随着均匀化时间的延长,TB、θ、R、S和(Mg+Ag+Zn)复合相能全部溶入基体,从而合金的枝晶偏析消除,且合金的均匀化过程可以用一指数方程描述。但是AlCuFeMn相似乎转变成Al7Cu2Fe 和AlCuMn相,其中Al7Cu2Fe的尺寸几乎不发生变化。
关键词:Al-Cu-Li合金;均匀化;显微组织演变;Al7Cu2Fe;AlCuMn
(Edited by Mu-lan QIN)
Foundation item: Project (2013JSJJ0001) supported by Teachers’ Research Found, China; Project (2013AA032401) supported by the National High Technology Research and Development Program of China; Project supported by the Nonferrous Metal Oriented Advanced Structural Materials and Manufacturing Cooperative Innovation Center, China
Corresponding author: Jin-feng LI; Tel: +86-731-8830270; E-mail: lijinfeng@csu.edu.cn
DOI: 10.1016/S1003-6326(16)64149-3

