Gas-liquid mass transfer of carbon dioxide capture by magnesium hydroxide slurry in a bubble column reactor
来源期刊:中南大学学报(英文版)2019年第6期
论文作者:李立清 谢鹏飞 何志成 苏长青
文章页码:1592 - 1606
Key words:mass transfer; CO2 capture; magnesium hydroxide; bubble column
Abstract: Magnesium hydroxide (Mg(OH)2) has been considered as a potential solvent for CO2 removal of coal-fired power plant and biomass gas. The chemistry action and mass to transfer mechanism of CO2-H2O-Mg(OH)2 system in a slurry bubble column reactor was described, and a reliable computational model was developed. The overall mass transfer coefficient and surface area per unit volume were obtained using experimental approach and simulation with software assistance. The results show that the mass transfer process of CO2 absorbed by Mg(OH)2 slurry is mainly liquid-controlled, and slurry concentration and temperature are main contributory factors of volumetric mass transfer coefficient and liquid side mass transfer coefficient. High concentration of CO2 has an adverse effect on its absorption because it leads to the fast deposition of MgCO3·3H2O crystals on the surfaces of unreacted Mg(OH)2 particles, reducing the utilization ratio of magnesium hydroxide. Meanwhile, high CO32– ion concentration limits the dissolution of MgCO3 to absorb CO2 continually. Concentration of 0.05 mol/L Mg(OH)2, 15% vol CO2 gas and operation temperature at 35 °C are recommended for this CO2 capture system.
Cite this article as: XIE Peng-fei, LI Li-qing, HE Zhi-cheng, SU Chang-qing. Gas-liquid mass transfer of carbon dioxide capture by magnesium hydroxide slurry in a bubble column reactor [J]. Journal of Central South University, 2019, 26(6): 1592-1606. DOI: https://doi.org/ 10.1007/s11771-019-4115-6.

ARTICLE
J. Cent. South Univ. (2019) 26: 1592-1606
DOI: https://doi.org/ 10.1007/s11771-019-4115-6

XIE Peng-fei(谢鹏飞), LI Li-qing(李立清), HE Zhi-cheng(何志成), SU Chang-qing(苏长青)
School of Energy Science and Engineering, Central South University, Changsha 410083, China
 Central South University Press and Springer-Verlag GmbH Germany, part of Springer Nature 2019
Abstract: Magnesium hydroxide (Mg(OH)2) has been considered as a potential solvent for CO2 removal of coal-fired power plant and biomass gas. The chemistry action and mass to transfer mechanism of CO2-H2O-Mg(OH)2 system in a slurry bubble column reactor was described, and a reliable computational model was developed. The overall mass transfer coefficient and surface area per unit volume were obtained using experimental approach and simulation with software assistance. The results show that the mass transfer process of CO2 absorbed by Mg(OH)2 slurry is mainly liquid-controlled, and slurry concentration and temperature are main contributory factors of volumetric mass transfer coefficient and liquid side mass transfer coefficient. High concentration of CO2 has an adverse effect on its absorption because it leads to the fast deposition of MgCO3·3H2O crystals on the surfaces of unreacted Mg(OH)2 particles, reducing the utilization ratio of magnesium hydroxide. Meanwhile, high CO32– ion concentration limits the dissolution of MgCO3 to absorb CO2 continually. Concentration of 0.05 mol/L Mg(OH)2, 15% vol CO2 gas and operation temperature at 35 °C are recommended for this CO2 capture system.
Key words: mass transfer; CO2 capture; magnesium hydroxide; bubble column
Cite this article as: XIE Peng-fei, LI Li-qing, HE Zhi-cheng, SU Chang-qing. Gas-liquid mass transfer of carbon dioxide capture by magnesium hydroxide slurry in a bubble column reactor [J]. Journal of Central South University, 2019, 26(6): 1592-1606. DOI: https://doi.org/ 10.1007/s11771-019-4115-6.
1 Introduction
CO2 has attracted global attention on climate change and been widely discussed as a special kind of pollutant. Coal-fired power plant and biomass gas are the main sources of carbon dioxide emissions, different fuel varieties and carbon contents lead to the difference of CO2 partial pressure in flue gas. The proportion of CO2 in the flue gas of coal-fired power plants accounts for 10%–20% and biomass gas for 12%–30%, which is adverse to combustion and decreases calorific value [1, 2]. In these carbon capture and sequestration (CCS) technologies, chemical absorption is regarded as the most direct and efficient way [3]. Monoethanolamine (MEA), ammonia and potassium carbonate (K2CO3) are common absorbent selections for CO2 capture, but they all have defects of varying degrees, such as the corrosivity and toxicity of MEA solution and high energy consumption [4], high running cost [5], the high volatile nature of ammonia [6] and the precipitation of ammonia carbonate salts [7]. Academia and industry are still studying new decarbonizing agents with low energy consumption, high capture rate and low cost. Mg(OH)2 is referred as CO2 capture agent for its low price, relatively low energy consumption and property of not easy to encrust [8].Wet magnesium method decarbonization technology is derived from limestone and dolomite wet desulphurization technology in flue gas desulfurization (FGD) [8]. Its basic principle is that Mg(OH)2, as decarbonization agent, absorbs carbon dioxide and converts it into magnesium bicarbonate solution, which is heated in the desorption tower to regenerate magnesium hydroxide over and over again. The bubble column reactor is widely used for mass transfer and chemical reactions of wet magnesium method decarbonization because of its simple structure and excellent performance [9]. Through gas bubbler installed at the bottom of the bubble column, CO2 gas is dispersed into small bubbles, then reacts with Mg(OH)2 slurries to enhance the absorption efficiency, which is equivalent to reducing mass transfer resistance when it applies to industrial production. Therefore, it is essential to study the mass transfer process of the CO2-H2O-Mg(OH)2 system. In general, the presence of chemical reactions will enhance mass transfer of the liquid-solid interface, and gas-liquid interfacial mass transfer becomes the determining step of the transfer process [10]. A continuous bubble column scrubber was used to capture CO2 gas by using a NaOH solution under a constant pH operation, the higher values of overall mass-transfer coefficient and absorption efficiency were required to give smaller gas-liquid molar rate ratio [11]. Absorption of CO2 into Piperazine (Pz) solution was investigated by PASHAEI et al [12], total gas phase mass transfer coefficient (Kg) and liquid side mass transfer coefficient increases with the Piperazine concentration and CO2 partial pressure. Most studies on the mass transfer behavior were limited to determine the volumetric mass transfer coefficient, Kga. Nevertheless, the volumetric mass transfer coefficient was not enough to describe the mass transfer mechanism [13]. Further, the calculation of mass transfer rate and specific surface area of phase boundary is helpful to understand the limiting factors of mass transfer process.
Therefore, the purpose of this study is to 1) investigate the gas-liquid mass transfer mechanism with chemical reactions in the absorption process of CO2-H2O-Mg(OH)2 system, 2) calculate the gas/liquid side mass transfer coefficient for determining which resistance controls, and 3) evaluate the influences of different reaction conditions on the absorption rate.
2 Experimental
The absorption experimental setup consisted of five parts: 1) simulated gas generation; 2) flow control; 3) bubble column reactor; 4) gas sampling and analysis; 5) data acquisition. The experimental setup is shown schematically in Figure 1.

Figure 1 Schematic of experimental setup (1—Bubble column; 2—Mass flow controller; 3—Buffer gas bottle; 4—Valve; 5—Valve; 6—Water bath; 7—Magnetic stirrer; 8—Dryer; 9—Filter; 10—NDIR CO2 analyzer; 11—Data acquisition system)
A cylindrical glass vessel with height of 27 cm, diameter of 7 cm was used as the main body of bubble column reactor. The bubble column was placed in an electro-thermostatic water bath, and sat on the magnetic stirrer which allowed magnetic mixing to be applied to the fluid inside the column. A porous plate gas distributor (pore size 0.5–3 mm) was installed at the bottom of the column as the gas bubbler.
The simulated gas was produced by mixing pure N2 gas with pure CO2 gas (high purity >99.99%, Changsha Gaoke Gas Inc., China). Both gas streams were controlled by mass flow controllers to get required CO2 concentrations. Then the gas stream was charged into a buffer gas bottle in order to be well mixed and minimize the fluctuation of the gas pressure. The Mg(OH)2 (reagent class, purity>98%, Xilong Chemistry Inc., China) slurries in the bubble column were maintained at 1 L, and the gas volumetric flow rate was maintained at 1 L/min. The outlet gas absorbed by the bubble firstly passed through an ice-salt bath to remove water vapor, then all particles were removed by a filter before the gas stream went into the infrared gas analyzer (Gasboard-3100, Suzhou Chemical Engineering Instrument Inc., China; range: CO2 0 to 50% vol; accuracy ±1% of full-scale; repeatability error: ≤1%; recommended gas flow rate: 0.7-1.2 L/min). The infrared gas analyzer was periodically calibrated before every set of experiments.
Table 1 Experiment conditions

The viscosity and surface tension of Mg(OH)2 slurries were measured by using Engler viscometer (RPNE-1A, Ruipu Instrument Inc.) and automatic tension tester (JK99B, Shanghai Powereach Inc.). The Engler viscosity refers to the ratio of time, which is a certain volume of sample flowing out from viscometer with that of distilled water at 20 °C. Each data was measured three times and averaged.
The results showed that the viscosity and surface tension of Mg(OH)2 slurries are similar to that of distilled water within the operating conditions of this experiment (temperature 20–50 °C, Mg(OH)2 concentration 0.025–0.1 mol/L).
3 Mass transfer model
3.1 Reaction mechanism of CO2-H2O-Mg(OH)2 system
The absorption process is generally represented as two steps: Mg(OH)2 slurries absorbs CO2 and converts it into MgCO3, and MgCO3 further absorbs CO2 and converts it into Mg(HCO3)2. The following overall reactions are given:
 (1)
(1)
 (2)
(2)
Although the overall reactions are simple, the chemistry is quite complex. The sequence of all the ionic reactions involved is as follows:
 (3)
(3)
 (4)
(4)
 (5)
(5)
 (6)
(6)
 (7)
(7)
 (8)
(8)
 (9)
(9)
 (10)
(10)
Figure 2 demonstrates the mass transfer schematic of the system. Turbulent flow fully develops within the mainstream; as a result, the mainstream has a constant concentration of substances. The turbulence slowly reduces within turbulent boundary layer where mass is transferred totally by turbulent eddy. In the stagnation layer which is closer to the interface, turbulent eddy has become so weak that the momentum provided by molecular viscosity passes it, and the flow tends to become laminar flow. However, much of mass transfer inside of this layer is still depending on turbulent diffusion because of the fact that the molecular diffusion coefficient is typically three orders for magnitude smaller than the eddy diffusion coefficient. Only in the diffusion layer, the molecular diffusion dominates the mass transfer.
Table 2 Viscosity and surface tension of Mg(OH)2 slurries under different experiment conditions
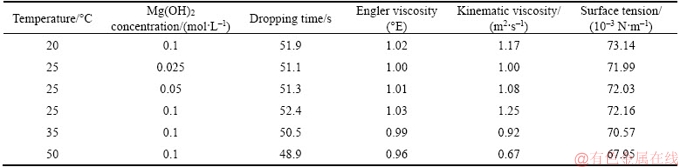
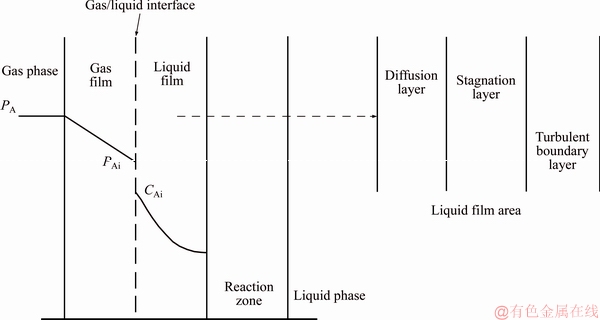
Figure 2 Mass transfer schematic of CO2-H2O-Mg(OH)2 system
Assign c for concentration of solute, y for the distance perpendicular to the interface. Thus, their correlations are given as follows [14]:
1) Turbulent boundary layer: 
2) Stagnation layer: 
3) Diffusion layer: 
These correlations reveal the fact that the mass flux is proportional to zero power of the diffusion coefficient (Na∝D0) in the outboard film, and is proportional to diffusion coefficient (Na∝D1.0) near the interface. So n is supposed to lay between 0 and 1 when it applies Dn to correlate the real mass transfer process [15].
3.2 Volumetric mass transfer coefficient KGa
The model is based on the main assumptions: the components (magnesium hydroxide particles) in the liquid phase are uniformly distributed and bubble flow regime is uniform bubble flow. Overall mass transfer coefficient can be expressed in terms of the ratio of absorption rate and driving force:
 (11)
(11)
The absorption rate equation can be expressed as follows:
 (12)
(12)
where Ci and Pi are CO2 concentrations at the gas-liquid interface following the Henry’s law.
 (13)
(13)
In the formula, Ccl and  are defined as the concentration and corresponding partial pressure on CO2 in the bulk liquid. Paverage is the average partial pressure on CO2 in the bulk gas inside bubbles.
The CO2 partial pressure in the bubble is reduced as the bubble rising through the column. Although the bubble stays in the bubble column for a short time, the partial pressure on carbon dioxide in the main gas phase of the bubbling process cannot be regarded as a fixed value to simplify the calculation because of the high absorption rate of the early stage of the absorption process and the large pressure drop in the outlet carbon dioxide partial pressure compared with the import. Here, it is assumed that the drop of pressure is lineal. The inlet CO2 partial pressure is invariant, and the outlet CO2 partial pressure changes with respect of time. For mean mass transfer coefficient, it is the mean CO2 partial pressure on the absorption time that we concern. As the imported CO2 concentration is
constant,  is defined as the time-averaged value of Pout,τ, as follow:
 (14)
(14)
So, Paverage can be written as:
 (15)
(15)
To represent the mass transfer driving force, the derivation begins with calculating Ccl, the concentration of free CO2 molecule in the liquid phase at the absorption equilibrium.
Assign y1 and y2 for the CO2 concentration of inlet and outlet gas, the absorption efficiency η can be written as:
 (16)
(16)
Draw the fitting curve of η, the total amount of absorbed CO2 may be integrated as:
 (17)
(17)
Knowing the amount of Mg(OH)2 and CO2, an OLI analyzer was introduced to simulate the concentration of each component at each moment during the absorption process. So Ccl is obtained.
Then, Eq. (11) can be rewritten as:
 (18)
(18)
Finally, the volumetric mass transfer coefficient Kga can be determined.
3.3 Bubble behavior
As shown in Figure 3, the geometry and size of bubble swarms differ with respect to the position in the liquid column. At the bottom of column, the simulated gas enters the liquid through nozzles of the gas distributor, forming large bubbles with shapes of ellipsoidal and spherical-cap. Large bubbles tend to break up into smaller bubbles, and small bubbles tend to join together [16]. There exists an equilibrium between breakage and coalescence of rising bubbles [17]. Generally, large bubbles make up the majority of the bottom and top region of the column, while small bubbles congested the middle part of the vessel. And in most cases the distribution of bubble size approximately follows the logarithmic normal distribution law [18].
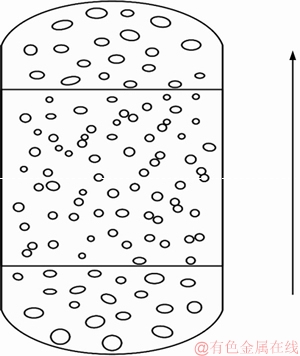
Figure 3 Distribution plot of bubble swarms
There have been many researches on the breakage and coalescence behaviors of bubbles, and it is also found that agitation rate and superficial gas velocity affect a lot. In general, a high agitation rate results in a sharp drop in the mean bubble size, whereas, a high superficial gas velocity reduces the effect [19]. To figure out the sauter mean diameter of bubble swarms for subsequent calculating, the whole situation of bubble behavior needs to be investigated and analyzed.
Photography & image analysis and radiography are mainstream experimental ways to detect the bubble size [20]. These optical measurements require transparent wall and liquid and low gas holdup, while Mg(OH)2 slurry is milky white and the gas holdup is relatively high. Optical measurements also provide bubble profile in wall region mainly, so it is inadequate to be utilized to calculate the sauter mean value of bubble swarms considering the radial distribution of bubble size caused by turbulence and wall effect , especially in small scale reactors [21]. GADDIS et al [22] derived a well-accepted formula from strict force analysis to calculate the initial bubble diameter which just generated from gas distributor under low and moderate gas pressures:
 (19)
(19)
It is found that the second addend (viscosity and flow rate) decides the initial bubble diameter. The numerical value of the second addend is three orders for magnitude larger than the rest two addends according to experimental data. In other words, nozzle diameter has barely any influence on bubble size. The initial bubble diameters in this experiment are about 14 mm.
On account of wall effect and gas holdup which affect bubble breakage and coalescence, a semi-empirical correlation to estimate sauter mean bubble radius under dense bubbling conditions has been proposed [14]:
 (20)
(20)
The gas holdup in electrolyte solutions cases, ε is estimated according to Eq. (21) suggested by AKITA et al [23]:
 (21)
(21)
The sauter mean bubble diameters of bubble swarms in this experiment are about 2 mm.
With the mean diameter, the characteristic exposure time θ can be estimated if bubble rising velocity is known according to its definition. After detachment from the orifice, bubble would have a brief amount of time to accelerate before it reaches the terminal rising velocity. It is reported that air bubble needs to climb about 10–20 mm in distilled water [17]. Concerning that this period of time is too short, it is assumed that bubbles are rising at a uniform velocity, which is equal to the terminal rising velocity. The rise of a bubble in liquid is a function of several parameters [24], including bubble characteristics (size and shape), properties of gas-liquid systems (density, viscosity, surface tension, concentration of solute, density difference between gas and liquid), liquid motion and operating conditions. Many correlation researches have been reported in the past decades, Mendelson proposed the well-accepted wave theory for prediction of bubble rises velocity, then derived a simple but efficient formula based on published data [25].
 (22)
(22)
This equation has shown very good agreement with the experimental data onto Newtonian fluids except for very small bubbles (<0.5 mm). As mentioned earlier, the magnesium hydroxide slurries present almost the same flow characteristics as distilled water, so it is feasible to treat those slurries as Newtonian fluids. Figure 4 demonstrates how the terminal bubble rise velocity would change with respect of bubble radius under certain liquid surface tension and density in our experiments. As shown, the trend of rise velocity does not simply increase linearly when bubble size gets larger, but it is similar to the hook shape which is decreasing first and then increasing. When the bubble radius is about 3 mm, the minimum rise velocity is obtained, which is about 0.23 m/s. The velocity may correspond to two different bubble sizes which lie exactly in the recommended bubble size region. Moreover, the size range falls within the range of 1–16 mm in diameter, which covers the size range of common bubbles in bubble experiment. Therefore, it is suitable to predict rise velocity through bubble size rather than reverse it [26]. Otherwise, it will get into dilemma to predict the gas-liquid interfacial area.
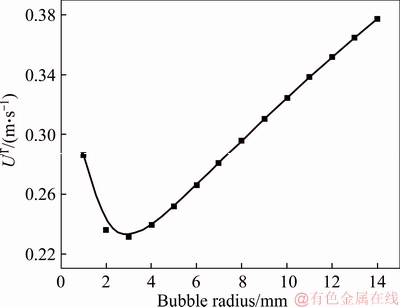
Figure 4 Relationship between bubble radius and terminal rising velocity in CO2-H2O-Mg(OH)2 system
3.4 Mass transfer coefficient
According to the original penetration model, the liquid phase mass transfer coefficient (Kl) correlates with the diffusion coefficient (Dl) of solute and characteristic contact time θ. θ is the time which takes for the liquid around the bubble to be completely replaced, specifically, the time it takes for the bubble to rise a bubble’s diameter. Therefore, the correlations are given as:
 (23)
(23)
According to the mass transfer model based on penetration theory, Kl is given as:
 (24)
(24)
Notably, this correlation does not take chemical reaction into account, Eq. (24) cannot be used to calculate Kl directly in the system of CO2-H2O-Mg(OH)2 in this experiment. The specific gas-liquid interfacial area, a, is the total interfacial area per unit volume of liquid (without bubbles). Introducing the concept of gas holdup, ε, the specific gas-liquid interfacial area has a simple formula which can be easily deduced with knowing the bubble size.
 (25)
(25)
According to its concept, Vg is defined as the actual gas volume in the bubble column, Vt is defined as the total inlet gas volume throughout the absorption process, Vl is defined as the actual liquid volume in the bubble column, then:
 (26)
(26)
Substituting the volume and superficial area of single bubble, a can be calculated as:
 (27)
(27)
Overall mass transfer coefficient of Kg is given as:
 (28)
(28)
According to the additive property of mass transfer resistance, the overall mass transfer resistance is summed by the separate side resistances.
 (29)
(29)
Assume that the bubble geometry is rigid sphere, the mass transfer inside the bubble and gas film is investigated, the theoretical equation for diffusing to the spherical surface is [27]:
 (30)
(30)
This expression can be solved under proper boundary conditions and transform the solution into expression using dimensionless number:
 (31)
(31)
The contact time θ is taken as the ratio of bubble size to gas rising velocity and substituted into Eq. (23), then NFo is the reciprocal of NPe. Due to the considerable deviation from counting kg when NPe is small, an additional item was suggested to adding in the formula. Rewrite Eq. (31) as:
 (32)
(32)
Because of NPe is relatively small (Generally two or three orders of magnitude smaller than 6.6 in this experiment), SUH et al [28] suggested removing the complicated item and get the gas phase mass transfer coefficient:
 (33)
(33)
What has to be mentioned is that the kg above is measured in cm/s. The above equation is divided by the gas constant and temperature to unify the calculating units of Eq. (29):
 (34)
(34)
The diffusion coefficient of gas mixture, Dg, is estimated using the following semi-empirical formula [29]:
 (35)
(35)
Liquid side mass transfer coefficient (kl) was obtained by substituting Eq. (27) into Eq. (22), as follows:


 (36)
(36)
The whole scheme of the model computation is explained as Figure 5.
4 Results and discussion
4.1 Effect of Mg(OH)2 concentration
To investigate the influence of Mg(OH)2 concentration on CO2 the absorption, 0.025, 0.05, 0.1 mol/L Mg(OH)2 slurries and 15 vol% CO2 gas under 25 °C were conducted in this experiment. The CO2 absorption capacity of slurry with different concentration is shown in Figure 6(a). The time for the Mg(OH)2 slurry to reach the absorption equilibrium becomes longer as the concentration of slurry increases, and the total amount of carbon dioxide that could be absorbed also increased. Figure 6(b) shows the control groups of outlet CO2 partial pressure. First, the partial pressure decreased sharply due to the rapid neutralization reaction of dissolved Mg(OH)2 and CO2, and then Mg CO3 was formed. In addition, after the dissolved OH- ions were consumed, the Mg(OH)2 particles in the slurry began to dissolve and the outlet CO2 partial pressure kept at low level. Last, after the Mg(OH)2 was consumed, MgCO3 began to dissolve and continued to absorb CO2, generating soluble Mg(HCO3)2. The outlet CO2 partial pressure kept rising until the dissolved ions reached their solubility product. When the concentration of Mg(OH)2 increased from 0.025 to 0.05 mol/L, the absorption capacity of slurry to CO2 was also doubled, which was from 0.04 to about 0.08 mol/L. However, the amount of CO2 absorbed per liter of slurry was only increased by about 0.04 mol when the concentration of Mg(OH)2 was doubled from 0.05 to 0.1 mol/L. It can be seen that the increase in the absorption capacity of CO2 caused by the increase in Mg(OH)2 is a linear increase in the low concentration range of Mg(OH)2. When the slurry concentration exceeds 0.05 mol/L, the increase in carbon absorption capacity decreases. Regarding to change in mass transfer rate, as the concentration of Mg(OH)2 slurry increases, the volume mass transfer coefficient (Kga) increases and then remains stable, the variation trend of liquid phase mass transfer coefficient k1 is similar to volume mass transfer coefficient. The change trend of gas mass transfer coefficient kg is different from the former two. 0.025 and 0.1 mol/L of Mg(OH)2 slurry have almost the same gas mass transfer coefficient, and the minimum value of kg is obtained at the slurry concentration of 0.05 mol/L. The mass transfer resistance is the reciprocal of mass transfer coefficient. By comparing the absolute value of the gas mass transfer resistance and the liquid mass transfer resistance, it can be found that the mass transfer resistance is mainly concentrated in the liquid phase. Therefore, less mass transfer resistance means greater liquid phase mass transfer coefficient. Considering carbon absorption ability, equilibrium time and the mass transfer rate, the decarburization optimal concentration of Mg(OH)2 slurry is 0.05 mol/L under ambient temperature (25 °C).
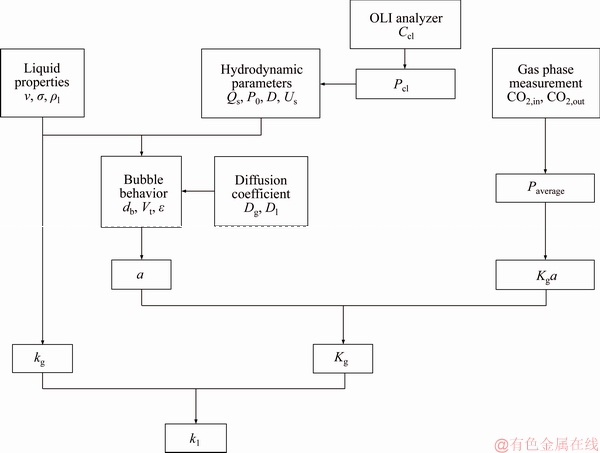
Figure 5 Schematic of computational model

Figure 6 Absorption of CO2 under 15 vol% V CO2, 25 °C conditions at different concentrations of Mg(OH)2 slurries:
4.2 Effect of CO2 concentration
To investigate effect of CO2 concentration on the decarbonization absorption and mass transfer of Mg(OH)2, 0.05 mol/L Mg(OH)2 slurries and simulated biomass gas containing 10%, 15%, 20%, 25%, 30% (volume fraction) CO2 under 25℃ were conducted. As shown in Figure 7, there are significant differences between low CO2 concentration control groups (10% and 15%, volume fraction) and high CO2 concentration control groups (20%–30%, volume fraction). Low CO2 concentration has more advantages in carbon absorption capacity and mass transfer rate. According to Eqs. (1) and (2), 0.05 mol Mg(OH)2 absorbs 0.1 mol CO2 when it completely transforms into Mg(HCO3)2. The absorbability of high CO2 concentrations groups is below 0.05 mol/L, which means there are still some unreacted Mg(OH)2. This is supported by OLI analysis data. The amount of Mg(OH)2 not involved in the reaction at the absorption balance is 0.010, 0.007 and 0.013 mol, respectively when the concentration of CO2 gas is 20%, 25% and 30% (volume fraction) respectively. The reason for this phenomenon is that high CO2 concentration gas leads to high concentration of CO32– ions in the solution, which requires less Mg2+ ions to reach the solubility product. According to nucleation theory, the Mg(OH)2 particles are deactivated by the covering of MgCO3·3H2O crystals. The fast deposition of crystals blocks the dissolution of Mg(OH)2 and increase the mass transfesr resistance on the solid-liquid phase. This also explains the sharp decrease of CO2 absorption efficiencies of high gas concentration. The driving force for gas-liquid phase mass transfer process increases from 8.11×10³ to 2.84×10⁴ Pa when CO2 concentration rises from 10 vol% to 30 vol%. Even so, the volumetric mass transfer coefficient Kga and liquid mass transfer coefficient kl are higher under the condition of low concentration CO2 than under the condition of high concentration CO2, except that the mass transfer coefficient of gas is basically contant kg. Although the absorption equilibrium time of CO2-H2O-Mg(OH)2 system under the condition of 15 vol% CO2 concentration is about two-thirds of that of 10 vol% CO2 concentration,the volumetric mass transfer coefficient (Kga) and liquid phase mass transfer coefficient (kl) calculated by the former decreased by 7.6% and 5.9% respectively compared with the latter, because the increase of mass transfer driving force is greater than the decrease of absorption equilibrium time. Combining decarbonization capacity, absorption equilibrium time and mass transfer rate, 15% is the optimal CO2 concentration for decarbonization using Mg(OH)2 slurry.
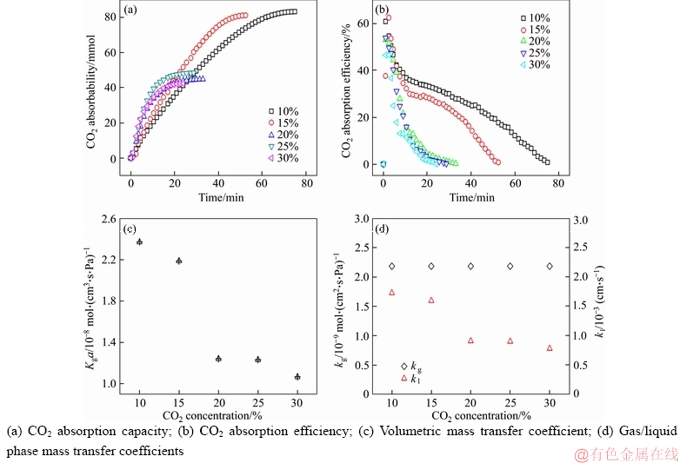
Figure 7 Absorption of CO2 under 0.05 mol/L Mg(OH)2, 25 °C conditions with different concentrations of CO2:
4.3 Effect of temperature
Temperature usually plays an important role in chemical absorption. To ensure abundant supply of reactants, 0.1 mol/L Mg(OH)2 slurries and 30 vol% CO2 gas under 20, 35 and 50 °C were conducted in this experiment. Figure 8(a) shows the decarbonization capacity of Mg(OH)2 slurry at different temperatures. As shown in the absorption curve, the decarbonization capability of Mg(OH)2 slurry at different temperatures is not much different. Mg(OH)2 slurry under 20 °C absorbs the maximum amount of CO2, which is about 0.122 mol/L, and others were 0.111 and 0.118 mol/L respectively under 35 and 50 °C. In addition, the outlet partial pressure curves of carbon dioxide are consistent under 20 and 50°C, which is significantly higher than the condition of 35 °C in the first half of the reaction. This means that the latter absorbs more CO2. More specifically, the volumetric mass transfer coefficient Kga under 35 °C is appreciably higher than the other two groups, as shown in Figure 8(c). Kga and kl increase with temperature rising in low temperature range (20–35 °C), while the trends reverse in high temperature range (35–50°C). Note that the volumetric mass transfer coefficient (Kga) and the gas phase mass transfer coefficient (kg) are close under 20 and 50 °C, but the liquid phase mass transfer coefficient under 20 °C is only half value of that under 50°C. The reason for this phenomenon is that the Henry’s coefficient of CO2 drops from 3.81×10⁻¹⁰ mol/(cm3·Pa) under 20 °C to 1.92×10⁻¹⁰ mol/(cm3·Pa) under 50 °C. Although the gas phase mass transfer coefficient kg grows with temperature owing to the increasing gas diffusion coefficient, the mass transfer process is controlled by liquid phase. On the premise that the gas phase mass transfer resistance is negligible, increasing temperature is beneficial for CO2 absorption in the front half of the temperature range. So, the optimum temperature for the absorption reaction is 35 °C.
4.4 Mass transfer process
As shown in Figure 9, the absorption process within CO2-H2O-Mg(OH)2 system is a complex combination containing physical dissolution and series of chemical reactions. The whole process can be briefly described as follows: the CO2 molecules in the gas phase are dissolved in water and ionized to form HCO3– and CO32–, meanwhile, the Mg(OH)2 solid particles dissolve and ionize to form Mg2+ and OH– in the liquid phase. The reactions occur at a plane in the liquid at a position close to the gas-liquid interface as these ions reach the reaction zone. As the absorption proceeds, Mg(OH)2 particles are gradually converted into MgCO3 crystals and the pH value drops accordingly. When the active surface of Mg(OH)2 (the surface where Mg(OH)2 is directly in contact with water) is consumed, the MgCO3 crystals begin to dissolve and continue to react with CO2, to form the highly soluble Mg(HCO3)2. The higher the ratio of Mg(HCO3)2 in the final product, the better the subsequent desorption. However, as the absorption process progresses, the Mg2+ and HCO3– accumulated in the solution gradually increase. On the one hand, the ionization equilibrium of HCO3– and CO32– limits the continued dissolution of CO2 gas; on the other hand, Mg2+ accumulated in the environment with high carbonate ion concentration can easily reach the solubility product of MgCO3 with CO32–. The final product is a mixture of magnesium carbonate crystal and magnesium bicarbonate solution, in which the ratio of HCO3– to MgHCO3+ is about 3:1, which can be increased with temperature.

Figure 8 Absorption of CO2 under 30% CO2, 0.1 mol/L Mg(OH)2 conditions at different temperatures:
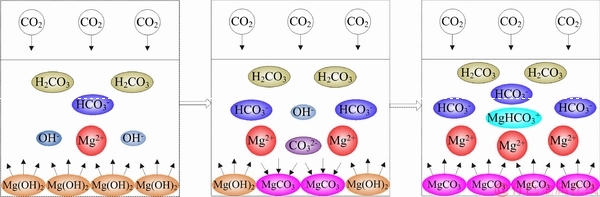
Figure 9 Absorption mechanism of CO2-H2O-Mg(OH)2 system
Mass transfer resistance is the reciprocal of mass transfer coefficient, enhanced absorption mass transfer is equivalent to reduced mass transfer resistance. It can be used to define where the rate determining step lies. According to the formula of modeling process, kg is a function of temperature, pressure, gas types, gas-liquid fluid properties, surface gas velocity and dimensions of bubble column, which is mainly affected by temperature. kg ranges from 2.20×10⁻⁹ mol/(cm3·s·Pa) at 20 °C to 3.0×10⁻⁹ mol/(cm3·s·Pa) at 50 °C. Compare the experimental data, liquid phase mass transfer resistance takes up the overwhelming majority in CO2-H2O-Mg(OH)2 system, and gas phase mass transfer resistance occupies less than 1% of the overall mass transfer resistance. The delay of liquid phase mass transfer means that gas concentration has little effect on gas-liquid mass transfer. Results of low concentration of CO2 gas prove that gas concentration has little influence on mass transfer coefficients. High concentration of CO2 gas is not conductive to absorption because it leads to fast deposition of MgCO3·3H2O crystals on the surfaces of unreacted Mg(OH)2 particles which reduces the utilization ratio of magnesium hydroxide, and high CO32– ion concentration limits the dissolution of MgCO3 to absorb CO2 continually. The deactivation process of Mg(OH)2 particles is illustrated in Figure 10.
This conclusion can be also verified by comparing the mass transfer coefficients of control group (25 °C, 0.1 mol/L Mg(OH)2, 15% CO2) with other groups under different temperatures. Despite the fact that the partial pressure on CO2 of control group under 25 °C has only half that of other groups, the mass transfer coefficients fit well with the change of temperature, and the results are consistent with previous studies [15, 30]. Therefore, increasing the concentration of Mg(OH)2 slurry and reaction temperature can effectively reduce the resistance of liquid phase mass transfer.
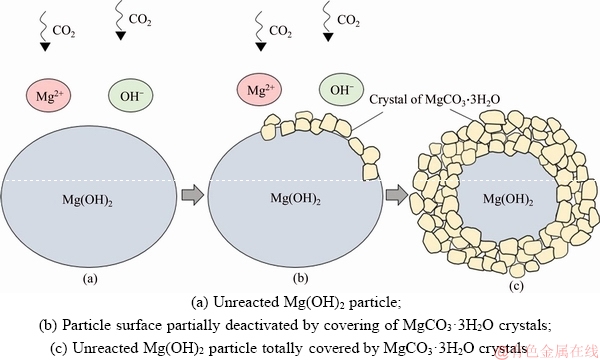
Figure 10 Illustration of Mg(OH)2 particles under high CO2 concentration conditions:
5 Conclusions
This study has proposed a computational model of gas-liquid mass transfer coefficients in CO2-H2O-Mg(OH)2 system based on penetration theory. The mass transfer coefficients are functions of liquid properties, Henry’s law constant, hydrodynamic parameters, diffusion coefficients, bubble characteristics and gas holdup. Although there is enhancement of chemical reaction, the mass transfer process is liquid-controlled. The liquid phase mass transfer resistance occupies more than 99% of the overall mass transfer resistance. The mass transfer process is mainly influenced by slurry concentration and reaction temperature. Volumetric mass transfer coefficient Kga and liquid side mass transfer coefficient Kl increase with the concentration of Mg(OH)2 slurry, then the trends remain constant when the concentration is over 0.05 mol/L. Kga increases in low temperature range (20–35 °C), while the trends reverse in high temperature range (35–50 °C). kl reaches the maximum value at 35 °C, the reason for high kl at 50 °C is the rapid drop of Henry’s law constant of CO2, gas concentration has indirect effects on absorption. To be precise, mass transfer coefficients are stable in both low CO2 concentration range (10%–15%, volume fraction) and high CO2 concentration range (20%–30%, volume fraction) respectively. High CO2 concentration gas is not conductive to absorption because it leads to fast deposition of MgCO3·3H2O crystals which cover the surfaces of unreacted Mg(OH)2 particles, and high CO32– ion concentration limits the dissolution of MgCO3 to absorb CO2 continually, but increasing CO2 concentration is helpful to reduce equilibrium time. Concentration of 0.05 mol/L Mg(OH)2, 15% CO2 and operation temperature at 35 °C are recommended for CO2 absorption.
Nomenclatures
a
Surface area per unit volume, cm2/cm3
Ci
CO2 concentration at the gas-liquid interface, mol/L
Caverage
Average CO2 concentration in the gas bubble, mol/L
Ccl
Equilibrium CO2 concentration in the bulk liquid, mol/L
d0
Diameter of the initial bubble, mm
db
Sauter mean bubble diameter of bubble swarms, mm
dh
Nozzle diameter, mm
D
Diameter of bubble column reactor, m
Dg
Diffusion coefficient in bulk gas, cm2/s
Dl
Diffusion coefficient in bulk liquid, cm2/s
g
Gravitational acceleration, m/s2
HCO2
Henry’s law constant of CO2, mol/(L·Pa)
h
Height of liquid column, m
Kg
Overall mass transfer coefficient,
mol/(cm2·s·Pa)
Kl
Overall mass transfer coefficient, cm/s
kg
Gas side mass transfer coefficient,
mol/(cm2·s·Pa)
kl
Liquid side mass transfer coefficient, cm/s
Ma, Mb
Molecular mass, kg/kmol
Na
Total amount of absorbed CO2, mol
N
Total amount of inlet gas, mol
NSh
Sherwood number, kgdb/Dg
NFo
Fourier number, Dg θ/db2
NPe
Peclet number, db2/Dgθ
Paverage
Average CO2 partial pressure in the gas bubble, Pa
Pin
Inlet CO2 partial pressure, Pa
Pout
Outlet CO2 partial pressure, Pa
Equilibrium CO2 partial pressure at the gas-liquid interface, Pa
Pi
CO2 partial pressure at the gas-liquid interface, Pa
R
Gas constant, R=8.314472×106 cm3·Pa/ (K·mol)
ra
Mass transfer rate, mol/(cm3·s)
rB
Bubble radius, mm
T
Temperature, K
TcA, TcB
Critical temperature, K
t
Equilibrium time, s
Ug
Superficial gas velocity, m/s
Ut
Terminal rising velocity of bubble swarms, m/s
V
Volumetric gas flow rate through the nozzle, m3/s
VcA, VcB
Critical volume, cm3/mol
Vl
Liquid volume of the gas-liquid mixture, m3
Vg
Gas volume of the gas-liquid mixture, m3
y1
CO2 mole fraction of inlet gas
y2
CO2 mole fraction of outlet gas
σ
Surface tension, N/m
ε
Gas holdup
η
Absorption efficiency
θ
Characteristic contact time of penetration theory, s
υ
Kinematic viscosity, m2/s
ρ
Density, kg/m3
τ
Any time moment
References
[1] SKREIBERG A, SKREIBERG  , SANDQUIST J, SRUM L. TGA and macro-TGA characterisation of biomass fuels and fuel mixtures [J]. Fuel, 2011, 90(6): 2182–2197.
[2] HANAOKA T, INOUE S, UNO S, OGI T, MINOWA T. Effect of woody biomass components on air-steam gasification [J] Biomass & Bioenergy, 2005, 28(1): 69–76.
[3] RUBIN E S, CHEN C, RAO A B. Cost and performance of fossil fuel power plants with CO2 capture and storage [J]. Energy Policy, 2007, 35(9): 4444–4454.
[4] ABU-ZAHRA M R M, SCHNEIDERS L H J, NIEDERER J P M, FERON P H M, VERSTEEG G F. CO2 capture from power plants Part I. A parametric study of the technical performance based on monoethanolamine [J]. International Journal of Greenhouse Gas Control, 2007, 1(1): 240–249.
[5] CHENG L, LI T, KEENER T C, LEE J Y. A mass transfer model of absorption of carbon dioxide in a bubble column reactor by using magnesium hydroxide slurry [J]. International Journal of Greenhouse Gas Control, 2013, 17: 240–249.
[6] HUANG Hou-ping, CHANG S G, DORCHAK T. Method to regenerate ammonia for the capture of carbon dioxide [J]. Energy and Fuels, 2002, 16: 904–910.
[7] VALENTI G, BONALUMI D, MACCHI E. A parametric investigation of the chilled ammonia process from energy and economic perspectives [J]. Fuel, 2012, 101: 74–83.
[8] YAN Li-yun, LU Xiao-feng, WANG Quan-hai, KANG Yin-hu, XU Jie, CHEN Ye. Research on sulfur recovery from the byproducts of magnesia wet flue gas desulfurization [J]. Applied Thermal Engineering, 2014, 65(1, 2): 487–494.
[9] KRISHNA R, van BATEN J M. Mass transfer in bubble columns [J]. Catalysis Today, 2003, 79: 67–75.
[10] ZHAO Bin, WANG Jin-fu, YANG Wei-guo, JIN Yong. Gas-liquid mass transfer in slurry bubble systems: I. Mathematical modeling based on a single bubble mechanism [J]. Chemical Engineering Journal, 2003, 96(1–3): 23–27.
[11] CHEN Pao-chi, HUANG Chen-huai, SU Ting, CHEN H, YANG Ming-wei, TSAO J. Optimum conditions for the capture of carbon dioxide with a bubble-column scrubber [J]. International Journal of Greenhouse Gas Control, 2015, 35: 47–55.
[12] PASHAEI H, GHAEMI A, NASIRI M. Experimental investigation of CO2 removal using Piperazine solution in a stirrer bubble column [J]. International Journal of Greenhouse Gas Control, 2017, 63: 226–240.
[13] YANG Wei-guo, WANG Jin-fu, ZHAO Bin, JIN Yong. Gas-liquid mass transfer in slurry bubble systems: II. Verification and simulation of the model based on the single bubble mechanism [J]. Chemical Engineering Journal, 2003, 96: 29–35.
[14] AZBEL D. Two phase flows in chemical engineering [M]. Cambridge University Press, 2009: 174–178.
[15] JAKOBSEN H A, LINDBORG H, DORAO C A. Modeling of bubble column reactors: Progress and limitations [J]. Industrial & Engineering Chemistry Research, 2005, 44(14): 5107–5151.
[16] ALVES S S, MAIA C I, VASCONCELOS J M T, SERRALHEIRO A J. Bubble size in aerated stirred tanks [J]. Chemical Engineering Journal, 2002, 89(1–3): 109–117.
[17] KULKARNI A A, JOSHI J B. Bubble formation and bubble rise velocity in gas-liquid systems: A review [J]. Industrial & Engineering Chemistry Research, 2005, 44(16): 5873–5931.
[18] AKITA K, YOSHIDA F. Bubble size, interfacial area, and liquid-phase mass transfer coefficient in bubble columns [J]. Industrial & Engineering Chemistry Process Design and Development, 2002, 13: 84–91.
[19] MART N M, MONTES F J, GAL
 N M A. Bubbling process in stirred tank reactors I: Agitator effect on bubble size, formation and rising [J]. Chemical Engineering Science, 2008, 63(12): 3212–3222.
[20] BOYER C, DUQUENNE A M, WILD G. Measuring techniques in gas-liquid and gas-liquid-solid reactors [J]. Chemical Engineering Science, 2002, 57(16): 3185–3215.
[21] GRUND G, SCHUMPE A, DECKWER W D. Gas-liquid mass transfer in a bubble column with organic liquids [J]. Chemical Engineering Science, 1992, 47(13, 14): 3509–3516.
[22] GADDIS E S, VOGELPOHL A. Bubble formation in quiescent liquids under constant flow conditions [J]. Chemical Engineering Science, 1986, 41(1): 97–105.
[23] AKITA K, YOSHIDA F. Gas holdup and volumetric mass transfer coefficient in bubble columns [J]. Industrial & Engineering Chemistry Process Design and Development, 1973, 12(1): 76–80.
[24] YANG G Q, DU B, FAN L S. Bubble formation and dynamics in gas-liquid-solid fluidization: A review [J]. Chemical Engineering Science, 2007, 62(1, 2): 2–27.
[25] MENDELSON H D. The prediction of bubble terminal velocities from wave theory [J]. AICHE Journal, 1967, 13(2): 250–253.
[26] JIN Hai-bo, YANG Suo-he, HE Guang-xiang, LIU De-lin, TONG Ze-min, ZHU Jian-hua. Gas-liquid mass transfer characteristics in a gas-liquid-solid bubble column under elevated pressure and temperature [J]. Chinese Journal of Chemical Engineering, 2014, 22(9): 955–961.
[27] DECKWER W D, BURCKHART R, ZOLL G. Mixing and mass transfer in tall bubble columns [J]. Chemical Engineering Science, 1974, 29(11): 2177–2188.
[28] SUH I S, SCHUMPE A, DECKWER W D, KULICKE W M. Gas-liquid mass transfer in the bubble column with viscoelastic liquid [J]. Canadian Journal of Chemical Engineering, 1991, 69(2): 506–512.
[29] XIAO Y, LOW B T, HOSSEINI S S, CHUNG T S, PAUL D R. The strategies of molecular architecture and modification of polyimide-based membranes for CO2 removal from natural gas-A review [J]. Progress in Polymer Science, 2009, 34(6): 561–580.
[30] KRAAKMAN N J R, ROCHA-RIOS J, LOOSDRECHT M C M. Review of mass transfer aspects for biological gas treatment [J]. Applied Microbiology and Biotechnology, 2011, 91: 873–886.
(Edited by FANG Jing-hua)
中文导读
鼓泡反应器中氢氧化镁浆液脱碳的气液传质研究
摘要:氢氧化镁被认为是燃煤电厂和生物质气脱碳的潜在溶剂。本文描述了浆态床鼓泡反应器中CO2-H2O-Mg(OH)2体系的化学作用和传质机理,建立了可靠的计算模型。利用实验方法和软件辅助仿真,得到了总传质系数和单位体积表面积。结果表明:Mg(OH)2浆体吸收CO2的传质过程主要是液膜控制过程,其中浆液浓度和反应温度是影响气泡塔反应器体积传质系数和液相传质系数的主要因素。高浓度的二氧化碳对其吸收有不利影响,因其导致MgCO3·3H2O晶体快速沉积在未反应的Mg(OH)2颗粒表面,降低了氢氧化镁的利用率。同时,高CO32–离子浓度限制了MgCO3的溶解,使其不能持续吸收CO2。建议二氧化碳捕集系统的反应条件为氢氧化镁溶液浓度0.05 mol/L,二氧化碳体积浓度15%,反应温度35 °C。
关键词:传质过程;CO2捕集;氢氧化镁;鼓泡塔
Foundation item: Project(21878338) supported by the National Natural Science Foundation of China; Project(2015BAL04B02) supported by the National key Technology R&D Program of China; Project(2018K2038) supported by the key Research and Development Project of Hunan Province, China; Project supported by Hunan Collaborative Innovation Center of Building Energy Conservation & Environmental Control, China
Received date: 2018-01-10; Accepted date: 2019-01-23
Corresponding author: LI Li-qing, PhD, Professor; Tel: +86-13807483619; E-mail: liqingli@hotmail.com; ORCID: 0000-0001-8297- 309X

