
Axial mixing and mass transfer characteristics of pulsed extraction column with discs and doughnuts
WANG Yue-yun(王悦云), JING Shan(景 山), WU Giu-lin(吴秋林), WU Wei(吴 伟)
Institute of Nuclear and New Energy Technology, Tsinghua University, Beijing 102201, China
Received 8 April 2005; accepted 20 June 2005
Abstract: The axial mixing is a key factor for design and scaling up of the pulsed extraction column which has strong influence on the mass transfer performances of the pulsed extraction column with discs and doughnuts. A steady-state concentration profile measurement was used to evaluate the mass transfer and axial mixing coefficients for the nitric acid/water/30%TRPO (in kerosene) system in the pulsed extraction column with the diameter of 38 mm on the condition of the TRPO-kerosene solution as the continuous phase and the flow ratio of 1∶1. Experimental results indicate that Ey evaluated by the experiments is in good agreement with that given by Burratti’s correlation; the axial mixing is far smaller for the continuous phase than that for the dispersed phase. However the empirical correlation for HOX is only given based on the present data.
Key words: pulsed extraction column; axial diffusion model; mass transfer; steady-state concentration profile
1 Introduction
Liquid-liquid extraction has been regarded as one of the most useful separation process. In recent years, a new type of extraction column, called the discs and doughnuts pulsed extraction column, has been developed and extensively applied to reprocess the spent nuclear fuel in France and Japan[1, 2]. The extraction column has shown the following advantages: high efficiency, perfect flooding throughputs, no rotational parts, easy clearance and so on.
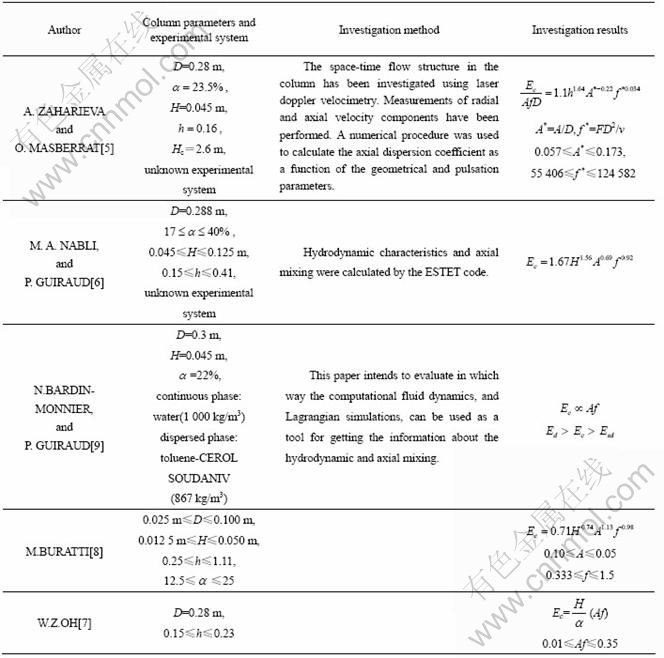
The conclusion that the axial mixing of the two phases countercurrent flow leads to the decreasing of the mass transfer efficiency[3] has been summarized by LUO[4] for the pulsed sieve-plate extraction column. However, the knowledge concerning the hydrodynamics and mass transfer performance of the pulsed extraction with discs and doughnuts is rarely reported. Only the axial mixing characteristics for the extraction column have been investigated and summarized in Table 1.
In Table 1, the correlations of the axial dispersion coefficient of continuous phase in the column are given by ZAHARIEVA and MASBERRAT[5], NABLI and GUIRAUD [6], OH[7], BURATTI[8] respectively, by means of the numerical simulation, and the conclusions are drawn as follows:
1) Ec increases with the increase of the plate spacing H.
2) The effect of D on Ec can be neglected, as described by Burratti.
3) Packing free area  is independent of Ec.
It is shown that at the same column parameters and operational parameters, Ec predicted by Burratti’s correlation is smaller than that by OH and NABLI’s correlations. From Table 1, it is easily observed that Ec increases with the increase of the pulsed parameters, namely, A and f.
The dispersed phase axial mixing characteristics was only reported by BARDIN-MONNIR and GUIRAUD[9] for pulsed extraction column with discs and doughnuts. The dispersed phase axial mixing coefficient, Ed, was simulated with computational fluid dynamics and Lagrangian simulations, and the result showed the axial mixing was far less important (about one tenth) for the continuous phase than for the dispersed phase, but the continuous phase axial mixing was larger than the axial mixing of a single drop.
In order to provide the sufficient knowledge of the design and scaling up when the pulsed extraction column with discs and doughnuts is used in the nuclear the plate spacing on the axial mixing and mass industry of China, the axial mixing model combined with the steady-state concentration profiles method is used to evaluate the effect of the pulsation intension and transfer characteristics for the pulsed extraction column with discs and doughnuts at the phase ratio R=1.
Table 1 Reported results of axial mixing characteristics in pulsed extraction columns with discs and doughnuts evaluate the effect of the pulsation intension and transfer characteristics for the pulsed extraction column with discs and doughnuts at the phase ratio R=1.
2 Experimental
2.1 Experimental set-up and system
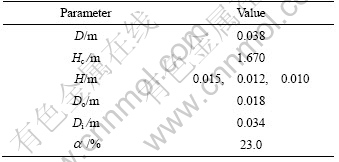
The experimental apparatus, as shown in Fig.1, consisted of four parts: a discs and doughnuts column (1), the pneumatically pulsed system (20-22), the feeding and discharging system of the two phases (9-19), and the measurement system (5-8). The column, which was made of a vertical cylindrical glass pipe, contained a series of discs and doughnuts alternately arranged and maintained by the braces of constant length, as shown in Fig.2, and Fig.3. The parameters of the column and the plate used in the experiments are shown in Table 2.
Table 2 Structure parameters of column
There were six pairs of sampler arranged along the wall of column, as shown in Fig.1(23). The sampling tubes in each pair, which withdrawn the samples for the continuous phase and the dispersed phase respectively at the same time, were filled with the hydrophilic fibre and the lipophilic fibre respectively to avoid the mixing of two phases.
The experimental materials used in the experiments were nitric acid solution for the aqueous phase and
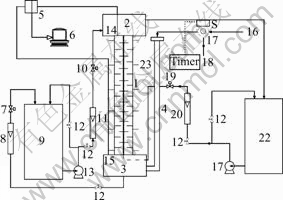
Fig.1 Schematic diagram of pulsed extraction column with discs and doughnuts: 1 Column; 2 Top settler; 3 Bottom settler; 4 Pulsation leg; 5 Pressure transducer; 6 Computer; 7 Top purge probe; 8 Bottom purge probe; 9 Aqua outlet valve; 10 Aqua outlet rotameter; 11 Aqua feed tank; 12 Aqua inlet valve; 13 Aqua inlet rotameter; 14 Solenoid valve; 15 Aqua pump; 16 Organic inlet valve; 17 Organic inlet otameter; 18 Organic valve; 19 Organic feed tank; 20 Pressurized air; 21 Rotary valve; 22 Free air; 23 Sampler
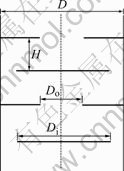
Fig.2 Schematic diagram of column

Fig.3 Schematic diagram of discs and doughnuts
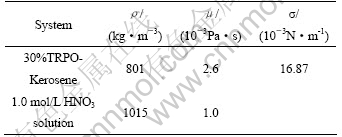
30%TRPO-kerosene solution for the organic phase. The physical properties of the two solutions are listed in Table 3. During the experimental process, the feed concentration of HNO3 solution was about 0.6 mol/L, and that of HNO3 solution in the organic phase was less than 0.1 mol/L. The equilibrium relationship of HNO3 in the two phases within the experimental range at room temperature is expressed as
 (1)
(1)
(0.02 mol/L≤y≤0.6 mol/L)
Table 3 Physical properties of system
2.2 Procedure
When the organic phase was as a continuous phase, the column was firstly full of the TRPO-kerosene solution, then the pulse amplitude and frequency were set at the desired values, and the flow rates of the two phases were regulated to the desired values at R=1∶1, finally, the interface of the two phase in the lower expanded section was observed at the required level. After 30 min, the state of the flow of two-phase in the column was considered as the steady. The dispersed phase hold-up was on-line measured by the air-purge method[10]. The experimental conditions are shown in Table 4.
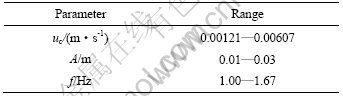
Table 4 Operation parameters used in experiment
When the volume of the dispersed phase withdrawn from the aqueous outlet was about five times larger than that of the column and the HNO3 concentration of the aqueous phase from the outlet was sampled and remained constant by titration, therefore, the steady-state concentration profiles was developed in the column. The two phases were sampled and then the HNO3 concentrations in the two phases were determined by titration, respectively.
2.3 Modeling and algorithm[4]
Based upon the axial diffusion model and mass balance in the column, over the differential elements of the column with a cross-section area and total effective height Hc, the equation set for the steady-state process was established as follows, under the constant superficial velocities ux and uy at any given pulse amplitude and frequency:
 (2)
(2)
where Pex=Hcux/Ex, Pey=Hcuy/Ey, Z=h’/Hc.
Noting that in Eqn.(2) represents
  .
.
The steady-state boundary conditions are
As Z=0,
 (3)
(3)
As Z=1,
 (4)
(4)
For solution of this equation set, a differential equation in mean implicit form was applied with the suitable distance step. The three parameters of Pex, Pey and NOX in the equation set were evaluated by combining Marquadt optimization with the measured steady-state concentration profile[10].
3 Results and discussion
Fig.4 shows the steady-state concentration profiles at H=0.015 m, Af =0.02 m/s and  =10%. In Fig.4, the solid points represent the measured concentrations profile and the line does that evaluated by the model. The results show that the steady-state concentration profile in the column is in good agreement with that predicted by the axial diffusion model at the evaluation of three parameters, such as Ex, Ey and NOX.
3.1 Continuous phase Ey
The influence of the dispersed phase hold-up and the plate spacing H on Ey at the Af=0.02 m/s is shown in Fig.5. Within the experimental range, Ey increases with the increase of H.
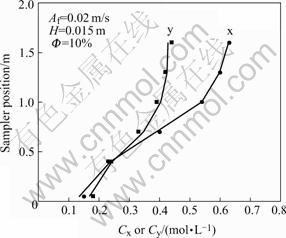
Fig.4 Steady-state concentration profiles
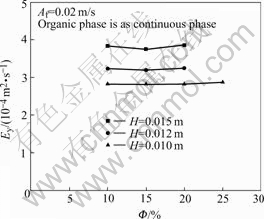
Fig.5 Influence of Φ and H on Ey
Fig.6 shows the influence of the pulse amplitude A and the frequency f on Ey. From Fig.6, it is shown that Ey increases with the increase of A and f respectively.
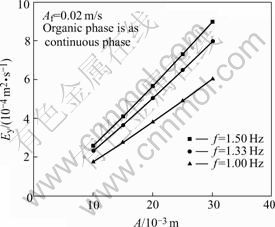
Fig.6 Influence of A and f on Ey
The comparison of the values of Ey with those predicted by Nabli’s, OH’s and Burratti’s correlation is shown in Fig.7. It is shown that Ey obtained by experiment fits well to that of Burratti’s correlation obtained by experiment, but is smaller than those of NABLI and OH’s correlation by numerical simulation method. Therefore, the values of Ey in the pulsed extraction column with discs and doughnuts can be described by BURRATTI’s correlation.
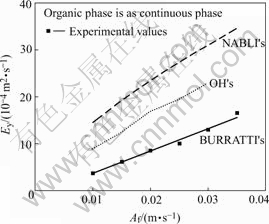
Fig.7 Comparison of Ey correlated with Ey measured
3.2 Dispersed phase Ex
The influence of H and on Ex is shown in Fig.8. The result shows that within the experimental range, Ex increases with the decrease of , however at the same , Ex increases with the decrease of H. The resistance of axial mixing increases for the increase of dispersed phase volume ratio in the vortex with the increase of , and the axial mixing decreases for the decrease of the vortex intensity while increasing H.

Fig.8 Influence of H and Φ on Ex
Fig.9 shows the effect of and H on Ex/Ey. From Fig.9, it is shown the Ex/Ey increases with the decrease of Φ, but at the same Φ, Ex/Ey increases with the decrease of H. Ex/Ey is larger than 1 is the same as the BARDIN-MONNIER’s conclusion[8], which the axial mixing is far less important (about one tenth) for the continuous phase than for the dispersed phase. Based on the correlation of Ey, the following correlation for Ex has been established by linear regression of the experimental data:
 (5)
(5)
The comparison of the calculated Ex with the experimental values is shown in Fig.10 with a maximum deviation of 10%.
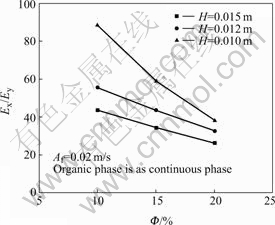
Fig.9 Effect of Φ and H on Ex/Ey
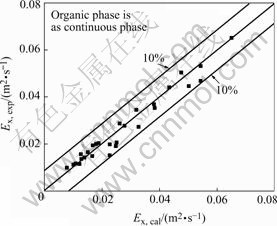
Fig.10 Comparison of Ex, exp with Ex, cal
3.3 ‘True’ height of transfer unit HOX
The definition of ‘true’ height of mass transfer unit, HOX, is given as follows:
 (4)
(4)
Fig.11 shows the influence of H on HOX under the same . The results indicate that within the experimental range, HOX is independent of H in this experimental system.
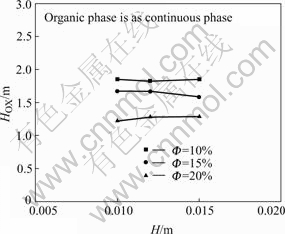
Fig.11 Influence of H on HOX under the same Φ
For the pulsed sieve plate extraction column, LUO[4] derived the following equation for the ‘true’ height of transfer unit, which is independent of column diameter, by using the two-film model, single drop mass transfer and two phase equation:
 (5)
(5)
From Eqn.(5), HOX is the function of the parameters, namely, K, uc and , where the constant K varies with the physical properties of the experimental system and the configuration of the column. Compared the pulsed sieve plate extraction column to that with discs and doughnuts, it is the similarity that a turbulent circulating pattern dominates the mass transfer performance. Therefore, we can induce that the influencing factors of the HOX for the latter column is the same as those for the former, i.e. HOX is also the function of K, uc and . In our experimental process, the values of are measured on-line by air-purge method and the configuration of column remains unchanged, therefore, HOX is only correlated with Φ and uc by linear regression of the experimental data:
 (6)
(6)
The calculated values of HOX from Eqn.(6) are compared with the experimental data as shown in Fig.12 with a maximum deviation of 5%. HOX decreases with the increase of Φ and the increase of uc, however the influence of H on HOX can be neglected.
4 Conclusions
The steady-state concentration profile method for the evaluation of mass transfer and axial mixing parameters worked successfully in a pulsed extraction column with discs and doughnuts. The results are as follows:
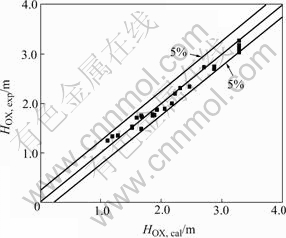
Fig.12 Comparison of HOX, expwith HOX, cal
1) Ey increases with the increase of Af and H, and is satisfied to the Burratti’s correlation.
2) Ex increases with the decrease of , and at the same , Ex increases with the decrease of H, and is predicted by
3) HOX decreases with the increase of and uc, however the influence of H on HOX can be neglected. The relation of HOX to and uc is
Further experimental studying on the mass transfer should be focused on forming a simple equation of HOX so as to predict the performance for the design and scaling up of a pulsed extraction column with the discs and doughnuts.
Nomenclature
a Specific surface area, m2/m3;
A Pulse amplitude, m;
C Concentration of HNO3 solution, mol/L;
D Column diameter, m;
Di Disc diameter, m;
Do Doughnut aperture, m;
E Axial mixing coefficient of solute, m2/s;
f Pulse frequency, Hz;
h’ Distance step;
Hc Effective height of the column, m;
H Plate spacing, m;
HOX ‘True’ height of transfer unit, m;
K Constant;
Koc Overall mass transfer coefficient based on continuous phase, m/s;
NOX Number of ‘true’ transfer unit;
Pe Peclet number;
R Phase ratio;
u Superficial velocity, m/s;
x Aqueous phase concentration, mol/L;
x* Equilibrium concentration of the aqueous phase, mol/L;
y Organic phase concentration, mol/L;
Greek letters
Packing free area, %;
μ Viscosity, Pa・s;
ρ Density, kg/m3;
Φ Holdup of dispersed phase, %;
σ Interfacial tension, N/m;
Subscripts
c Continuous phase;
d Dispersed phase;
F Feed flow;
s Solution;
sd Single drop;
x Aqueous phase;
y Organic phase;
References
[1] ANGELOV G, JOURNE E. Simulation of the flow patterns in a disc and doughnut column [J]. Chem Eng J, 1990, 45: 87-97.
[2] ANGELOV G,GOURDON C, LINE A. Simulation of flow hydrodynamics in a pulsed solvent extraction column under turbulent regimes [J]. Chem Eng J, 1998, 71: 1-9.
[3] MISEK T, ROD V. Recent Advanced in Liquid-Liquid Extraction [M]. Oxford, New York: Pergamon Press, 1971. 197.
[4] LUO Guang-sheng. A Study on the ‘True’ Height of Transfer Unit and Axial Mixing in Pulsed-Sieve-Plate Extraction Column [D]. Beijing: Tsinghua University,1993.
[5] ZAHARIEVA A, MASBERRAT O. Experimental and numerical 2-D turbulent field in a pulsed extraction column [A]. ISEC’96 [C]. The University of Melbourne, Australia, 1996. 1233-1238.
[6] NABLI M A, GUIRAUD P. Numerical Experimentation: a tool to calculate the axial dispersion coefficient is discs and doughnuts pulsed solvent extraction columns [J]. Chem Eng Sci, 1997, 52(14): 2353-2368.
[7] OH W Z. Analyses of Hydrodynamic Characteristics in A Pulsed Column with Discs and Doughnuts [D]. National Institute of Polytechnic in Toulouse, France, 1983.
[8] Buratti M F. A Study on the Phenomena of Axial Mixing in A Pulsed Column with Discs and Doughnuts [D]. National Institute of Polytechnic in Lorraine, France, 1988.
[9] BARDIN-MONNIER N, GUIRAUD P. Lagrangian simulations contribution to the knowledge of discs and doughnuts pulsed solvent extraction columns hydrodynamics [J]. Chemical Engineering and Processing, 2003, 42: 503-516.
[10] CHEN Jing, XU Shi-ping, WU Qiu-lin. On-line measurement of pulsed column parameters by air purge [J]. Atomic Energy Science and Technology, 2001, 35: 34-40. (in Chinese)
Corresponding author: JING Shan; Tel: +86-10-89796064-807; E-mail: s-jing@mail.tsinghua.edu.cn
(Edited by YUAN Sai-qian)

