�����¶ȶ�6082���Ͻ������ࡢ����֯�ݱ䡢��ѧ���ܺ�ʴ��Ϊ��Ӱ��
��Դ�ڿ����й���ɫ����ѧ��(Ӣ�İ�)2017���3��
�������ߣ�Nikhil KUMAR R. JAYAGANTHAN Heinz-G��nter BROKMEIER
����ҳ�룺475 - 492
�ؼ��ʣ����Ͻ��������ƣ���ѧ���ܣ���ʴ��λ��������
Key words��aluminum alloy; cryorolling; mechanical property; corrosion potential; precipitation
ժ Ҫ���о��������ơ��������ƺͺ����˻��6082���Ͻ������ࡢ����֯�ݱ�(�ظ����ٽᾧ�뾧������)����ѧ���ܺ�ʴ��Ϊ��Ӱ�졣���ò�ʾɨ�������ǡ�����������ͱ�ɢ����������о��������ơ��������Ƽ������ȴ�����Ʒ����������ѧ������֯��ò����̽������ѧ���ܡ���200 ��C�˻������������Ʒ�Ŀ���ǿ�Ⱥ�Ӳ��(345 MPa��HV 127)������������Ʒ�Ŀ���ǿ�Ⱥ�Ӳ��(320 MPa��HV 115)���ߡ�200 ��C�˻������������Ʒ����ǿ�Ⱥ�Ӳ�ȵõ��������Ϊ��������������''''''''�࣬������������Ʒ��Ȳ��������Zener������������������Ʒ�ĸ�ʴ�͵�ʴ��λ(-1.335 V��-710 mV)��ȣ�����������Ʒ�ĸ�ʴ�͵�ʴ��λ(-1.321 V��-700 mV)Ҳ�õ���ߡ�����������Ʒ���нϸߵ�λ���ܶȣ�Mg4Al3Si4�������ܽ�����У�ͨ���γɶۻ������������ԭ��ص��γɣ�ʹ��Ʒ�Ŀ���ʴ���ܵõ���ߡ�
Abstract: The influence of cryorolling (CR), room temperature rolling (RTR) and post annealing on precipitation, microstructural evolution (recovery, recrystallisation and grain growth), mechanical and corrosion behavior, was investigated in the present work. The precipitation kinetics and microstructural morphology of CR, RTR, and post annealed samples were investigated by differential scanning calorimetry (DSC), transmission electron microscopy (TEM), and electron back scattered diffraction (EBSD) to elucidate the observed mechanical properties. After annealing at 200 ��C, UTS and hardness of CR samples (345 MPa and HV 127) were improved as compared to RTR samples (320 MPa and HV 115). The increase in hardness and UTS of CR samples after annealing at 200 ��C was due to precipitation of ��'''''''' from Al matrix, which imparted higher Zener drag effect as compared to RTR samples. The improvement in corrosion and pitting potentials was observed for CR samples (-1.321 V and -700 mV) as compared to RTR samples (-1.335 V and -710 mV). In CR samples, heavy dislocation density and dissolution of Mg4Al3Si4-precipitates in the Al matrix have improved corrosion resistance of the alloy through formation of protective passive layer and suppression of galvanic cell, respectively.
Trans. Nonferrous Met. Soc. China 27(2017) 475-492
Nikhil KUMAR1, R. JAYAGANTHAN1,2,  BROKMEIER3
1. Department of Metallurgical and Materials Engineering & Centre of Nanotechnology, Indian Institute of Technology Roorkee, Roorkee 247667, India;
2. Department of Engineering Design, Indian Institute of Technology Madras, Chennai 600036, India;
3. Institute of Materials Science and Engineering, Clausthal University of Technology, Agricolastrasse 6, D-38678 Clausthal-Zellerfeld, Germany & Helmholtz Zentrum Geesthacht, Max Planck  1, D-21502 Geesthacht, Germany
Received 22 February 2016; accepted 12 October 2016
Abstract: The influence of cryorolling (CR), room temperature rolling (RTR) and post annealing on precipitation, microstructural evolution (recovery, recrystallisation and grain growth), mechanical and corrosion behavior, was investigated in the present work. The precipitation kinetics and microstructural morphology of CR, RTR, and post annealed samples were investigated by differential scanning calorimetry (DSC), transmission electron microscopy (TEM), and electron back scattered diffraction (EBSD) to elucidate the observed mechanical properties. After annealing at 200 ��C, UTS and hardness of CR samples (345 MPa and HV 127) were improved as compared to RTR samples (320 MPa and HV 115). The increase in hardness and UTS of CR samples after annealing at 200 ��C was due to precipitation of ��'' from Al matrix, which imparted higher Zener drag effect as compared to RTR samples. The improvement in corrosion and pitting potentials was observed for CR samples (-1.321 V and -700 mV) as compared to RTR samples (-1.335 V and -710 mV). In CR samples, heavy dislocation density and dissolution of Mg4Al3Si4-precipitates in the Al matrix have improved corrosion resistance of the alloy through formation of protective passive layer and suppression of galvanic cell, respectively.
Key words: aluminum alloy; cryorolling; mechanical property; corrosion potential; precipitation
1 Introduction
Al-Mg-Si alloys are widely used as structural materials in the aerospace and automobile industries due to their high specific strength, corrosion resistance, and fracture strength [1]. According to Hall-Petch relation, ultrafine grained materials with the grain size ranging from 100 nm to 1 ��m, exhibit very high strength and hardness but low ductility as compared to their bulk counterpart. The combination of high strength and ductility could be achieved in the ultrafine grained (UFG) materials with bimodal or multimodal microstructure features as reported in the literature [2]. Severe plastic deformation (SPD) processing has recently emerged as a novel approach to produce UFG and nanostructures (NC) in metallic materials. Several SPD techniques such as equal channel angular pressing (ECAP), high pressure torsion (HPT), accumulative roll-bonding (ARB), friction stir processing (FSP), room temperature rolling (RTR) and cryorolling (CR) are used to produce nanocrystalline and ultrafine grains in the bulk materials [3]. Among these techniques, CR has emerged as a new technique to produce UFG at relatively low true strains [4]. Cryorolling enables effective suppression of dynamic recovery, leading to very high dislocation density in the deformed materials, which subsequently facilitates formation of sub grain structures followed by UFG in the Al alloys as reported in the literatures [5-10].
The 6082 Al alloy is an age hardenable alloy and contains Mg and Si as major alloying elements. These elements are dissolved into the Al matrix at high solution treatment temperature (550 ��C, 24 h). The precipitate formed in 6082 Al alloy was identified as Mg2Si as reported in the earlier literature [11] but recent advanced characterization studies have revealed its chemical composition as Mg4Al3Si4 [12,13], which imparts thermal stability to the alloy [14,15]. Cryorolling of the 6082 Al alloy easily suppresses any local heating and Mg/Si particle remains dissolved in the Al matrix during processing. The deformed Al alloys upon the post annealing treatment show high strength and ductility as compared to the bulk Al alloys [16-20]. The effect of deformation temperature on precipitation sequence, mechanical and corrosion behavior of 6082 Al alloy is limited in the literature. Although thermal stability of the UFG Al alloy was investigated, recovery, recrystallisation and grain growth of age hardenable bulk Al alloys subjected to thermo mechanical processing at room and cryogenic temperatures have not been subjected to detailed studies so far [21-26]. In the present work, mechanical and corrosion behaviors of CR and RTR 6082 Al alloy were studied and correlated with microstructural evolutions such as grain size and dislocation density. The effect of working temperature on Mg4Al3Si4-precipitate evolution in the alloy was investigated. Annealing of the deformed 6082 Al alloy was performed between 100 and 400 ��C to substantiate the influence of CR and RTR on recovery, recrystallisation and grain growth. The dislocation density and precipitation evolution and morphology were characterized by using X-ray diffraction (XRD), DSC and TEM. The recovery, recrystallisation and grain growth of the deformed Al alloy were investigated by using DSC, EBSD and TEM.
2 Experimental
The 6082-T6 (cast & rolled) Al alloy was procured from Hindalco Industries Ltd., Mumbai, India. The chemical composition (Al: 96.31, Si: 1.35, Mg: 0.67, Mn: 0.72, Fe: 0.248, Zn: 0.12, Cu: 0.062, Cr: 0.0698, Ti: 0.045 and remaining impurity, mass fraction, %) was confirmed by X-ray fluorescence (Rigaku supermini200). After solution treatment (550 ��C, 24 h) [24], CR and RTR (unidirectional rolling) were carried out by using laboratory rolling machine up to true strain of 1.38. To maintain the working temperature, samples were dipped (during processing) in liquid nitrogen and water during CR and RTR, respectively.
Tensile samples were prepared according to sub size-ASTM E8M standards (gauge length: 26 mm, length of reduced section: 33 mm, length of grip section: 30 mm, width: 6.25 mm, width of grip section: 10 mm, radius of fillet: 6.25 mm, thickness: 6.25 mm). The test was performed on S-series, H25K-S tensile tester at room temperature. For each condition, six tensile samples were prepared to average out the tensile properties. For hardness measurements, at least 8 readings were taken and the average hardness value was reported. The mechanical polishing of samples, prior to mechanical testing, was carried out by using 320, 800, 1200, 1500 and 2000 grit emery papers followed by cloth polishing.
The cyclic polarization tests were conducted by using a Gamry potentiostat (interface 1000) in 3.5% NaCl environment to investigate the corrosion property of CR and RTR samples. To remove the oxide layer from the surface of the samples, potentiostatic test was performed before the cyclic polarization test with following conditions: initial �� of 0 V, initial time of 10 s, final �� value of 5 V, final time of 100 s, sample periods of 1 s, limiting J to 800 mA/cm2, sample area of 0.785 cm2, initial delay of 3600 s. The conditions chosen for cyclic polarization tests are as follows: initial delay of -0.5 V, apex �� of 1.5 V, final �� of 0 V, forward scan of 5 mV/s, reverse scan of 2.5 mV/s, sample periods of 1 s, apex J of 10 mA/cm2, sample area of 0.785 cm2, initial delay of 300 s. At least six readings were taken for each condition to ensure reproducibility of the results.
In EBSD sample to remove stress generated on surface due to cutting, mechanical and cloth polishing followed by electro-polishing were performed at 11 V for 90-120 s at -30 ��C. Further, fine cloth polishing with colloidal silica was carried out to relieve remaining stresses from the surface. The electro-polishing conditions consist of Aplab 3010 DC power supply, solution (20% perchloric acid + 80% methanol), and reference electrode (stainless steel). The polishing of samples (3 mm in diameter and 0.1 mm in thickness) for TEM study was performed by twin-jet polisher as per the standard procedures.
For DSC measurement, 30 mg disc (5 mm in diameter and 0.6 mm in thicknesses) was prepared by mechanical polishing followed by using punch of 5 mm diameter. To investigate the precipitation effect of deformed Al alloy, pure Al of 30 mg disc was used as a reference sample, whereas to identify the recovery and recrystallisation effect in CR and RTR alloys, ST 6082 Al alloy was used as a reference sample during a DSC run. The DSC scan was carried out at a heating rate of 15 ��C/min from 0 to 500 ��C.
3 Results and discussion
3.1 X-ray diffraction
The XRD patterns of CR, CR followed by annealing, RTR and RTR followed by annealing are shown in Figs. 1(a) and (b), respectively. The formation of (Al12(Fe,Mn)3Si and Mg4Al3Si4)-phase and Al12(Fe,Mn)3Si-phase, was observed in CR and RTR samples, respectively. Mg4Al3Si4-precipitate has dissolved into the Al matrix after ST treatment as explained in our earlier work [27]. In RTR sample, due to local heating or dynamic recovery during rolling, sufficient energy was supplied, which leads to evolution of Mg4Al3Si4-precipitates from Al matrix. However, due to low working temperature, the Mg4Al3Si4-precipitates were not observed in CR alloy and it does not show formation of Mg4Al3Si4-precipitate even after annealing at 100 ��C. CR sample has shown the formation of Mg4Al3Si4-precipitates upon annealing at 150 ��C. The intensity of Mg4Al3Si4-precipitate remains constant up to annealing at 200 ��C in RTR samples. The local heating in RTR might have caused for the temperature rise, leading to the evolution of precipitate and it remains stable for the RTR subjected to annealing at 200 ��C. However, XRD peaks of the CR sample showed that the annealing temperature of at least 150 ��C was required for evolution of Mg4Al3Si4-precipitate from the Al matrix. With the further increasing annealing temperature from 200 to 400 ��C, intensity of Mg4Al3Si4-precipitates has increased in both CR and RTR samples.
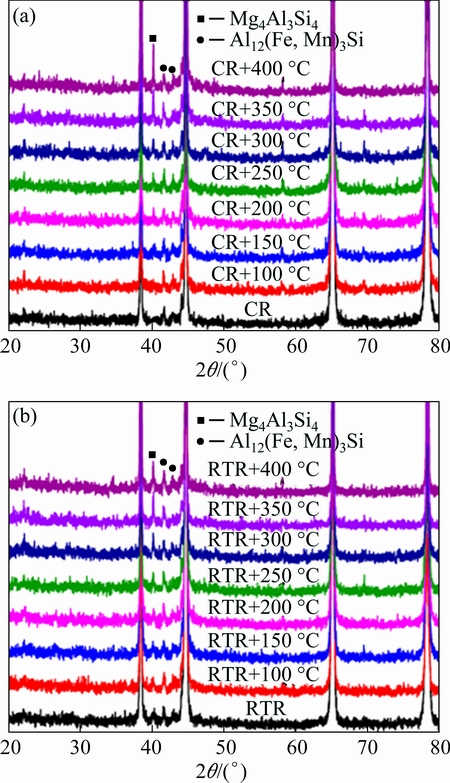
Fig. 1 XRD patterns of CR, CR followed by annealing (a) and RTR, RTR followed by annealing (b) of 6082 Al alloy
Williamson-Hall method was used to calculate the dislocation density of the CR, RTR, CR followed by annealing and RTR followed by annealing of 6082 Al alloy [28]. A relationship was established between the integral width (��), micro strain (��) and crystallite size (D) by assuming profile of the XRD peaks as Lorentzian as given below:
 (1)
(1)
By considering the ��cos ��/�� as abscissa and 2sin ��/�� as ordinate, four Al peaks corresponding to planes (111), (200), (220) and (311) were used for each condition to calculate the micro strain and crystallite size.
The dislocation density was calculated by using the relationship between the dislocation density (��), crystallite size (D), micro strain (<��2>1/2) and Burgers vector (b, for FCC structure b=a/ , where a is lattice parameter) as mentioned below [29]:
 <��2>1/2 (2)
Table 1 shows the dislocation density, micro strain and crystallite size of the alloy subjected to CR, CR followed by annealing, RTR and RTR followed by annealing. It was observed that CR exhibits higher amount of dislocation density and micro strain as compared to RTR. Suppression of dynamic recovery in CR results in higher amounts of dislocation density, but in RTR, the dislocation density was relatively low due to dynamic recovery. The dislocation density and micro strain of CR and RTR samples, upon annealing treatment, have decreased, but the increase in crystallite size was observed as evident from Table 1. The dislocation density of RTR was lower (1.33��1014 m-2) as compared to CR (3.07��1014m-2) after annealing at 250 ��C. In CR sample, rod shape, whereas in RTR sample, plate shape precipitates were found after annealing at 250 ��C as discussed in TEM section. Rod shape precipitates produce a higher Zener drag effect as compared to plate shape, which leads to higher dislocation density.
Table 1 Crystallite size, micro strain and dislocation density of CR and RTR and annealed 6082 Al alloys (from 100 to 400 ��C)

3.2 Stacking fault energy
The effect of CR and RTR on stacking fault energy (SFE) was analyzed by using following Scherer��s equation. It was used to calculate the crystallite size of a particular plane as given below [30]:
 (3)
(3)
where Deff is the crystallite size of (hkl) plane, �� is Cu K�� radiation (1.54  ), �� is the integral width and ��hkl peak is positioning of a particular (hkl) plane. Only two adjacent peaks were used to calculate the stacking fault probability (SFP) to minimize the error of sample due to the incorrect position of sample in diffractometer [31]. The SFP and sub grain size were calculated by following formulas [32]:
 (4)
(4)
 (5)
(5)
where Psf is the stacking fault probability (SFP), Dsb is the sub grain size and a0 is the lattice parameter of undistorted FCC crystal structure [30]. The stacking fault energy (SFE) was determined by using the following formula [33]:
 (6)
(6)
where �� is SFE, Psf is SFP and <��2> is a mean average micro strain.
By calculating crystallite size of a particular plane (hkl) from Eq. (3) and substituting into Eqs. (4) and (5), SFP can be calculated. The SFE can be calculated by substituting the value of SFP and average micro strain in Eq. (6). The SFE energies of CR and RTR samples were found to be 80 and 136 mJ/m2, respectively. The decrease in SFE also supports the suppression of dislocation annihilation during CR as compared to RTR.

Fig. 2 DSC curves of CR vs ST, RTR vs ST, CR, RTR, CR followed by annealing and RTR followed by annealing from 100 to 200 ��C
3.3 DSC study
The DSC curves of CR versus ST, RTR versus ST, CR, CR followed by annealing, RTR and RTR followed by annealing are shown in Figs. 2 and 3. Figure 2(a) shows the CR vs ST and RTR vs ST curves in which recrystallisation peak was separated out from DSC curve by using ST sample as reference sample during DSC run. It is evident from Fig. 2(a) that recovery starts around 130 ��C in CR; whereas in RTR, recovery occurs around 160 ��C. The recrystallisation peak in CR appears around 300 ��C, whereas in RTR, it starts around 290 ��C. These results show that suppression of dislocation annihilation in CR was effective as compared to RTR. The exothermic peaks shown in Fig. 2(a) are in accordance with the precipitation sequence reported in the literature [34,35]. The precipitation sequence of Al 6082 is given below.

Fig. 3 DSC curves of CR followed by annealing and RTR followed by annealing from 250 to 400 ��C
Super saturated solid solution (SSSS)��atomic clusters��G. P. zones����''����', U1 (Type A), U2 (Type B), B' (Type C)����
The formation of clusters or cluster 1 and cluster 2 depends on interaction of solute with the dislocations and vacancy inside the matrix. In RTR, only cluster was formed due to less dislocation density as compared to CR, where solute interaction with the dislocation was more due to higher dislocation density as evident from XRD results. It leads to the formation of cluster 1 and cluster 2 in CR samples. The precipitation reaction is basically a transformation reaction as reported in Refs. [36,37]. After annealing at 100 ��C, cluster 1 has transformed into cluster 2, in RTR as well as in CR as shown in Fig. 2(b) and other peaks remain unaffected. After annealing at 150 ��C, cluster 2 has transformed into ��'' in CR as well as in RTR and other exothermic peak remain unaffected. After annealing at 200 ��C, ��'' precipitates transformed into ��' precipitates in CR as well as in RTR (Fig. 2(c)). The major difference between the RTR and CR was the intensity of recrystallisation peak, the exothermic recrystallisation peak was higher in CR as compared to RTR even after annealing at 250 ��C (Fig. 3(a)). After annealing at 250 ��C, ��' precipitates have transformed into ��-precipitates in CR and RTR samples. After annealing at 300 ��C, exothermic recrystalliation peak has disappeared and ��'-precipitates have transformed in to �� in CR and RTR (Fig. 3(a)). These results show that recrystallisation has completed between 200 ��C and 300 ��C in CR as well as in RTR and high intensity of recrystallisation peak corresponds to relieving of high stored energy in CR. There was no exothermic peak found corresponding to any precipitates evolution after annealing at 350 ��C in CR as well as in RTR samples (Fig. 3(b)).
3.4 TEM study
In the present section, the effects of CR and RTR on grain refinement and further annealing given to substantiate the influence of initial deformation temperature on grain size, precipitation kinetics and their morphology are discussed. TEM images of CR sample show higher amount of dislocation tangles as seen from Fig. 4(a), whereas in the RTR, it was low (Fig. 4(b)). It was due to suppression of dislocation annihilation during CR, but in RTR, recovery has occurred. Further, by annealing at 100 ��C, grain size of 50 to 100 nm has formed in CR (Fig. 4(c)), whereas the grain size of 200 to 400 nm has formed in RTR as shown in Fig. 4(d). The increase in grain size in RTR was due to the presence of stable coarse Mg4Al3Si4-precipitates, also confirmed from XRD results, which produced lower Zener drag effect as shown in Fig. 4(b). After annealing at 150 ��C, CR increased the size of grain from 50 to 250 nm (Fig. 5(a)), but RTR has increased grain size from 300 to 600 nm (Fig. 5(b)). In CR after annealing at 150 ��C, small amount of Mg4Al3Si4-precipitates also emerged out from Al matrix as confirmed from XRD results. These small size Mg4Al3Si4-precipitates produced higher Zener drag effect as compared to coarse Mg4Al3Si4-precipitates found in RTR, which leads to increase in grain size. After annealing at 200 ��C, the size of the grain increased from 100 to 500 nm and 400 to 700 nm in CR and RTR, respectively, as shown in Figs. 5(c) and (d). After annealing at 250 ��C, size of grain was found within 500 nm and 400 to 700 nm in CR and RTR respectively as shown in Figs. 6(a) and (b). After annealing at 300 ��C, the size of the grain was found to be between 1 and 2 ��m in CR as well as in RTR as shown in Figs. 6(c) and (d), respectively. After annealing at 350 ��C, the size of the grain was found to be 1-3 ��m in CR and RTR as shown in Figs. 7(a) and (b). After annealing at the 400 ��C, size of the grain has increased to several micrometers as shown in Figs. 7(c) and (d).

Fig. 4 TEM images of CR (a), RTR (b), CR+annealed (100 ��C) (c) and RTR+annealed (100 ��C) (d) samples of 6082 Al alloy

Fig. 5 TEM images of CR+ annealed (150 ��C) (a), RTR+ annealed (150 ��C) (b), CR+ annealed (200 ��C) (c) and RTR+annealed (200 ��C) (d) samples of 6082 Al alloy
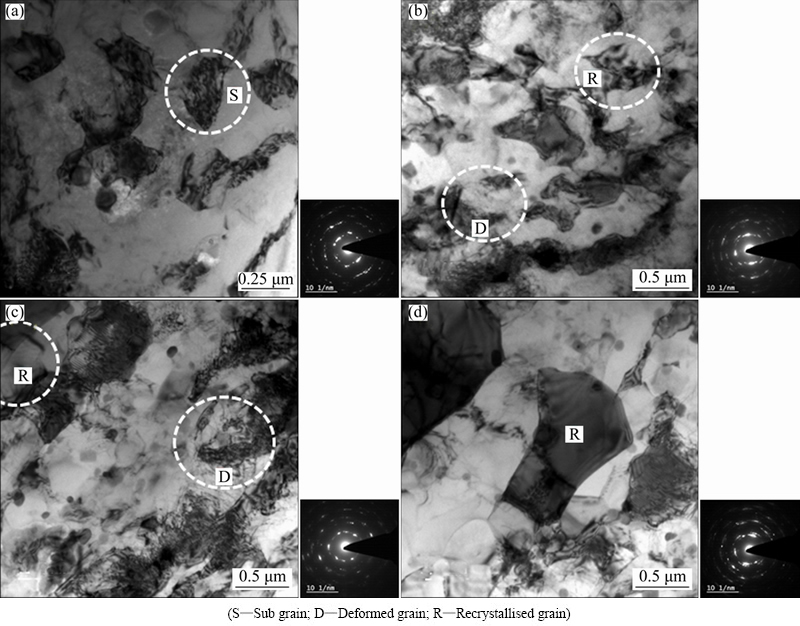
Fig. 6 TEM images of CR+annealed (250 ��C) (a), RTR+annealed (250 ��C) (b), CR+ annealed (300 ��C) (c) and RTR+annealed (300 ��C) (d) samples of 6082 Al alloy

Fig. 7 TEM images of CR+annealed (350 ��C) (a), RTR+annealed (350 ��C) (b), CR+annealed (400 ��C) (c) and RTR+annealed (400 ��C) (d) samples of 6082 Al alloy (R��Recrystallised grain)
The recovery and recrystallisation behaviors can be easily seen in the Figs. 3-6. After annealing at 100 ��C, very small size sub grain (40-80 nm) has formed in the CR sample as compared to the sub grain formed in RTR (80-120 nm). The grain has severely deformed even after annealing at 100 ��C as compared to RTR (Figs. 4(c) and (d)). When annealing temperature was increased to 150 ��C, the formation of sub grains continued in CR sample, but the grains in CR were severely deformed as compared to RTR (Figs. 5(a) and (b)). After annealing at 200 ��C, dislocation density was higher in CR as compared to the RTR sample (Figs. 5(c) and (d)). In RTR, recrystallised grain was observed after annealing at 200 ��C (Fig. 5 (d)). After annealing at 250 ��C, sub grain growth was observed in CR, whereas, recrystallised grain growth was observed in RTR samples (Figs. 6(a) and (b)). After annealing at 300 ��C, in CR, sub grain growth continues and recrystallised grain was also observed. However, in RTR, recrystallised grain growth was observed as shown in Figs. 6(c) and (d). After annealing at 350 ��C, in CR, recrystallised grain growth was observed, whereas in RTR, recrystallised grain growth was higher (Figs. 7(a) and (b)). After annealing at 400 ��C, recrystallised grain growth continues in RTR as well in CR (Figs. 7(c) and (d)). The deformed sub grain having size less than 1 ��m (thermally stable UFG) was observed up to 250 ��C annealing temperature in CR, whereas in RTR, it is observed up to 200 ��C. In CR, after annealing at 300 ��C, recrystallised and coarse grains (grain size >1 ��m) were found. In RTR, recrystallised grains were observed after annealing at 200 and 250 ��C, grain growth has started. These results showed that recovery occurred in RTR up to 200 ��C, whereas in CR, it occurred up to 250 ��C. Recrystallisation occurred in the CR sample between 250 and 300 ��C and at 300 ��C grain growth has started, whereas in RTR, recrystallisation occurred between 200 and 250 ��C and at 250 ��C, grain growth has started.
The morphologies of ��'', ��' and ��-precipitates were needle, rod and plate shape, respectively, as reported in the literatures [14,15]. In CR sample, after annealing at 200, 250 and 300 ��C, needle, rod and plate shaped precipitates evolved out from the Al matrix, respectively, whereas in RTR at 200 ��C, needle and rod shape and at 250 ��C plate shape precipitates come out from the Al matrix as shown in Fig. 8. DSC peaks of RTR also confirm the evolution of ��'' and ��'-precipitates from Al matrix after annealing at 200 ��C (Fig. 2(c)). It can be concluded from the TEM study that in CR samples, needle (200 ��C), rod (250 ��C) and plate (300 ��C) shape precipitates are observed, whereas in RTR, needle and rod shape (200 ��C) and plate shape (250 ��C) precipitates are observed.

Fig. 8 Existence of ��'' (needle, 200 ��C) (a), ��' (rod, 250 ��C) (b), �� (plate, 300 ��C) (c) precipitates in CR and ��'' and ��' (needle & rod, 200 ��C) (d), �� (plate, 250 ��C) (e) RTR at various annealing temperatures
3.5 EBSD study
The image quality maps of 6082 Al alloy under various conditions are shown in Figs. 9-12. The formation of sub grains as well as the deformed area was seen in CR sample, whereas, RTR sample showed the formation of shear bands as shown in Figs. 9(a) and (b). The formation of large shear bands in RTR was due to the presence of mobile dislocation, where as in CR, dislocation mobility was suppressed due to the low working temperature (-196 ��C). The influence of working temperature and annealing on the deformed alloy was quantified through the measurements of the grain boundary misorientation maps as shown in Figs. 13 and 14. The grain boundaries were assumed: 1) very low angle grain boundary (1.5��-5��), 2) low angle grain boundary (5��-10��), 3) high angle grain boundary (10��-180��), in the present study. It was evident from Fig. 13 that the fraction of high angle boundary was high, which supported the formation of sub grains in CR. Whereas, in the RTR, the fraction of low angle grain boundary was high, which supported the formation of shear bands as shown in Fig. 13. The sub grain formation in CR was high due to the suppression of dislocation movement, which accumulated large number of dislocations in coarse grain. As the dislocation density tends to reach saturated value, it starts rearranging themselves and forms large number of sub grains. After annealing at 100 ��C, sub grain formation has increased in CR as well as in RTR as shown in Figs. 9(c) and (d), respectively. In CR sample, fractions of high angle boundaries were higher as compared to RTR sample as shown in Fig. 13. This may be due to annealing (100 ��C), causing more dislocation annihilation in a highly deformed CR sample as compared to RTR samples, which further converts into sub grains. After annealing at 150 ��C, in CR and RTR samples, sub grain formation continues as shown in Figs. 10(a) and (b). The grain boundary misorientation map also shows an increase in high grain boundary angle in CR as well as in RTR as shown in Fig. 13. After annealing at 200 ��C, sub grain formation continues in CR as well as in RTR (Figs. 10(c) and (d)). The grain boundary misorientation map also shows the increase in fraction of high angle grain boundary in CR as well as in RTR as shown in Fig. 14. After annealing at 250 ��C, recrystallised grains and deformed area are seen in CR, whereas in RTR, fully recrystallised grains are found as shown in Figs. 11(a) and (b), respectively. The grain boundary misorientation map of CR shows the low angle as well as high angle grain boundaries, whereas RTR sample exhibits the high fraction of high angle grain boundaries as shown in Fig. 14. It supports the presence of the low volume fraction of recrystallised grains in CR and high volume fraction of recrystallised grains in RTR sample. After annealing at 300 ��C, deformed area and coarse grain are found in the CR sample as shown in Fig. 11(c). The grain boundary misorientation map also shows the low fraction of low angle grain boundary and decrease in high angle grain boundary, which is the result of grain growth as shown in Fig. 14. In RTR sample, recrystallised grains and coarse grains are observed as shown in Figs. 11(c) and (d). The grain boundary misorientation map of RTR shows the decrease in high angle grain boundary due to grain growth and high angle boundaries free from misorientation showing recrystallisation as shown in Fig. 14. After annealing at 350 ��C, grain coarsening continues in CR as well in RTR as shown in Figs. 12(a) and (b). Further annealing at 400 ��C, grain coarsening continues in CR as well as in RTR as shown in Figs. 12(c) and (d).
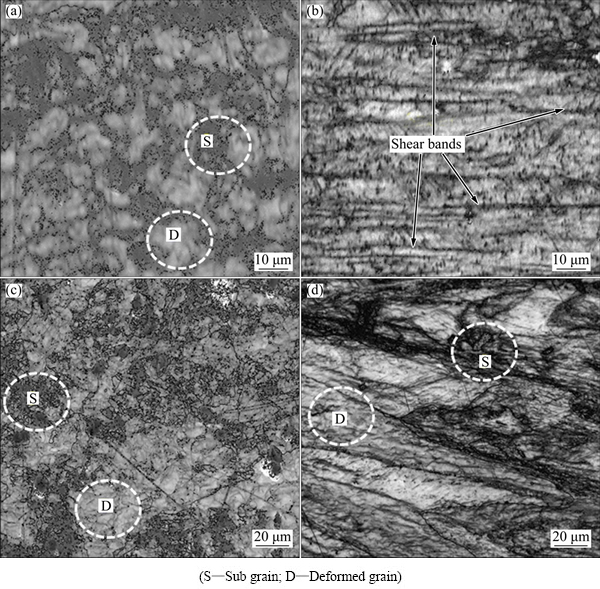
Fig. 9 Image quality maps of CR (a), RTR (b), CR+annealed (100 ��C) (c) and RTR+annealed (100 ��C) (d) samples of 6082 Al alloy

Fig. 10 Image quality maps of CR+annealed (150 ��C) (a), RTR+annealed (150 ��C) (b), CR+annealed (200 ��C) (c) and RTR+ annealed (200 ��C) (d) samples of 6082 Al alloy
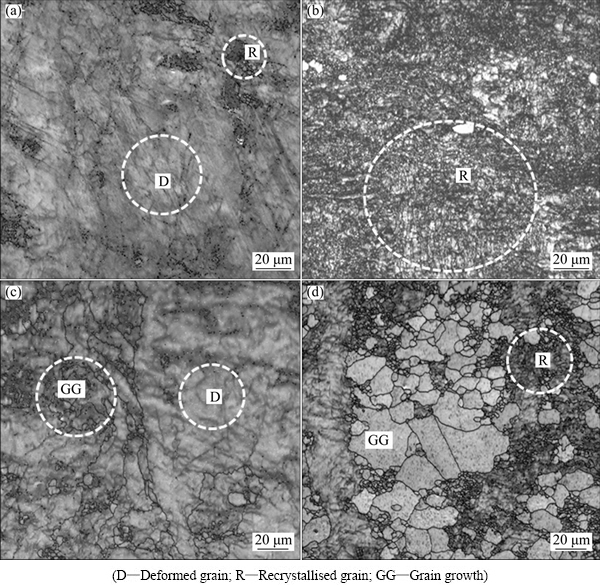
Fig. 11 Image quality maps of CR+annealed (250 ��C) (a), RTR+annealed (250 ��C) (b), CR+annealed (300 ��C) (c) and RTR+ annealed (300 ��C) (d) samples of 6082 Al alloy

Fig. 12 Image quality maps of CR+annealed (350 ��C) (a), RTR+annealed (350 ��C) (b), CR+annealed (400 ��C) (c) and RTR+ annealed (400 ��C) (d) samples of 6082 Al alloy (GG��Grain growth)

Fig. 13 Grain boundary misorientation maps of CR (a), CR followed by annealing at 100 ��C (b), 150 ��C (c), RTR (d), RTR followed by annealing at 100 ��C (e) and 150 ��C (f) samples of 6082 Al alloy

Fig. 14 Grain boundary misorientation maps of CR followed by annealing at 200 ��C (a), 250 ��C (b), 300 ��C (c) and RTR followed by annealing at 200 ��C (d), 250 ��C (e), 300 ��C (f) samples of 6082 Al alloy
It was clear from the image quality and the grain boundary misorientation maps that increase in high angle grain boundary and conversion of very low angle grain boundary into low angle grain boundary correspond to the recovery process. A constant high angle grain boundary corresponds to recrystallisation and its reduction indicates the grain growth. It may be concluded that the recovery was observed up to 250 ��C, recrystallisation between 250 to 300 ��C, and grain growth at 300 ��C in the CR sample. Whereas, in RTR sample, recovery occurs up to 200 ��C, recrystallisation occurs between 200 and 250 ��C and beyond 250 ��C, grain growth occurs, as evident from TEM and DSC results.
3.6 Mechanical properties
The hardness, UTS and ductility of CR, CR followed by annealing, RTR and RTR followed by annealing are shown in Figs. 15 and 16 and Table 2, respectively. The hardness and UTS (HV 115 and 307 MPa) of CR samples are higher as compared to RTR samples (HV 110 and 294 MPa). In CR sample, due to effective suppression of dislocation annihilation, dislocation hardening is higher as compared to RTR samples as confirmed from EBSD, TEM, DSC and XRD results. The increase in ductility (10%) in RTR samples is due to higher recovery of grain as compared to CR samples (9%). Overall improvement in mechanical properties after CR as compared to RTR was small [38].
After annealing from 100 to 200 ��C, hardness, UTS and ductility simultaneously increased in CR samples. As the annealing temperature increased from 200 to 300 ��C, hardness and UTS decreased rapidly and significant increase in ductility was observed as shown in Table 2. The variation in hardness, UTS and ductility was marginal beyond 300 ��C, the increase in strength from 100 to 200 ��C was due to precipitation of ��'' from Al matrix, which produced higher Zener drag effect by pinning the grain boundaries. The increase in ductility was due to more recovery of grain as annealing temperature increased. As the annealing temperature was increased from 200 to 300 ��C, meta stable-��'' precipitates converted into ��-precipitates as confirmed from DSC and TEM study. The needle shape ��''-precipitates produced higher Zener drag effect due to small size and coherency with the matrix, whereas plate shape ��-precipitates produced lower Zener drag effect due to their large size and incoherency with the Al matrix. As the annealing temperature is increased to 300 ��C, grain coarsening has occurred as confirmed from EBSD and TEM results. The increase in grain size and lower Zener drag effect lead to decrease in hardness and UTS. The increment in ductility was due to reduction in the grain boundaries as confirmed from EBSD and TEM study, and decrease in dislocation density as confirmed from XRD results. The variation in hardness, UTS and ductility is marginal, when the annealing temperature is further increased beyond 300 ��C as shown in Table 2. Beyond 300 ��C, only precipitates and grain coarsening occurred, which resulted in only small variation in mechanical properties of the alloy.

Fig. 15 Vickers hardness and elongation of CR and RTR alloys and annealed (100-400 ��C) 6082 Al alloys
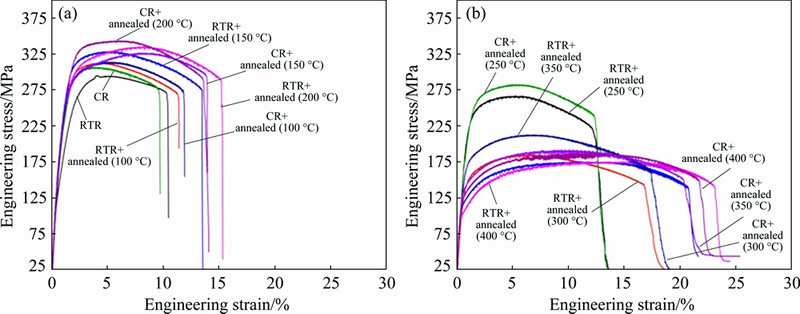
Fig. 16 Engineering stress-strain diagrams of CR and RTR and annealed (100-400 ��C) 6082 Al alloys
Table 2 Mechanical properties of CR and RTR and annealed 6082 Al alloys (100-400 ��C)
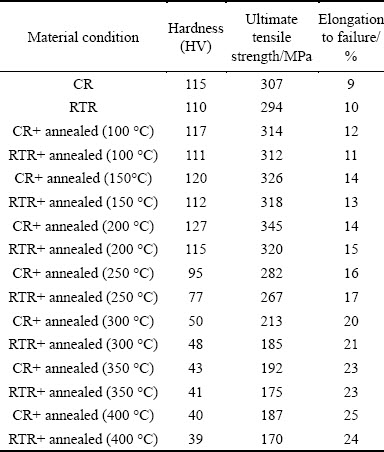
After annealing from 100 to 200 ��C, in RTR samples, hardness, UTS and ductility have simultaneously increased as shown in Table 2. The increase in hardness and UTS was lower in RTR samples as compared to CR samples as shown in Figs. 15 and 16 and Table 2. It was found during a TEM study that ��'' and ��' precipitates are observed in the RTR sample after annealing at 200 ��C, whereas in CR sample, ��'' precipitates are found. The ��' precipitates produced lower Zener drag effect as compared to ��''-precipitates, resulting in higher hardness and UTS in CR samples. As the annealing temperature further increased from 200 to 300 ��C, significant drop in hardness and UTS was observed. The decrease in hardness and strength was due to complete conversion of ��'' and ��'-precipitates into ��-precipitates. Beyond 300 ��C, coarsening of ��-precipitates has been observed, which does not affect the hardness and UTS of the alloy. The increase in ductility is due to recovery (100-200 ��C), recrystalli- sation (200-250 ��C), and grain coarsening (300 ��C), respectively.
The hardness, UTS and ductility of the deformed alloy were significantly affected by recovery, recrystallisation and grain growth during heat treatment. In the present work, recovery (250 ��C), recrystalli- sation (250-300 ��C) and grain growth (300 ��C) occur in CR, whereas in RTR, recovery (200 ��C), recrystallisation (200-250 ��C) and grain growth (from 250 ��C) occur as confirmed from EBSD, TEM and DSC results. The hardness and UTS in CR as well as in RTR samples decreased rapidly upon annealing between 250 and 300 ��C and 200 and 250 ��C, respectively. It can be concluded from the present study that during recovery, the values of hardness and UTS have decreased slightly but they were overcome by precipitation hardening. The strength has rapidly decreased during recrystallisation but it remains constant during grain growth. The ductility also increased slightly during recovery, but rapidly increased during recrystallisation and slowly during grain growth.

Fig. 17 Cyclic polarization curves of CR and RTR and for annealed (100 ��C to 400 ��C) 6082 Al alloy
3.7 Corrosion study
The effect of CR and RTR on the corrosion potential (��COR), pitting potential (��PIT), and passivation potential range (��PIT-��RP) was investigated and the results are shown in Fig. 17 and Table 3. After CR, ��COR, ��PIT, and ��PIT-��RP are found to be -1.321 V, -700 mV and 80 mV, respectively, whereas in RTR, they were found to be -1.335 V, -710 mV and 55 mV, respectively. It was clear from XRD results that CR sample contains higher dislocation density as compared to RTR and Mg4Al3Si4-precipitates also remain in the Al matrix, whereas in RTR, Mg4Al3Si4-precipitates evolved out from Al matrix. The uniform heavy dislocation density in CR sample enables the formation of a strong passive layer on the surface, which further protects it from the corrosive environment. The dissolution of Mg4Al3Si4- precipitates in Al matrix further helps in reducing the net electrochemical potential difference between Al matrix and grain boundaries, which leads to improvement in corrosion potential. It was reported that initial Mg4Al3Si4-precipitates act as an anode and Al matrix as cathode [39-41]. So, decrease in pitting potential after RTR was due to precipitation of stable Mg4Al3Si4 precipitates, which formed galvanic cell with the Al matrix and acted as potential site for pitting and further removed the passive film from the surface. The passivation potential range was high after CR due to high dislocation density and Mg4Al3Si4-precipitates dissolution into the Al matrix. After annealing at 100 ��C, in CR, ��COR, ��PIT and ��PIT-��RP are found to be -1.246 V, -705 mV and 76 mV, respectively. The annealing further improves the corrosion potential due to the removal of crystalline defect from the matrix (as some regions are heavily deformed and some are less deformed), which formed galvanic cell with Al matrix and decreased corrosion potential. The pitting potential remains constant because Mg4Al3Si4 still remains in Al matrix in CR sample. The passivation potential range decreased due to decrease in dislocation density. After annealing at 100 ��C, in RTR, ��COR, ��PIT and ��PIT-��RP are found to be -1.246 V, -722 mV and 48 mV, respectively. The corrosion potential was the same as found in CR, which might be due to the removal of crystalline defect and dislocation density after 100 ��C annealing. The decrease in pitting potential was due to the presence of Mg4Al3Si4- precipitates in Al matrix.
Table 3 Corrosion property of CR and RTR and annealed 6082 Al alloy from 100 to 400 ��C
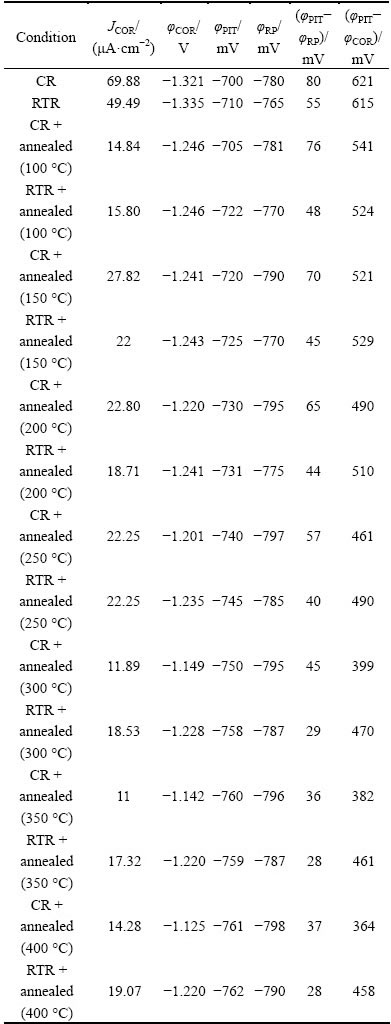
The corrosion potentials of CR and RTR have further improved as the annealing temperature increased from 100 to 300 ��C and beyond that they remain constant (Table 3). The increase in corrosion potential in CR was higher as compared to RTR. The CR produced heavily deformed UFG as compared to RTR, leading to higher crystalline defect (grain boundary area). With the annealing treatment, recovery, recrystallisation and grain growth have occurred, leading to the removal of crystalline defects and increase in corrosion potential. In RTR, corrosion potential has increased as annealing temperature was increased from 100 to 200 ��C and beyond that it remains constant (Table 3). It is evident from DSC and EBSD results that recovery, recrystallisation and grain growth occurred in CR at 250 ��C, 250-300 ��C, and 300 ��C, respectively. However, in RTR, recovery (up to 200 ��C), recrystallisation (200-250 ��C) and grain growth (from 300 ��C) have occurred with the respective temperature given in the bracket. It can be concluded that recovery and recrystallisation influence the corrosion potential heavily as compared to grain growth.
The pitting potential of CR samples has decreased as the annealing temperature increased from 100 to 300 ��C and beyond 300 ��C, it remains constant. It was evident from XRD and DSC results that when the annealing temperature was increased to 300 ��C, precipitation of Mg4Al3Si4 occurred from Al matrix. At 350 ��C, complete precipitation of Mg4Al3Si4 occurred from the Al matrix as confirmed from DSC results and beyond that coarsening of Mg4Al3Si4-precipitates occurred. It can be concluded that the Mg4Al3Si4- precipitates dissolution was desirable for improving pitting potential, whereas coarsening of Mg4Al3Si4- precipitates does not affect the pitting resistance.
Passivation potential range was strongly influenced by the crystalline defect as shown in Table 3. It was clear from XRD results that with the increase in annealing temperature from 100 to 400 ��C, after CR and RTR, dislocation density decreased and coarsening of grains started as confirmed from EBSD and TEM results, which leads to decrease in crystalline defect. The passivation potential range has decreased with the increasing annealing temperature. Large passivation potential range of CR as compared to RTR is due to a high crystalline defect in CR and it has decreased up to 300 ��C, beyond that it remains constant. It is due to recovery and recrystallisation, which occurred up to 300 ��C, beyond that grain growth has occurred in CR samples. Whereas, in RTR samples, the passivation potential range decreased up to 250 ��C annealing temperature, due to recovery and recrystallisation and beyond 250 ��C, it remained constant due to grain growth.
4 Conclusions
1) The increase in dislocation density and decrease in SFE after CR as compared to RTR were due to suppression of dislocation annihilation. After CR, dislocation density decreased slowly upon annealing from 100 to 250 ��C, rapidly from 250 to 300 ��C and beyond 300 ��C, it remains constant. However, in RTR, the dislocation density decreased slowly from 100 to 200 ��C, rapidly from 200 to 250 ��C and beyond 250 ��C, it remains constant.
2) After CR, Mg4Al3Si4-precipitates remain in the Al matrix, but after RTR, due to local heating during processing, Mg4Al3Si4-precipitates evolved from the Al matrix as confirmed from XRD and TEM.
3) The recovery starts in the CR sample around 130 ��C, whereas in RTR, around 160 ��C as observed from the DSC curve. The recrystallisation exothermic peak was found in CR and RTR samples even after annealing at 250 and 200 ��C, respectively. These results support the effective suppression of dislocation annihilation in the CR sample as compared to RTR.
4) In CR sample, high angle grain boundary has increased up to annealing at 250 ��C (for RTR up to 200 ��C), conversion of very low angle grain boundary into low angle grain boundary has occurred and high angle grain boundary is constant from 250 to 300 ��C (for RTR from 200 to 250 ��C) and beyond 300 ��C (for RTR 250 ��C), grain growth has started.
5) Thermal stability of CR was observed up to 250 ��C, whereas for RTR, it was observed up to 200 ��C. In CR, Mg4Al3Si4 was fully dissolved into the Al matrix and with the annealing temperature increased to 250 ��C, ��' evolved from Al matrix, which retards the grain boundary motion by Zener drag effect. Whereas, in RTR sample, some fractions of Mg4Al3Si4 evolved from Al matrix due to local heating. When the annealing temperature was increased beyond 200 ��C, Mg4Al3Si4- precipitates became coarse and produced a less Zener drag effect in RTR sample.
6) The CR showed the formation of ��'' (needle shape), ��' (rod shape) and �� (plate shape) precipitates after annealing at 200, 250 and 300 ��C, respectively. Whereas, RTR sample showed the presence of ��'' and ��' precipitates after annealing at 200 ��C and ��-precipitates after 250 ��C, respectively. The hardness and strength were higher for the CR sample as compared to RTR due to effective suppression of dislocation annihilation. The hardness and strength of CR sample (HV 127 and 345 MPa) have increased with the increasing annealing temperature up to 200 ��C due to the formation of coherent ��''-precipitates. However, in RTR after annealing treatment at 200 ��C, coherent-��'' and semi coherent ��'-precipitates emerged out from Al matrix. The hardness and tensile strength decreased rapidly in CR and RTR alloys with the increase in annealing temperature.
7) After CR, corrosion and pitting potentials have increased as compared to RTR. After CR, Mg4Al3Si4 precipitates remain dissolved into the Al matrix because net electrochemical potential difference between Al matrix and grain boundary was low. The precipitation of Mg4Al3Si4 occurs in RTR sample, which acts as a pitting site by forming galvanic cell with the Al matrix.
8) The passivation potential range of CR is higher as compared to RTR. The CR produces higher amounts of crystalline defects as compared to RTR, which further helps in the formation of a dense oxide film on the surface. As the annealing temperature is increased to 300 ��C, the passivation potential range has reduced due to the removal of crystalline defect in CR as well as in RTR sample.
9) The recovery, recrystallisation and grain growth have occurred at much higher annealing temperature in CR alloy as compared to RTR alloy.
References
[1] GAVGALI M, AKSAKAL B. Effects of various homogenisation treatments on the hot workability of ingot aluminium alloy AA2014 [J]. Materials Science and Engineering A, 1998, 254: 189-199.
[2] HANSEN N. Hall�CPetch relation and boundary strengthening [J]. Scripta Materialia, 2004, 51: 801-806.
[3] SABIROV I, MURASHKIN M YU, VALIEV R Z. Nanostructured aluminium alloys produced by severe plastic deformation: New horizons in development [J]. Materials Science and Engineering A, 2013, 506: 1-24.
[4] PANIGRAHI S K, JAYAGANTHAN R, PANCHOLI V. Effect of plastic deformation conditions on microstructural characteristics and mechanical properties of Al 6063 alloy [J]. Materials and Design, 2009, 30: 1894-1901.
[5] SARMA V S, SIVAPRASAD K, STURM D, HEILMAIER M. Microstructure and mechanical properties of ultra fine grained Cu-Zn and Cu-Al alloys produced by cryorolling and annealing [J]. Materials Science and Engineering A, 2008, 489: 253-258.
[6] KRISHNA N N, AKASH A K, SIVAPRASAD K, NARAYANASAMY R. Studies on void coalescence analysis of nanocrystalline cryorolled commercially pure aluminium formed under different stress conditions [J]. Materials and Design, 2010, 31: 3578-3584.
[7] KRISHNA K G, SIVAPRASAD K, VENKATESWARLU K, HARI KUMAR K C. Microstructural evolution and aging behavior of cryorolled Al-4Zn-2Mg alloy [J]. Materials Science and Engineering A, 2012, 535: 129-135.
[8] KRISHNA K, SEKHAR K C, TEJAS R, KRISHNA N N, SIVAPRASAD K, NARAYANASAMY R, VENKATESWARLU K. Effect of cryorolling on thermomechanical properties of AA5083 alloy and the Portevin�CLe-Chatelier phenomenon [J]. Materials and Design, 2015, 67: 107-117.
[9] KRISHNA K G, SIVAPRASAD K, NARAYANAN T S N S, KUMAR K C H. Localized corrosion of an ultrafine grained Al-4Zn-2Mg alloy produced by cryorolling [J]. Corrosion Science, 2012, 60: 82-89.
[10] KRISHNA N N, GOPI B, SIVAPRASAD K, MUTHUPANDI V. Studies on potentiodynamic polarization behaviour of cryorolled Al-Mg-Si alloy [J]. Key Engineering Materials, 2013, 545: 153-157.
[11] ANDERSEN S J, ZANDBERGEN H W, JANSEN J,  C, TUNDAL U, REISO O. The crystal structure of the �¡� phase in Al-Mg-Si alloys [J]. Acta Materialia, 1998, 46: 3283-3298.
[12] RAVI C, WOLVERTON C. First-principles study of crystal structure and stability of Al-Mg-Si-(Cu) precipitates [J]. Acta Materialia, 2004, 52: 4213-4227.
[13] HASTING H S,  A G, ANDERSEN S J, VISSERS R, WALMSLEY J C, MARIOARA C D, DANOIX F, LEFEBVRE W, HOLMESTAD R. Composition of ��'' precipitates in Al-Mg-Si alloys by atom probe tomography and first principles calculations [J]. Journal of Applied Physics, 2009, 106(12): 123527.
[14] WANG S H, LIU C H, CHEN J H, LI X L, ZHU D H, TAO G H. Hierarchical nanostructures strengthen Al-Mg-Si alloys processed by deformation and aging [J]. Materials Science and Engineering A, 2013, 585: 233-242.
[15] KUMAR N, RAO P N, JAYAGANTHAN R, BROKMEIER H G. Effect of cryorolling and annealing on recovery, recrystallisation, grain growth and their influence on mechanical and corrosion behaviour of 6082 Al alloy [J]. Materials Chemistry and Physics, 2015, 165: 177-187.
[16] ZHANG X, YANG X, CHEN W, QIN J, FOUSE J. Effects of rolling temperature and subsequent annealing on mechanical properties of ultrafine-grained Cu-Zn-Si alloy [J]. Materials Characterization, 2015, 106: 100-107.
[17] KRISHNA N N, ASHFAQ M, SUSILA P, SIVAPRASAD K, VENKATESWARLU K. Mechanical anisotropy and microstructural changes during cryorolling of Al-Mg-Si alloy [J]. Materials Characterization, 2015, 107: 302-308.
[18] DHAL A, PANIGRAHI S K, SHUNMUGAM M S. Influence of annealing on stain hardening behaviour and fracture properties of a cryorolled Al 2014 alloy [J]. Materials Science and Engineering A, 2015, 645: 383-392.
[19] KUMAR N, GOEL S, JAYAGANTHAN R, BROKMEIER H G. Effect of grain boundary misorientation, deformation temperature and ALFeMnSi-phase on fatigue life of 6082 Al alloy [J]. Materials Characterization, 2017, 124: 229-240.
[20] PANIGRAHI S K, JAYAGANTHAN R, CHAWLA V. Effect of cryorolling on microstructure of Al-Mg-Si alloy [J]. Materials Letters, 2008, 62: 2626-2629.
[21] RANGARAJU N, RAGHURAM T, KRISHNA B V, RAO K P, VENUGOPAL P. Effect of cryo-rolling and annealing on microstructure and properties of commercially pure aluminium [J]. Materials Science and Engineering A, 2005, 398: 246-251.
[22] WANG Y, CHEN M, ZHOU F, MA E N. High tensile ductility in a nanostructured metal [J]. Nature, 2002, 419: 912-915.
[23] LEE Y B, SHIN D H, PARK K-Tae, NAM W J. Effect of annealing temperature on microstructure and mechanical properties of a 5083 Al alloy deformed at cryogenic temperature [J]. Scripta Materialia, 2004, 51: 355-359.
[24] SARMA V S, SIVAPRASAD K, STURM D, HEILMAIER M. Microstructure and mechanical properties of ultra fine grained Cu-Zn and Cu-Al alloys produced by cryorolling and annealing [J]. Materials Science and Engineering A, 2008, 489: 253-258.
[25] PANIGRAHI S K, JAYAGANTHAN R. Effect of annealing on precipitation, microstructural stability, and mechanical properties of cryorolled Al 6063 alloy [J]. Journal of Material Science, 2010, 45: 5624-5636.
[26] PANIGRAHI S K, JAYAGANTHAN R. Effect of annealing on thermal stability, precipitate evolution, and mechanical properties of cryorolled Al 7075 alloy [J]. Metallurgical and Materials Transaction A, 2011, 42: 3208-3217.
[27] KUMAR N, GOEL S, JAYAGANTHAN R, BROKMEIER H G. Effect of solution treatment on mechanical and corrosion behaviors of 6082-T6 Al alloy [J]. Metallography, Microstructure, and Analysis, 2015, 4: 411-422.
[28] WILLIAMSON G K, HALL W H. X-ray line broadening from filed aluminum and wolfram [J]. Acta Metallurgica, 1953, 1: 22.
[29] SMALLMAN R E, WESTMACOTT K H. Stacking faults in face-centred cubic metals and alloys [J]. Philosophical Magazine, 1957, 2(1): 669-683.
[30] WARREN B E. X-ray diffraction [M]. Reading MA: Addison-Wesley, 1969.
[31] TALONEN J, HANNINEN H. Formation of shear bands and strain-induced martensite during plastic deformation of metastable austenitic stainless steels [J]. Acta Materialia, 2007, 55: 6108-6118.
[32] JIANG B H, QI X, YANG S X, ZHOU W M, HSU T Y. Effect of stacking fault probability on ��-�� martensitic transformation and shape memory effect in Fe-Mn-Si based alloys [J]. Acta Materialia, 1998, 46(2): 501-510.
[33] SCHRAMM R E, REED R P. Stacking-fault energies of 7 commercial austenitic stainless-steels [J]. Metallurgical and Materials Transaction A, 1975, 6: 1345-1351.
[34] MARIOARA C D, ANDERSEN S J, ZANDBERGEN H W, HOLMESTAD R. The influence of Alloy composition on precipitates of the Al-Mg-Si system [J]. Metallurgical and materials Transaction A, 2005, 36: 691-702.
[35] MATSUDA K, SAKAGUCHI Y, MIYATA Y, UETANI Y, SATO T, KAMIO A, IKENO S. Precipitation sequence of various kinds of metastable phases in Al-1.0mass%Mg2Si-0.4mass%Si alloy [J]. Journal of Material Science, 2000, 35: 179-189.
[36] RAO P N, VISWANADH B, JAYAGANTHAN R. Effect of cryorolling and warm rolling on precipitation evolution in Al 6061 alloy [J]. Materials Science and Engineering A, 2014, 606: 1-10.
[37] BIROL Y. DSC analysis of the precipitation reaction in AA6005 alloy [J]. Journal of Thermal Analysis andCalorimetry, 2008, 93(3): 997(981).
[38] SARMA V S, WANG J, JIAN W W, KAUFFMANN A, CONRAD H, FREUDENBERGER J, ZHU Y T. Role of stacking fault energy in strengthening due to cryo-deformation of FCC metals [J]. Materials Science and Engineering A, 2010, 527: 7624-7630.
[39] ZENG Feng-li, WEI Zhong-ling, LI Jin-feng, LI Chao-xing, TAN Xing, ZHANG Zhao, ZHEN Zi-qiao. Corrosion mechanism associated with Mg2Si and Si particles in Al-Mg-Si alloys [J].Transactions of Nonferrous Metals Society of China, 2011, 21: 2559-2567.
[40] BUCHHEIT R G, GRANT R P, HLAVA P F, MCKENZIE B, ZENDER G L. Local dissolution phenomena associated with S phase (Al2CuMg) particles in aluminum alloy 2024-T3 [J]. Journal of Electrochemical Society, 1997, 144: 2621-2628.
[41] LI Jin-feng, ZHENG Zi-qiao, NA Jiang, TAN Cheng-yu. Study on localized corrosion mechanism of 2xxx series Al alloy containing S(Al2CuMg) and �ȡ�(Al2Cu) precipitates in 4.0% NaCl solution at pH=6.1 [J]. Material Chemistry and Phyics, 2005, 91: 325-329.
Nikhil KUMAR1, R. JAYAGANTHAN1,2, BROKMEIER3
1. Department of Metallurgical and Materials Engineering & Centre of Nanotechnology, Indian Institute of Technology Roorkee, Roorkee 247667, India;
2. Department of Engineering Design, Indian Institute of Technology Madras, Chennai 600036, India;
3. Institute of Materials Science and Engineering, Clausthal University of Technology, Agricolastrasse 6, D-38678 Clausthal-Zellerfeld, Germany & Helmholtz Zentrum Geesthacht, Max Planck 1, D-21502 Geesthacht, Germany
ժ Ҫ���о��������ơ��������ƺͺ����˻��6082���Ͻ������ࡢ����֯�ݱ�(�ظ����ٽᾧ�뾧������)����ѧ���ܺ�ʴ��Ϊ��Ӱ�졣���ò�ʾɨ�������ǡ�����������ͱ�ɢ����������о��������ơ��������Ƽ������ȴ�����Ʒ����������ѧ������֯��ò����̽������ѧ���ܡ���200 ��C�˻������������Ʒ�Ŀ���ǿ�Ⱥ�Ӳ��(345 MPa��HV 127)������������Ʒ�Ŀ���ǿ�Ⱥ�Ӳ��(320 MPa��HV 115)���ߡ�200 ��C�˻������������Ʒ����ǿ�Ⱥ�Ӳ�ȵõ��������Ϊ��������������''�࣬������������Ʒ��Ȳ��������Zener������������������Ʒ�ĸ�ʴ�͵�ʴ��λ(-1.335 V��-710 mV)��ȣ�����������Ʒ�ĸ�ʴ�͵�ʴ��λ(-1.321 V��-700 mV)Ҳ�õ���ߡ�����������Ʒ���нϸߵ�λ���ܶȣ�Mg4Al3Si4�������ܽ�����У�ͨ���γɶۻ������������ԭ��ص��γɣ�ʹ��Ʒ�Ŀ���ʴ���ܵõ���ߡ�
�ؼ��ʣ����Ͻ��������ƣ���ѧ���ܣ���ʴ��λ��������
(Edited by Yun-bin HE)
Corresponding author: R. JAYAGANTHAN; Tel: +91-1332-285869; Fax: +91-1332-285243; E-mail: rjayafmt@iitr.ernet.in; metarj@iitm.ac.in
DOI: 10.1016/S1003-6326(17)60055-4

