TB6钛合金高速铣削三维表面形貌及疲劳行为
来源期刊:中国有色金属学报(英文版)2013年第3期
论文作者:姚倡锋 武导侠 靳淇超 黄新春 任军学 张定华
文章页码:650 - 660
Key words:TB6 titanium alloy; high-speed milling; surface roughness; surface topography; fatigue life; fatigue fracture
摘 要:钛合金高速铣削以高效率、高质量的优点而被广泛应用于航空航天工业。为了优化高速铣削中控制表面粗糙度的工艺参数,通过高速侧面铣削试验及疲劳试验,研究高速铣削参数对三维表面形貌和疲劳寿命的影响。通过疲劳试样断口观测,揭示表面形貌对疲劳裂纹产生的作用机制。研究表明:铣削速度优选范围为100~140 m/min,每齿进给量优选范围为0.02~0.06 mm/z,可保障表面粗糙度在0.8 μm内。基于表面应力集中系数建立的疲劳寿命模型与实验结果的平均误差为6.25%。疲劳裂纹起源于试件已加工表面的相交棱处。
Abstract: High-speed milling of titanium alloys is widely used in aviation and aerospace industries for its high efficiency and good quality. In order to optimize the machining parameters in high-speed milling TB6 titanium alloy, experiments of high-speed milling and fatigue were conducted to investigate the effect of parameters on 3D surface topography and fatigue life. Based on the fatigue fracture, the effect mechanism of surface topography on the fatigue crack initiation was proposed. The experiment results show that when the milling speed ranged from 100 m/min to 140 m/min, and the feed per tooth ranged from 0.02 mm/z to 0.06 mm/z, the obtained surface roughness were within the limit (<0.8 μm). Fatigue life decreased sharply with the increase of surface equivalent stress concentration factor. The average error of fatigue life between the established model and the experimental results was 6.25%. The fatigue cracks nucleated at the intersection edge of machined surface.
Trans. Nonferrous Met. Soc. China 23(2013) 650-660
Chang-feng YAO, Dao-xia WU, Qi-chao JIN, Xin-chun HUANG, Jun-xue REN, Ding-hua ZHANG
Key Laboratory of Contemporary Design and Integrated Manufacturing Technology, Ministry of Education, Northwestern Polytechnical University, Xi’an 710072, China
Received 1 February 2012; accepted 20 July 2012
Abstract: High-speed milling of titanium alloys is widely used in aviation and aerospace industries for its high efficiency and good quality. In order to optimize the machining parameters in high-speed milling TB6 titanium alloy, experiments of high-speed milling and fatigue were conducted to investigate the effect of parameters on 3D surface topography and fatigue life. Based on the fatigue fracture, the effect mechanism of surface topography on the fatigue crack initiation was proposed. The experiment results show that when the milling speed ranged from 100 m/min to 140 m/min, and the feed per tooth ranged from 0.02 mm/z to 0.06 mm/z, the obtained surface roughness were within the limit (<0.8 μm). Fatigue life decreased sharply with the increase of surface equivalent stress concentration factor. The average error of fatigue life between the established model and the experimental results was 6.25%. The fatigue cracks nucleated at the intersection edge of machined surface.
Key words: TB6 titanium alloy; high-speed milling; surface roughness; surface topography; fatigue life; fatigue fracture
1 Introduction
Among many high strength alloys, titanium alloys have been widely used in aerospace, aviation and other industries due to their excellent properties such as high strength, low density, high corrosion resistance and low linear expansion coefficient. TB6 alloy is a kind of beta type titanium alloy which has high strength, high toughness and excellent thermal processing performances. Because of the excellent comprehensive performance, TB6 alloy has been concerned by scholars in many countries. WANG et al [1] reported that TB6 alloy can effectively reduce the mass of the structural component due to its high specific strength. For instance, when using TB6 instead of the equal strength 20CrMnSiA and TC4 in the aircraft fuselage, wing and landing gear structures, the mass of the structural parts can be reduced by about 40% and 20% respectively. Therefore, TB6 alloy has wide application in aviation industries.
Surface roughness and surface topography are important characteristics to describe and evaluate the surface quality of components, which play a very important role in wear-resistance, fatigue property, stress corrosion cracking of components [2]. As can be seen from the fracture mechanics, the bigger the surface roughness values are, the deeper the surface grooves are, the smaller the profile valley radii are, the more serious the stress concentration is, and the poorer the anti-fatigue performance induced is. The fatigue strength of components reduces with the increased surface roughness value, and this phenomenon is more outstanding for high strength alloy materials [3]. So we must pay attention to controlling the surface roughness and surface topography when machining high strength alloy materials. High-speed machining technology is one of the key processing technologies to ensure the surface roughness and surface topography.
Many scholars conducted positive researches on the surface integrity of high-speed milled titanium alloy. MANTLE and ASPINWALL [4] studied the surface integrity of high speed milled g-TiAl, and found that the surface roughness values were typically less than 1.5 μm. JAWAHIR et al [5] reported their research of surface integrity in material removal processes. Tool wear criterion, tool life and surface roughness in high-speed milling TC4 alloy were studied by ZHANG and LI [6].
CHE-HARON and JAWAID [7,8] observed the similar phenomena that the surface tended to become smoother toward the end of tool life when turning TC4. SHI et al [9] related the comparative machining experiments of TC4 in high-speed milling and normal conditions, and the results showed that high speed milling is beneficial in both improving manufacturing efficiency and surface quality. DU et al [10] and YANG et al [11] found that when a flat-bottomed cutter milled TC4, the surface roughness value decreased with the increase of spindle speed in the range of 3000-10000 r/min. ZHANG et al [12] reported that fatigue life decreased with the increased surface roughness. An approximate quadratic curve has been found to suit the relationship between the roughness and logarithmic fatigue lives with given survivability. YU et al [13] and WANG et al [14] reported that there were multiple crack initiation sites on the fractograph of the notched specimens, and the percent of fatigue cracks propagation life in overall life of the notched specimens was larger than that of the smooth specimen. Fatigue source was easily formed in the droplet area under applied stress. LI et al [15] found that corrosion medium retarded the growth of the cracks at the early stage in the environment of 3.5% NaCl solution, but then it accelerated the growth of the fatigue cracks when the stress intensity factor exceeded 14 MPa・m1/2.
Although a lot of researches about the high-speed milling of titanium alloys have been done, current research is often addressed to study the effect of machining parameters on surface roughness. The study of 3D surface topography and fatigue behavior is still rare in high-speed milling. In addition, the research about the effect of surface topography on fatigue life is extremely lack. This study orientated TB6 alloy. In order to optimize machining parameters in high-speed milling, the experiments of high-speed milling and fatigue were done to investigate the effect of milling parameters on 3D surface topography, and the effect of surface roughness on fatigue life. Based on the fatigue fracture, the mechanism of surface topography on fatigue crack initiation was revealed.
2 Experimental
2.1 Workpiece material
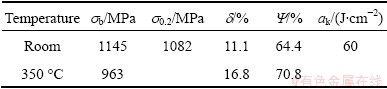
The workpiece material used in all experiments was TB6 alloy (Ti-10V-2Fe-3Al), a kind of high strength and high toughness beta type titanium alloy. The chemical compositions of the alloy are given in Table 1. Rough material used for this study was solution treated at 750 °C for 2 h, water quenched, aged at 530 °C for 8 h, and then air cooled. The mechanical properties of the tested material are shown in Table 2.
Table 1 Chemical composition of TB6 (mass fraction, %)

Table 2 Mechanical properties of TB6
2.2 High-speed milling experiment and surface roughness measurement
The workpiece dimensions were 55 mm×50 mm×25 mm. All milling experiments were carried out on a VMC 850 three-coordinate vertical CNC milling machine by emulsion cooling way. The power of spindle drive motor was 22 kW. The machine spindle was capable of running up to 8000 r/min. According to the materials of machine and specimens, uncoated cemented carbide end milling cutters with 4 teeth were used. The diameter of the cutting tool was 10 mm. Side milling and down milling were used in the experiment. The side milling diagram is shown in Fig. 1.
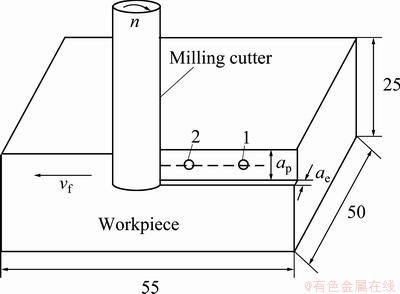
Fig. 1 Side milling diagram (unit: mm)
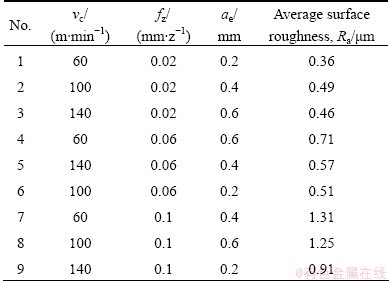
In order to study the effect of milling parameters on surface roughness, the orthogonal experiments of three factors and three levels were conducted. Milling speed vc, feed per tooth fz, and milling width ae were chosen as the main influence factors of surface roughness. Milling depth ap was kept constant at 10 mm. The cutting conditions are shown in Table 3.
Surface roughness and surface topography were obtained with a three-dimensional optical surface topography tester Veeco NT1100. During measuring operation, the amplification factor was 10, the measurement resolution was 736×480, and the sample size of measuring point was 830.22 nm× 830.22 nm. Five equidistant points were selected along the feed direction on the machined surface, as points 1, 2 till 5 shown in Fig. 1. Each measuring point was tested three times and averaged for the sake of statistical significance of the measurements. The average surface roughness is shown in Table 3.
Table 3 Cutting experiment scheme and results
2.3 Fatigue specimen and fatigue experiment
In order to study the fatigue property and fracture characteristics of the machined surface, smooth fatigue specimen (Kt=1) was designed as shown in Fig. 2.
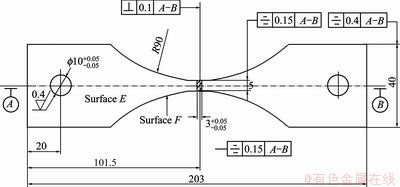
Fig. 2 Fatigue testing specimen sketch (unit: mm)
The thickness of fatigue specimen was 3 mm. End milling operation was performed on the surface E, namely the milling parameters were: vc=100 m/min, fz=0.04 mm/z, ae=7 mm, ap=0.1 mm. Side milling operation was performed on surface F. When ae and ap were set at 0.2 mm and 9 mm, respectively, five different surface topographes and surface roughnesses were obtained by changing vc and fz. Specific side milling parameters of surface F are shown in Table 4. Specimens No. 10-14 were mainly to establish the fatigue life model in terms of the surface roughness and equivalent stress concentration factor. Considering the dispersion of fatigue life, for each parameter, five specimens were machined. In order to calculate the surface equivalent stress concentration factor , simultaneous acquisition of peak to valley height Ry, ten-point roughness Rz, and effective profile valleys radius
 are shown in Table 4.
All fatigue experiments were carried out on a 2HFP421 high frequency tensile fatigue testing machine. Throughout experiments, the loading frequency was 85-87 Hz, the loading waveform was sine wave, the cyclic stress ratio R was 0.1, and the maximum nominal stress was 845 MPa. The fatigue experiments were carried out at room temperature. The average fatigue lives of specimens are shown in Table 4. The fracture of fatigue specimens was observed using a QUANTA 200 scanning electron microscope (SEM) in a secondary electron (SE) mode.
3 Surface roughness and surface topography of TB6 in high-speed side milling
3.1 Effects of milling parameters on surface roughness
The mathematical model of surface roughness was built by using multiple linear regression analysis based on the data in Table 3 as follows:
 (1)
(1)
From Eq. (1) the surface roughness is most sensitive to the variation of the feed per tooth fz, secondarily sensitive to the cutting width, and least sensitive to the milling speed vc.
The effect of high-speed milling parameters on the surface roughness is shown in Fig. 3. The effect of milling speed on the surface roughness is given in Fig. 3(a). Slightly higher surface roughness values were recorded at a lower milling speed. This is probably due to the significant impacts of built-up edge and burr on the surface quality. Because of the high milling force and high temperature, built-up edge and burr are easily produced at a lower milling speed. Increasing the milling speed led to a higher milling temperature, which made the materials become soft and be easily cut out. Built-up edge and burr are not easily produced and the lower surface roughness value can be obtained.
Table 4 Machining parameters and surface roughness of fatigue specimen
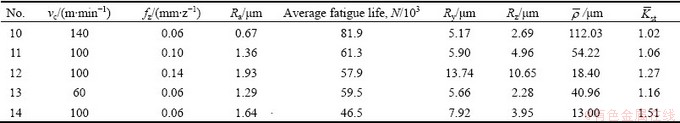
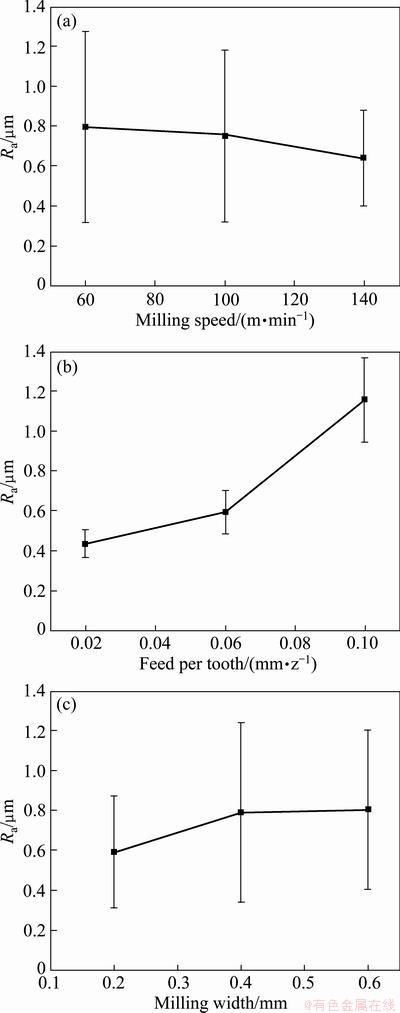
Fig. 3 Effect of cutting parameters on surface roughness
Figure 3(b) shows that the roughness values increased significantly with the increasing of feed per tooth, especially when the feed per tooth exceeded 0.06 mm/z. By geometric point, decreasing the feed per tooth led to lower height of residual area and lower height of built-up edge and burr, therefore the surface roughness decreased as the feed per tooth reduced. However, the surface roughness values didn’t decrease obviously when the feed per tooth approached a certain value because plastic deformation was dominant in this process.
Figure 3(c) shows that the surface roughness increased as the milling width increased. The reason was that increasing the milling width led to higher milling force and higher milling temperature, which easily induced built-up edge and burr on the machined surface and intensified the milling chatter. All of these factors adversely influenced the surface roughness. As can be seen from Fig. 3(c), the surface roughness values increased dramatically when the milling width was less than 0.4 mm, and the highest surface roughness value was 0.806 μm.
3.2 Effects of milling parameters interaction on surface roughness
For improving the surface quality, the optimization of milling parameters must be based on the interaction effect of milling parameters on the surface roughness. The effect of milling parameters interaction on surface roughness is shown in Fig. 4.
Figure 4(a) shows that higher surface voughness values appeared in the region of low milling speed and high feed per tooth (region A). This is because the surface layer of workpiece was more easily torn under this milling condition. Surface roughness values in this region were higher than 1.0 μm. Lower surface roughness values appeared in the region of high milling speed and low feed per tooth (region C). Milling process was sharper under this condition, and the surface roughness values were below 0.6 μm. Surface quality in region B was between region A and region C, and the range of roughness values was 0.6-1.0 μm.
Figure 4(b) shows that higher surface roughness values appeared in the region of high milling width and high feed per tooth (region D). This is probably caused by the high residual height on the machined surface. The roughness values in this region were around 1.0 μm. Lower roughness values appeared in the region of low width and low feed per tooth (region F). The roughness values were controlled below 0.6 μm. Region E was the transition region of regions F and D. The roughness values ranged from 0.6 μm to 1.0 μm.
Figure 4(c) shows that higher roughness values are given in the region of high width and low milling speed (region G). This is probably due to the large milling force and the “tearing” phenomenon. The surface roughness values in this region were around 0.9 μm. The lower roughness values appeared in the region of low milling width and high milling speed (region I). Surface roughness values were controlled below 0.65 μm. Region H was the transition region of regions I and G. The roughness values ranged from 0.65 μm to 0.9 μm.
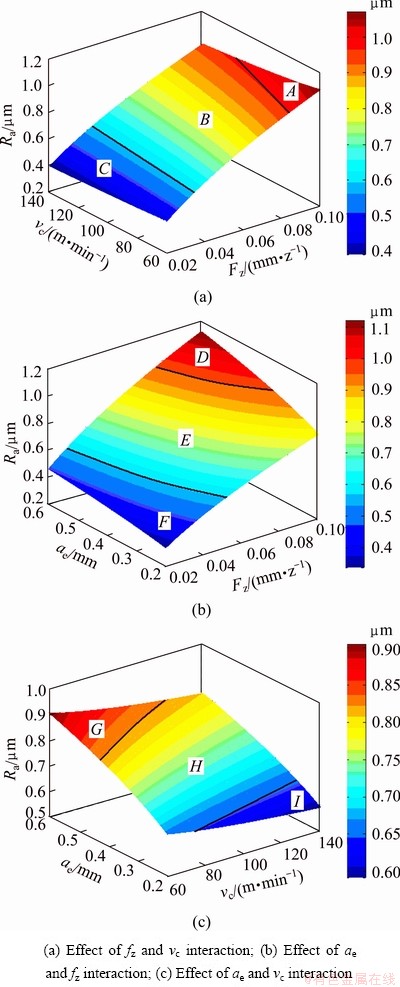
Fig. 4 Effect of milling parameters interaction on surface roughness
3.3 Effect of milling parameters on surface topograph
The surface topographs of workpieces Nos. 1-9 are shown in Fig. 5. The stair-stepping processing texture can be found on all the machined surfaces. Relative movement of cutter and workpiece resulted in the final surface topograph, which explicitly reflected the movement track of cutting edge. The shape of cutting edge was copied on the machined surface. The displacement of uniform space ridges along the feed direction was equal to the feed per tooth value. There were delicate grooves between the ridge and ridge. Obvious ridges can be seen in Figs. 5(g)-(i). This is probably due to the big feed per tooth of 0.1 mm/z. The surface topographs recorded for feed per tooth of 0.02 mm/z was smooth as shown in Figs. 5(a)-(c). The reason of grooves produced had two aspects. Firstly, hard spots on cutter surface plowed the machined surface; secondly, the grooves of cutter worn surface copied on the machined surface. Between the two adjacent ridges, the machined surface near the cutter tip (inner ring of ridge arc) was smoother than that near the minor flank and the side cutting edge tail.
It can be found from the experiments that the proportion of milling speed and feed per tooth can affect the surface topograph. The surface roughness values in Figs. 5(a)-(c) were all below 0.5 μm. Regardless of the milling speed and milling width, the surface roughness values recorded were below 0.5 μm when the feed per tooth was 0.02 mm/z. For the feed per tooth of 0.06 mm/z, the distance between the ridges increased as the milling speed increased. The ridges changed from dense as shown in Figs. 5(d) and (f) to sparse as shown in Fig. 5(e). This is probably caused by the residual height between the front tooth and the latter tooth in the milling process. When the feed per tooth was kept constant, the feed speed increased with the increased milling speed, resulting in the increased displacement of ridges. This phenomenon was more obvious for the higher feed per tooth, as shown in Figs. 5(g)-(i). This phenomenon was less obvious for the lower feed per tooth, as shown in Figs. 5(a)-(c).
4 Fatigue behavior of machined surface
4.1 Effect of surface roughness and surface topograph on fatigue life
Fatigue life was greatly influenced by the surface roughness. Compared with specimens Nos. 11-14, the fatigue life of specimen No. 10 was improved by about 33.6%, 41.5%, 37.6%, and 43.22%, respectively. Based on the surface roughness and fatigue lives in Table 4, fatigue life model based on the average surface roughness was established as follows:
 (2)
(2)
where N is the fatigue life, and Ra is the surface roughness.
The effect of surface roughness on the fatigue life is shown in Fig. 6. The fatigue life decreased dramatically as the surface roughness increased. As can be seen in Fig. 6, although the highest fatigue life was obtained from specimen No. 10 with the lowest Ra, the reduction in fatigue life with increasing roughness did not occur in a consistent manner. The surface roughness of specimen No. 12 was much bigger than that of specimen No. 11 or 13, but the fatigue life of specimen No. 12 was approximately equal to that of specimens No. 11 and 13. The surface quality of specimen No. 14 was better than that of specimen No. 12, while the fatigue life of specimen No. 14 was lower than that of specimen No. 12.
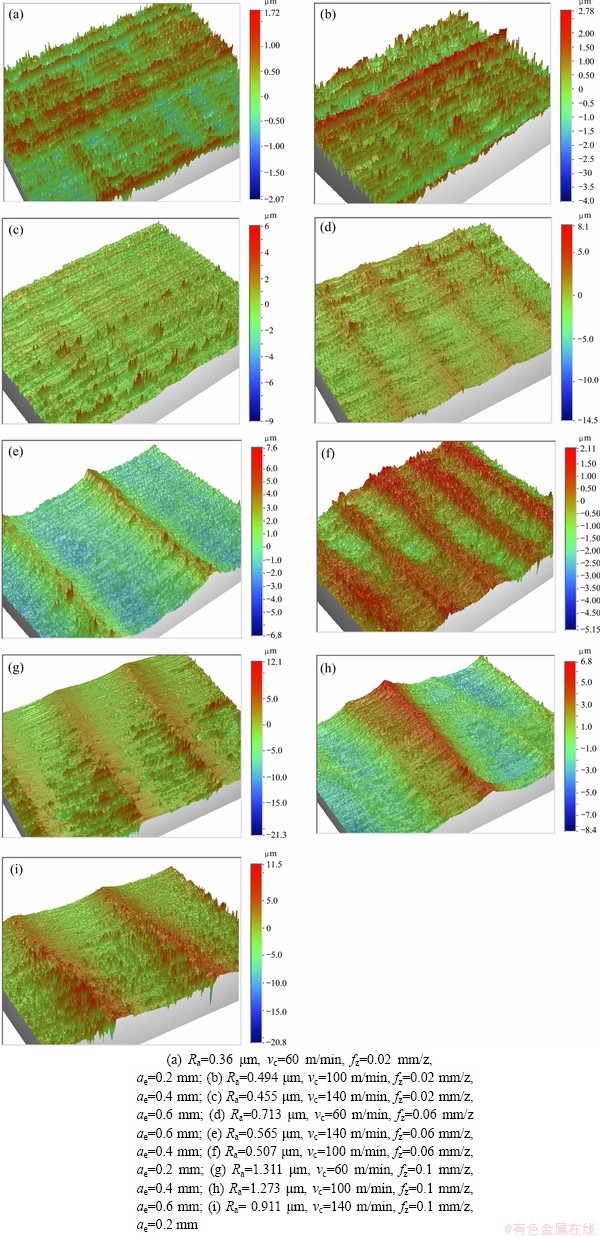
Fig. 5 Surface topographs under different milling parameters

Fig. 6 Effect of average surface roughness on fatigue life
The surface quality of a component is generally inferred by the average surface roughness. However, Ra does not provide a reliable estimate for the reduction in strength of components.
The surface topographs of fatigue specimens under four different milling parameters are shown in Fig. 7. Figure 7(a) shows that dense ridges appeared on the machined surface. The surface roughness was 0.67 μm, the maximum trough was 8.3 μm, and the average profile valley radius was 112.03 μm. In Fig. 7(d), the surface roughness was 1.29 μm, the maximum trough was 4.2 μm, and the average profile valley radius was 40.96 μm. Figure 7(b) shows that the sparse ridges appeared on the machined surface. The surface roughness was 1.36 μm, the maximum trough was 12 μm, and the average root radius was 54.22 μm. The ridges in Fig. 7(c) were sparser than those in Figs. 7(a), (b) and (d). In Fig. 7(c), the smallest profile valley radius was only 18.40 μm, the surface roughness was 1.93 μm, and the maximum trough was 29 μm. Obviously, the surface topograph in Fig. 7(a) not only had low surface roughness value, but also had shallow profile trough.
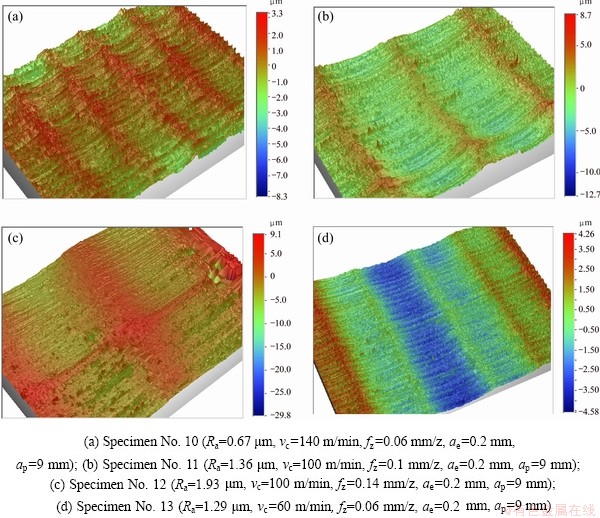
Fig. 7 Surface topographs of fatigue specimen for TB6
4.2 Effect of surface stress concentration factor on fatigue life
The effects of surface texture on the fatigue strength were reported by AROLA et al [16,17]. The surface equivalent stress concentration factor from the machined surface in terms of the standard roughness parameters is given by
 (3)
(3)
where  is the effective profile valley radius and represents the average radius determined from the dominant profile valleys, Ry is the peak to valley height, Rz is the ten-point roughness, n=1 for shear load and n=2 for uniform tension.
Equation (3) shows that if Ry/Rz=1, the machined surface is relatively smooth and has no effect on the stress concentration factor. With the increase of Rz, the machined surface roughing effect increases. When Ra is much bigger than , surface stress concentration is serious, which result in lower fatigue life. The surface stress concentration factor was calculated using Eq. (3). Because the machined surface bared uniform tension load under high-speed milling, the load factor n = 2 was used. The standard roughness parameters Ra, Ry and Rz are needed. Ra, Ry and Rz can be directly gotten from the surface topograph, and they are listed in Table 4. The must be obtained from an assessment of the surface profile. Specimen No. 14 acted as an example to illustrate the calculation process of . The surface texture and profile valley radius of specimens No. 14 are shown in Fig. 8. As shown in Fig. 8(a), the surface topograph was recorded using Veeco NT1100. One surface profile extracted from this surface topograph is shown in Fig. 8(b). Three dominant profile valleys A, B and C in surface profile were selected to calculate the average profile valley radius. The radius of profile valley A is shown in Fig. 8(c). The effective profile valley radii and the surface effective stress concentration factors for specimens No. 10-14 were calculated according to Eq. (3) and listed in Table 4.
Equation (3) was used to calculate the surface equivalent stress concentration factor in this work. From fatigue lives and surface equivalent stress concentration factors in Table 4, the fatigue life model based on surface equivalent stress concentration factor was established as follows:
 (4)
(4)
The relationship between the effective stress concentration and fatigue life is shown in Fig. 9. The fatigue life decreased with the increasing of surface effective stress concentration factor. As can be seen in Fig. 9, the highest fatigue life was obtained from specimen No. 10 with the lowest  , and the lowest fatigue life was obtained from specimen No. 14 with the highest of 1.51. The fatigue life decreased with the increasing of surface stress concentration factor. The successfully predicted the reduction in strength of components.
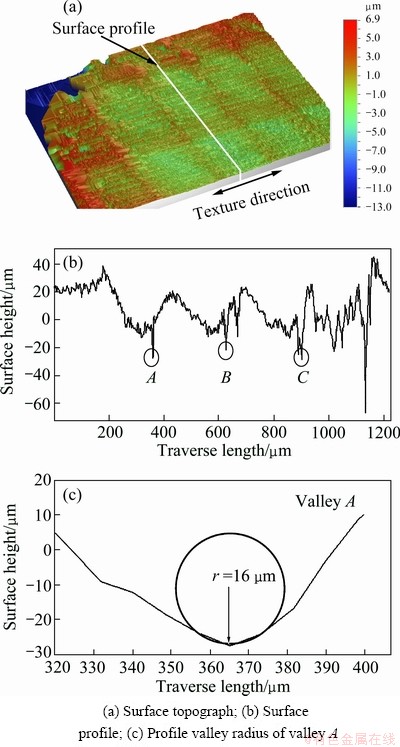
Fig. 8 Surface texture and profile valley radius of machined surface for specimen No. 14
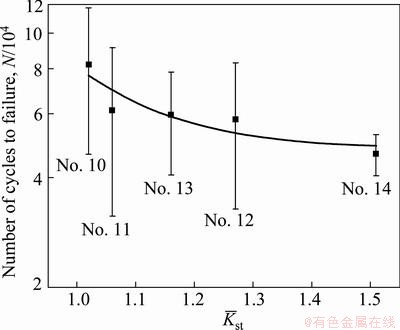
Fig. 9 Fatigue life vs surface stress concentration factor  for machined specimens
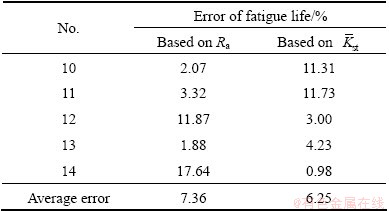
The errors of fatigue life between the model and experiment results are listed in Table 5. The average error of fatigue life between the model (2) and the experiment results was 7.36%. The maximum error was 17.64%. The average error of fatigue life between the model (4) and the experiment results was 6.25%; and the maximum error was only 11.73 %. Based on the results of this study, the offers a new design tool which can be used to account for the effects of surface texture on the fatigue life. Fatigue life model based on is more accurate than that based on Ra.
Table 5 Errors of fatigue life between model and experiment results
4.3 Fatigue fracture of specimen
The fatigue fracture and its edge morphology of specimens No. 10-12 are shown in Figs. 10-12, respectively. Fatigue fracture was comprised of crack source region, crack propagation region and instantaneous break region. All fatigue cracks originated from the stress concentration field of the machined surface intersection edge, then propagated to the interior, finally a corner crack formed. Fatigue source was not only the starting point of fatigue damage, but also the first place of the fatigue crack appearance. The fatigue preferentially originated from the stress concentration and the machined surface defects.

Fig. 10 Fatigue fracture (a) and edge topograph (b) for specimen No. 10 (Ra=0.67 μm)

Fig. 11 Fatigue fracture (a) and edge topograph (b) for specimen No. 11 (Ra=1.36 μm)
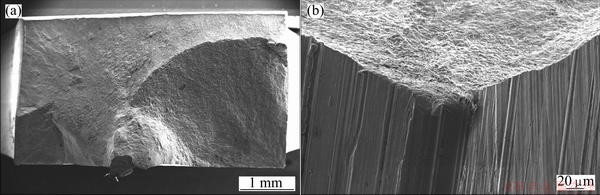
Fig. 12 Fatigue fracture (a) and edge topograph (b) for specimen No. 12 (Ra=1.93 μm)
Figures 10-12 show that with the increasing of surface roughness, the crack source number increased. What’s more, the higher the surface roughness value was, the deeper the machined surface profile valley was. The fatigue crack was more prone to originate from profile valley. As expected, the machined surface of specimen No. 10 exhibited the highest surface quality, evident from an average surface roughness of only 0.67 μm. Only one crack source appeared on the lower left corner of the fracture, and the instantaneous break region was smooth. Figure 10(b) shows that shallow cutter marks arranged orderly and tightly on the machined surface. The surface texture at the intersection edge of the machined surfaces E and F was relatively smooth. Figure 11(a) shows that one crack source appeared on the lower right corner of fracture. As can be seen from Fig. 11(b), the deep cutter marks arranged sparsely on the smooth machined surface. Surface texture at the intersection edge of the machined surfaces E and F was clear and deeper, which resulted in obvious stress concentration at the edges and corners. Two crack sources appeared on the fatigue fracture of specimen No. 12 in Fig. 12(a). The two crack sources located at the lower left corner, and the lower right corner of the fracture, respectively. The fatigue fracture had larger fluctuation. As can been seen from Fig. 12(b), obvious scars appeared on the machined surface with the biggest roughness of 1.93 μm. The surface texture of intersection edge for specimen No. 12 was deepest. All above led to the more significant stress concentration at edges and corners.
The SEM images of fracture of specimen No. 10 are shown in Fig. 13. The crack source region of specimen No. 10 is shown in Fig. 13(a). The crack source was a smooth and fine clean small sector region. In this region, there were lots of radiation steps and line traces transmitted to around from the crack source center. The crack propagation region is shown in Fig. 13(b). Fatigue striations and dimples were visible on the fracture surface. The continuous and parallel fatigue striations were perpendicular to the crack propagation direction. Figure 13(c) shows that the fracture surface exhibited typical ductile dimple fracture pattern. TB6 titanium alloy has good toughness.
5 Conclusions
1) Surface roughness was most sensitive to the variation of feed per tooth, secondarily sensitive to the milling width, and least sensitive to the milling speed. When the milling speed ranged from 100 m/min to 140 m/min and the feed per tooth ranged from 0.02 mm/z to 0.06 mm/z, the surface roughness values were less than 0.8 μm.
2) In the any combination proportion of high
milling speed, low feed per tooth, and low milling width, the obtained surface roughness values were less than 0.8 μm. The combination proportion of milling speed and feed per tooth affected surface topography. When the feed per tooth was 0.06 mm/z, the distance between the ridges increased with the increasing of the milling speed.
3) Fatigue life decreased sharply with the increase of surface equivalent stress concentration factor. In comparison with specimens No. 11-14, the fatigue life of specimen No. 10 was improved by about 33.6%, 41.5%, 37.6%, and 43.22% respectively. The average error of fatigue life between the model (4) and the experimental results was 6.25%. Fatigue life model based on is more accurate than that based on Ra.
4) Fatigue fracture of TB6 titanium alloy was comprised of crack source region, crack propagation region and instantaneous break region. All fatigue cracks originated from the intersection edge of the machined surface. The number of crack sources increased as the surface roughness increased.

Fig. 13 SEM images showing fatigue fracture of specimen No. 13 (Ra=0.67 μm)
References
[1] WANG Mei-jiao, MENG Xiang-jun, LIAO Zhi-qian, LI Shi-kai. Present state of research on Ti-1023 titanium alloy [J]. Development and Application of Materials, 2009, 24(5): 66-69. (in Chinese)
[2] GAO Yu-kui, LI Xiang-bin, YANG Qing-xiang, YAO Mei. Influence of surface integrity on fatigue strength of 42CrNi2Si2MoVA steel [J]. Materials Letters, 2007, 61(2): 466-469.
[3] ZHANG Dong-chu, PEI Xu-ming. Effects of machining processes on surface roughness and fatigue life [J]. Chinese Journal of Mechanical Engineering, 2003, 14(16): 1374-1377. (in Chinese)
[4] MANTLE A L, ASPINWALL D K. Surface integrity of a high speed milled gamma titanium aluminide [J]. Journal of Materials Processing Technology, 2001, 118(1-3): 143-150.
[5] JAWAHIR I S, BRINKSMEIER E, M’SAPUBI R, ASPINWALL D K, Outeiro J C, Meyer D, Umbrello D, Jayal A D. Surface integrity in material removal processes: Recent advances [J]. CIRP Annals―Manufacturing Technology, 2011, 60(2): 603-626.
[6] ZHANG Song, LI Jian-feng. Tool wear criterion, tool life, and surface roughness during high-speed end milling Ti-6Al-4V alloy [J]. Journal of Zhejiang University: Science A, 2010, 11(8): 587-595.
[7] CHE-HARON C H, JAWAID A. The effect of machining on surface integrity of titanium alloy Ti-6%Al-4%V [J]. Journal of Materials Processing Technology, 2005, 166(2): 188-192.
[8] CHE-HARON C H. Tool life and surface integrity in turning titanium alloy [J]. Journal of Materials Processing Technology, 2001, 118(1-3): 231-237.
[9] SHI Xing-kuan, YANG Qiao-feng, CAI Wei, ZHANG Ming-xian, CHEN Ming, ZHANG Shu-quan, SONG Liang-huang, TANG Xiao-lan. Study on high speed milling surface integrity of Ti Alloy TC4 [J]. Aeronautical Manufacturing Technology, 2001 (1): 30-32. (in Chinese)
[10] DU Sui-geng, LV Chao, REN Jun-xue, YANG Zhen-chao. Study on surface morphology and microstructure of titanium alloy TC4 under high-speed milling [J]. Acta Aeronautica et Astronautica Sinica, 2008, 29(6): 1710-1715. (in Chinese)
[11] YANG Zhen-chao, ZHANG Ding-hua, YAO Chang-feng, REN Jun-xue, TIAN Wei-jun. Sensitivity analysis of parameters affecting milling force in plunge milling of titanium alloy TC11 [J]. Acta Aeronautica et Astronautica Sinica, 2009, 30(9): 1776-1781. (in Chinese)
[12] ZHANG Gang, LIU Jun, LIU Yong-tao, YUE Zhu-feng. Effect of roughness on surface stress concentration factor and fatigue life [J]. Journal of Mechanical Strength, 2010, 32(1): 110-115. (in Chinese)
[13] YU Zhong-liang, ZHAO Yongq-ing, ZHOU Lian, SUN Jun. Fractography analysis of smooth and notched high cycle fatigue specimens in TC21 alloy at 315 °C [J]. Journal of Materials Engineering, 2007 (7): 55-58. (in Chinese)
[14] WANG Qing-rui, HUANG Li-jun, HUANG Xu, LIU Chang-kui, LIU De-lin. Effect of droplet on high cycle fatigue property of TB6 titanium alloy [J]. Chinese Journal of Rare Metals, 2009, 33(3): 295-298. (in Chinese)
[15] LI Cheng, HE Yu-huai, HUANG Li-jun, SU Bin. Study on fatigue property and crack growth behavior of TB6 titanium alloy [J]. Failure Analysis and Prevention, 2008, 3(3): 17-22. (in Chinese)
[16] AROLA D, RAMULU M. An examination of the effects from surface texture on the strength of fiber reinforced plastics [J]. Journal of Composite Materials, 1999, 33(2): 102-123.
[17] AROLA D, WILLIAMS C L. Estimating the fatigue stress concentration factor of machined Surfaces [J]. International Journal of Fatigue, 2002, 24(9): 923-930.
姚倡锋,武导侠,靳淇超,黄新春,任军学,张定华
西北工业大学 现代设计与集成制造技术教育部重点实验室,西安 710072
摘 要:钛合金高速铣削以高效率、高质量的优点而被广泛应用于航空航天工业。为了优化高速铣削中控制表面粗糙度的工艺参数,通过高速侧面铣削试验及疲劳试验,研究高速铣削参数对三维表面形貌和疲劳寿命的影响。通过疲劳试样断口观测,揭示表面形貌对疲劳裂纹产生的作用机制。研究表明:铣削速度优选范围为100~140 m/min,每齿进给量优选范围为0.02~0.06 mm/z,可保障表面粗糙度在0.8 μm内。基于表面应力集中系数建立的疲劳寿命模型与实验结果的平均误差为6.25%。疲劳裂纹起源于试件已加工表面的相交棱处。
关键词:TB6钛合金;高速铣削;表面粗糙度;表面形貌;疲劳寿命;疲劳断口
(Edited by Sai-qian YUAN)
Foundation item: Projects (50975237, 51005184) supported by the National Natural Science Foundation of China
Corresponding author: Chang-feng YAO; Tel: +86-29-88493232-319; Fax: +86-29-88491442; E-mail: chfyao@nwpu.edu.cn
DOI: 10.1016/S1003-6326(13)62512-1

