J. Cent. South Univ. (2012) 19: 496-503
DOI: 10.1007/s11771-012-1031-4
Segregation of voiced and unvoiced components from residual of speech signal
JO Cheol-woo, KIM Jae-hee
School of Mechatronics, Changwon National University, Changwon 641-773, Korea
? Central South University Press and Springer-Verlag Berlin Heidelberg 2012
Abstract: In conventional source-filter models, voiced and unvoiced components were considered independently. However, in practice it was difficult to separate the source into two parts. An actual source consists of a mixture of two sources and the ratio varies according to the content or the intention of speaker. It had been investigated to separate the voiced and unvoiced components for different source models. Source signals were modeled based on the residual signal measured from inverse filtering. Three different source models were assumed. The parameters of each model were optimized for the original speech signal using a genetic algorithm. The resulting parameters were compared in terms of the mel-cepstral distance to the original signal, the spectrogram and the spectral envelope from the synthesized signal. The optimization method achieves an improvement of 15% for the Klatt model, but there is little improvement in the modified residual case.
Key words: voice source; model; synthesis; optimization; genetic algorithm
1 Introduction
The voice source plays an important role in investigating the characteristics of speech quality. Several mathematical voice source models were suggested [1-3]. Information from the voice source can be used in various areas such as speech synthesis, speech recognition, pathological voice processing and speech coding. Previous studies were conducted to measure the source information from the speech signal. A parametric approach using iterative method showed good results [4-6]. An approach with joint source-filter model tried to compute the source under consideration of interactions between source and filter [7]. Biometric signal was also used as an auxiliary signal for the analysis [8]. LANKARAN and SAVOJI [9] used an iterative algorithm to estimate the glottal flow derivative of vowels. Different approaches were compared in that area [10-12].
In speech synthesis, the voice source is important because it has a significant effect on the quality of the synthesized speech in terms of naturalness and intelligibility. The source is also related to the emotional expressions in speech [13].
For the disordered voice, there are many parameters related to the voice source. Diseases of the vocal folds cause changes in these folds that lead to changes in the sound. If we can find a relationship between the speech signal and changes in the glottal parameters, it will be much easier to find disorders of the voice [14].
Voice quality can be measured in various ways. The most precise method is to take biological measurements of the vocal folds [8]. However, it is not easy nor convenient. So, indirect measurements via acoustic speech signals were preferred. Because of the limitations of the mathematical analysis methods, there is no easy way to extract the voice-source parameters. One approach is to estimate the source component via numerical analysis [12].
Multiple source estimation was carried out in previous studies of speech coding and speech synthesis. The researchers focused on the estimation of the source by a frame-based analysis, but not on finding the exact ratio for a specific source model [11-12, 15]. The purpose of this work is to estimate two components and obtain the numerical ratio of two sources via an analysis of the speech signal with specific source models.
2 Source-analysis methods
The basic approach to estimate the voice source is inverse filtering via linear predictive analysis. The linear prediction (LP) method is a well-known method that mathematically models a signal or a system. The basic assumption is that the source signal is in the form of random noise. Therefore, periodic signals such as speech can cause a residual signal that has a large amplitude in the excitation portion of voice-source signal. Although there are slight differences in terms of the pulse position between the physical signal and the excitation component of residual signal measured by LP analysis, this analysis is still the best method for estimating the glottal activities. The exact source signal can be acquired only from biological signals from the vocal cords. This is not usual to require additional equipment, and it causes inconveniences to the speaker. Therefore, LP-based methods are considered as the best realistic approach. First, the LP coefficients are calculated from the speech signal. The signal is then inversely filtered using these coefficients. The resulting inverse-filtered signal is called the residual signal. It can be regarded as an estimation of the glottal-excitation source. The integral of the residual signal is considered to be the estimated glottal-volume velocity.
According to source-filter theory, the voice source consists of an impulse train, which represents the voiced part, and random noise, which represents the unvoiced part. In a simple source model, the speech signal is divided into voiced, unvoiced and silent components on a temporal basis. Only one of the three components can occur at a given time. However, in a real situation, the voiced and unvoiced components cannot be clearly separated. In a mixed source model, two types of sources are considered at the same time. It is difficult to estimate both components. YEGNANARAYANA et al [6] used an iterative algorithm to separate the periodic and non-periodic components based on spectral decomposition. A genetic algorithm was applied to find an optimal level of noise in addition to the voiced source, which is estimated from the residual signal. A voice-source simulator was designed to analyze the speech signal.
3 Voiced source models
Three types of voice-source signal were considered: unipolar, bipolar and the Klatt source model [1].
The unipolar source model is a simplified impulse model from the residual signal. For each pitch period of the residual signal, only the highest peak is chosen as a candidate for the source signal. The remaining pulses are set to be zero.
The exponential impulse source model constructs a mode for the excitation pulse by considering a pulse with exponential decay.
The Klatt source model resembles the shape of the actual glottal-volume velocity, which corresponds to the integration of excitation. So, it can be compared to the integrated residual signal.
The voice-source simulator was constructed using Simulink component of Matlab software. Figure 1 shows the overall structure of simulator, with four components: analysis, modeling, synthesis and evaluation. The analysis module analyzes the speech signal. The signal is read from the file database, and basic analyses such as pitch analysis and LP analysis are performed. In the modeling component, the voice source is modeled based on computed residual signal. The original residual signal can be modified and a new signal shape is assigned based on analyzed information. Artificial sources can also be generated and applied to the original vocal-tract model. The synthesis module implements a vocal-tract filter to synthesize the signal based on analyzed speech parameters. The evaluation module compares the original speech and the experimentally modified signal is in terms of the spectrum, time and acoustic aspects.
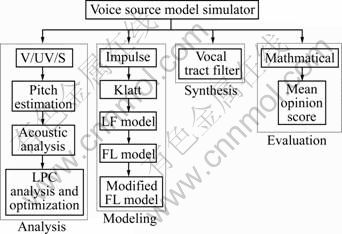
Fig. 1 Functions of simulator
A conventional linear predictive analysis method for the speech analysis was used. The residual signal is the reference source model that can be used to parameterize the voice source. The parameters of models are computed from the residual signal. In addition to the typical voice-source model, the original residual signal can be altered to experimentally change the voice quality.
The Klatt model (as shown in Fig. 3) is a model for the glottal-volume velocity, which is fitted to the integrated version of the residual signal [1]:
 (1)
(1)
 (2)
(2)
where g(t) means Klatt source; Oq means open quotient; t0 is the period; A is the peak amplitude of the volume velocity.
The residual signals are also used to generate an approximate source signal based on the pitch and amplitude of residual signal. Different source shapes occur in each excitation position.
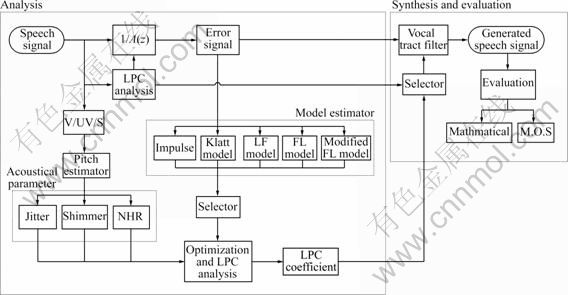
Fig. 2 Structure of voice source simulator
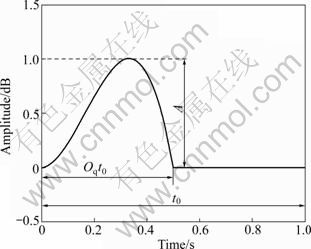
Fig. 3 Klatt source model
The types of modified residual signal are grouped as a unipolar impulse train and an exponentially decaying impulse train.
4 Basic analysis procedures
A genetic algorithm was used to find the optimal noise level of source component. Table 1 gives the parameters for algorithm. The maximum number of iterations was set to be 700.
Figures 4 and 5 show flow of the optimization process and the error minimization from GA. Based on the original residual signal, the noise-component ratio is optimized to reduce the error between original speech and re-synthesized speech. The genetic algorithm iterates until the error becomes smaller than a pre-specified value.
For the Klatt model, the cost function to be minimized is


where r(t) is residual signal; w(t) is the noise (unvoiced source component); rk(t) is the optimized Klatt residual without unvoiced component; ek1(t) is the cost function for the voiced part optimization; ek2(t) is the cost function considering the unvoiced part; x(1) is a variable for the cost function.
Table 1 Options for genetic algorithm
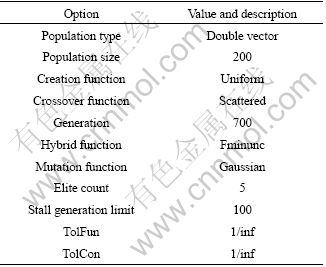
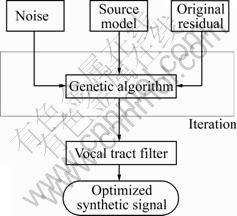
Fig. 4 Flow of optimization process
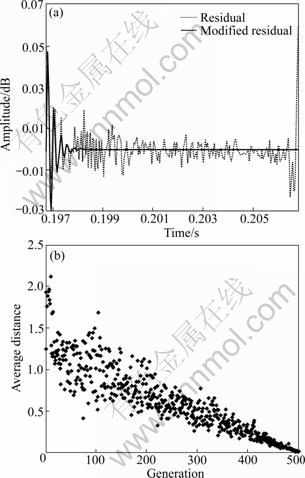
Fig. 5 Error minimization from GA: (a) Residual and modified residual; (b) Average distance between individuals
For the unipolar residual model, there is

where eu(t) is the cost function for the unipolar residual; rn(t) is unipolar residual; x(1) and x(2) are the variables for the cost function.
For the exponential residual model, there is

where ee(t) is cost function for the exponential residual; a is unipolar residual; x(1), x(2) and x(3) are variables for the cost function.
5 Results and discussion
Figures 6, 7 and 8 show examples comparing the original speech and the resynthesized speech in terms of time and frequency. The residual signal is transformed into an impulse train, and the spectrogram for the synthetic speech is similar to that for the original speech. There are some errors at the start and end of the utterance due to the lack of a V/UV discriminator in the simulator. The simulator was successfully tested for various vowel sounds.
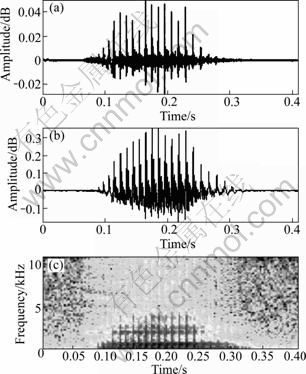
Fig. 6 Original synthetic speech from residual signal: (a) Residual; (b) Synthesized speech signal; (c) Spectrogram
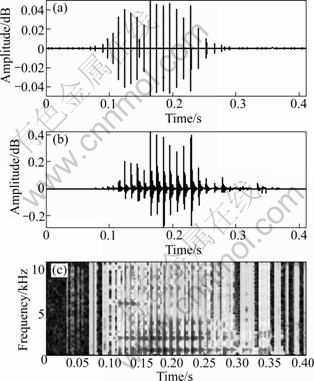
Fig. 7 Synthetic speech from altered residual: (a) Modified residual (Pitch detected); (b) Synthesized speech signal; (c) Spectrogram
Figure 9 shows the source models by using the residual signal, modified residual signal and Klatt models. Figure 10 shows the synthesized speech signal for each model. Figure 11 shows the spectrograms, which have similarities and differences in the frequency domain.
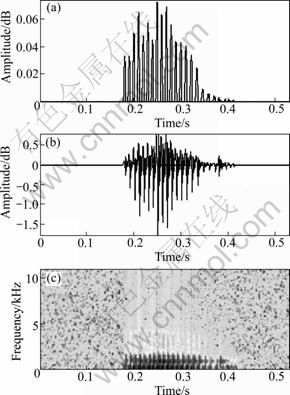
Fig. 8 Synthetic speech from Klatt model: (a) Klatt model; (b) Synthesized speech signal; (c) Spectrogram
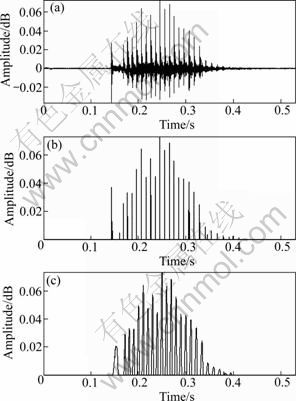
Fig. 9 Source models: (a) Original residual; (b) Modified residual signal; (c) Klatt model residual
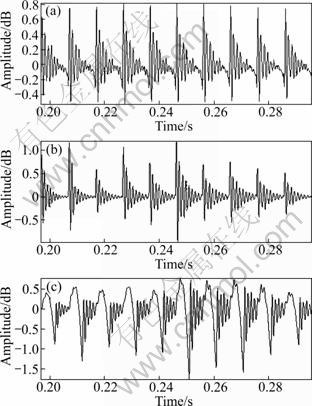
Fig. 10 Synthesized signals from each model: (a) Original signal; (b) Synthetic signal using modified residual; (c) Synthetic signal using Klatt model residual
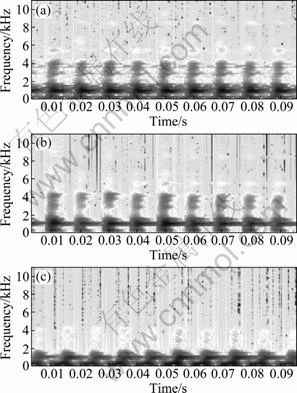
Fig. 11 Spectrograms from synthesized signal: (a) Spectrogram of Klatt residual; (b) Spectrogram of synthetic signal using modified residual; (c) Spectrogram of synthetic signal using Klatt model residual
Figure 12 shows the spectral envelopes for nonoptimized cases. The first is for the modified residual signal without noise components, and the second is for the Klatt source without noise.
Figure 13 shows the original residual signal and the optimized source signals with noise components. They are the optimized modified residual signal, the optimized modified residual with exponential decay, and the optimized Klatt source, respectively.
Figures 14 and 15 show synthetic speech signals with noise components where the noise is optimized to the original signal.
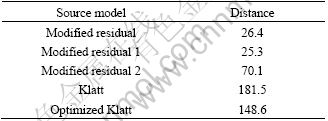
Figure 16 shows a comparison of the spectral envelopes for each case. The modified residual and Klatt models are similar in terms of the spectral components. The optimized modified residual signal has the shortest mel-cepstral spectral distance, as listed in Table 2. So, it is the closest signal to the original. For the Klatt source, the optimization process reduced the distance considerably, and it is useful to estimate the noise component of the source in this way.
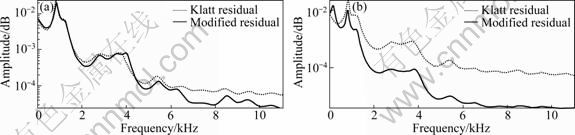
Fig. 12 Spectral envelope comparison of each model for non-optimized case: (a) Spectral envelope using LPC; (b) Spectral envelope using LPC
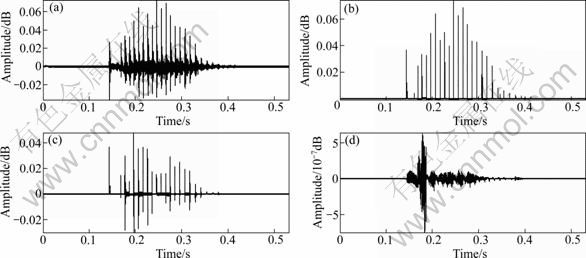
Fig. 13 Optimized mixed sources for each model: (a) Original residual; (b) Modified residual 1; (c) Modified residual 2; (d) Optimized Klatt model residual
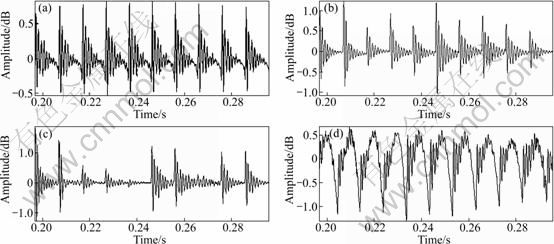
Fig. 14 Synthetic signals for optimized source models: (a) Original residual; (b) Optimized modified residual 1; (c) Optimized modified residual 2; (d) Optimized Klatt model residual
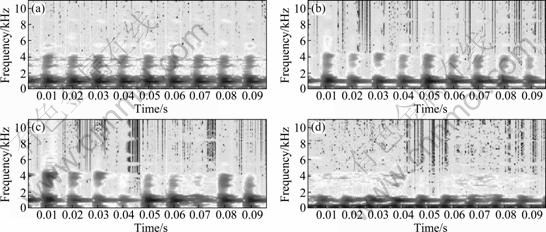
Fig. 15 Spectrograms from optimized synthetic signal: (a) Spectrogram of y_mono; (b) Spectrogram of synthetic signal using modified residual 1; (c) Spectrogram of synthetic signal using modified residual 2; (d) Spectrogram of synthetic signal using Klatt model residual
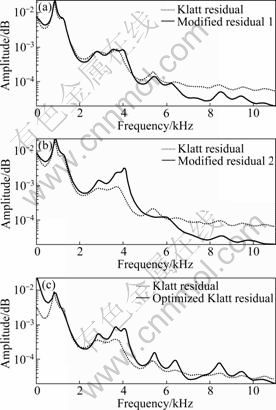
Fig. 16 Spectral envelope comparison of each model for optimized case using LPC: (a) Klatt residual and modified residual 1; (b) Klatt residual and modified residual 2; (c) Klatt residual and optimized Klatt residual
Table 2 Spectral distance between original speech and each model
6 Conclusions
1) The voice-source components are estimated by an optimization procedure to separate the voiced and unvoiced components of speech signal. The addition of noise components to the optimization procedure reduces the error between original signal and synthesized signal.
2) The modified residual with exponential decay model produces the best result when the noise components are added to the optimization process. The analysis procedure using the Klatt source model with additional noise via the optimization process is especially useful for speech analysis in various situations such as speech synthesis, voice-quality analysis, and pathological voice analysis.
3) In future research, it is required to reduce the spectral distance by adding noise components to the voice source in multiple frequency bands to achieve the better performance.
References
[1] KLATT D H. Software for a cascade/parallel formant synthesizer [J]. JASA, 1980, 67(3): 971-994.
[2] FANT G, LIJENCRANTS J, LIN Q. A four-parameter model of glottal flow [C]// Proceedings of the French-Swedish Symposium. Grenoble: STL-QPSR4, 1985: 1-13.
[3] FUJISAKI H, LJUNGQVIST M. Proposal an evaluation of models for the glottal source waveform [C]// Proceedings of ASSP, ICASSP’86. Tokyo, Japan: IEEE, 1986: 1605-1608.
[4] CHYTIL P, PAVEL M. Estimation of vocal fold characteristics using a parametric source model C]// Proceedings of 11th Australian International Conference on Speech Science and Technology. Auckland: Australian Speech Science and Technology Association Inc, 2006: 405-410.
[5] ALKU P. Glottal wave analysis with pitch synchronous interactive adaptive inverse filtering [J]. Speech Communication, 1992, 11: 109-118.
[6] YEGNANARAYANA B, D’ALESSANDRO C, DARSINOS V. An iterative algorithm for decomposition of speech signals into periodic and aperiodic components [J]. IEEE Transaction on Speech and Audio Processing, 1998, 6(1): 1-11.
[7] FU Q, MURPHY P. Robust glottal source estimation based on joint source-filter model optimization [J]. IEEE Transactions on Audio, Speech and Language Processing, 2006, 14(2): 492-501.
[8] BOUZID A, ELLOUZE N. Voice source parameter measurement based on multi-scale analysis of electroglottographic signal [J]. Speech Communication, 2009, 51(9): 782-792.
[9] LANKARANY M, SAVOJI M H. A new iterative algorithm for estimating the glottal flow derivative of vowels [C]//Proceedings of 10th International Conference on Information Science, Signal Processing and their Applications. Kuala Lumpur: IEEE, 2010: 13-16.
[10] DRUGMAN T, BOZKURT B, DUTOIT T. A comparative study of glottal source estimation techniques [J]. Computer Speech and Language, 2011, 26(1): 20-34.
[11] LEHTO L, AIRAS M, BJORKNER E, SUNDBURG J, ALK P. Comparison of two inverse filtering methods in parameterization of the glottal closing phase characteristics in different phonation types [J]. Journal of Voice, 2007, 21(2): 138-150.
[12] MOORE E, TORRES J. A performance assessment of objective measures for evaluating the quality of glottal waveform estimates [J]. Speech Communication, 2008, 50: 56-66.
[13] FORCIN A, ABBERTON E. Phonetics & measurement of voice quality [C]// VOQUAL’03. Geneva: ISCA Archive, 2003: 1-27.
[14] PEDRO G V, ROBERTO F B, VICTORIA R B, VICTOR N L, AGUSTIN A M, LUIS M M F, RAFAEL M O, JUAN I G L. Glottal source biometrical signature for voice pathology detection [J]. Speech Communication, 2009, 51(9): 759-781.
[15] SHUE Y L, ALWAN A. A new voice source model based on high-speed imaging and its application to voice source estimation [C]// Proceedings of ICASSP. Texas: IEEE, 2010: 5134-5137.
(Edited by DENG Lü-xiang)
Foundation item: Work supported by the Second Stage of Brain Korea 21 Projects
Received date: 2011-05-04; Accepted date: 2011-10-10
Corresponding author: JO Cheol-woo, Professor, PhD; Tel: +82-55-213-3662; E-mail: cwjo@changwon.ac.kr

