����Zr-1Sn-0.3Nb-0.3Fe-0.1Cr�Ͻ����˻�����е���֯�ݱ估�ٽᾧ��Ϊ
��Դ�ڿ����й���ɫ����ѧ��(Ӣ�İ�)2018���4��
�������ߣ������ ����Ⱥ ���� �ָ��� ��ѵ ����ǫ ������ ����ǿ
����ҳ�룺651 - 661
�ؼ��ʣ�ﯺϽ��ٽᾧ������֯��֯���ݱ䣻����ѧ
Key words��zirconium alloy; recrystallization; microstructure; texture evolution; kinetics
ժ Ҫ��ͨ��Ӳ�Ȳ��ԡ�SEM��TEM��EBSD�о����������˻��¶ȼ�ʱ�������Zr-1Sn-0.3Nb-0.3Fe-0.1Cr �Ͻ��ٽᾧ��Ϊ������ѧ��Ӱ�졣����������úϽ���ٽᾧ���������˻��¶ȵ��������������������Ӷ��ӿ졣�˻�������ٽᾧ������λ������ĸߴ��ܴ������κ˳����֯���� //RD �Ļ���֯��ת��Ϊ //RD�Ļ���֯�����ٽᾧ�����γɽ϶��30��ȡ��ͬʱ��ͨ��JMAK������ϳ��Ͻ��ٽᾧ����ѧ������30%��50%��70%�����������µ��ٽᾧͼ��������ٽᾧ�����ֱܷ�Ϊ240��249��180 kJ/mol��
Abstract: The effects of cold-rolling reduction, annealing temperature, and time on recrystallization behavior and kinetics of cold-rolled Zr-1Sn-0.3Nb-0.3Fe-0.1Cr alloy were investigated using the Vickers hardness test, scanning electronic microscopy (SEM), transmission electron microscopy (TEM) and electron backscatter diffractometry (EBSD). The results show that the rate of the recrystallization increased with increasing annealing temperature and rolling reduction. Recrystallized grains nucleated preferentially at sites with high density dislocation and deformation stored energy and then grew into integral grains. Recrystallization texture changed from //RD to //RD. The grain orientation changed from random orientation to the orientation with the maximum misorientation around 30��. Recrystallization kinetics and maps were constructed based on the Johnson�CMehl�C Avrami�CKolmogorov (JMAK) equation to derive parameters sensitive to the microstructure. The activation energies for recrystallization of 30%, 50% and 70% cold-rolling reductions were determined to be 240, 249 and 180 kJ/mol, respectively.
Trans. Nonferrous Met. Soc. China 28(2018) 651-661
Yi-lan JIANG1,2, Hui-qun LIU1,2, Dan-qing YI1,2, Gao-yong LIN1,2, Xun DAI3, Rui-qian ZHANG3, Yong-duo SUN3, Shao-qiang LIU3
1. School of Materials Science and Engineering, Central South University, Changsha 410083, China;
2. Key Laboratory of Nonferrous Materials, Ministry of Education, Central South University, Changsha 410083, China;
3. Science and Technology on Reactor Fuel and Materials Laboratory, Nuclear Power Institute of China, Chengdu 610213, China
Received 17 November 2016; accepted 24 March 2017
Abstract: The effects of cold-rolling reduction, annealing temperature, and time on recrystallization behavior and kinetics of cold-rolled Zr-1Sn-0.3Nb-0.3Fe-0.1Cr alloy were investigated using the Vickers hardness test, scanning electronic microscopy (SEM), transmission electron microscopy (TEM) and electron backscatter diffractometry (EBSD). The results show that the rate of the recrystallization increased with increasing annealing temperature and rolling reduction. Recrystallized grains nucleated preferentially at sites with high density dislocation and deformation stored energy and then grew into integral grains. Recrystallization texture changed from  //RD to
  //RD. The grain orientation changed from random orientation to the orientation with the maximum misorientation around 30��. Recrystallization kinetics and maps were constructed based on the Johnson�CMehl�C Avrami�CKolmogorov (JMAK) equation to derive parameters sensitive to the microstructure. The activation energies for recrystallization of 30%, 50% and 70% cold-rolling reductions were determined to be 240, 249 and 180 kJ/mol, respectively.
Key words: zirconium alloy; recrystallization; microstructure; texture evolution; kinetics
1 Introduction
Zirconium alloys have been used in nuclear reactors as fuel cladding for several decades owing to their low absorption cross-section for thermal neutrons, acceptable mechanical properties, and excellent corrosion resistance. However, in order to reduce the cost of nuclear power, it is necessary to extend the refueling cycle. To meet the requirements of increased burn-up and extended fuel cycle, new zirconium alloys have been developed and tested under out-of-pile and in-pile conditions. These alloys are synthesized by adding alloying elements such as Fe, Cr, Ni and Cu in Zr-Sn-Nb alloys, resulting in ZIRLO (Zr-1.0Sn-1.0Nb-0.1Fe) [1], M5(Zr-1.0Nb) [2], E635 (Zr-1.3Sn-1.0Nb-0.35Fe) [3] or Zr-1Sn-0.3Nb-0.3Fe-0.1Cr alloy [4]. In particular, the Zr-1Sn-0.3Nb-0.3Fe-0.1Cr alloy is a kind of Zr-Sn-Nb alloy with low Nb content. Compared to the zirconium alloys with high Nb content, the Zr-1Sn-0.3Nb-0.3Fe-0.1Cr alloy can undergo relatively high thermal mechanical processes. However, when preparing the alloy it is beneficial to obtaining a fine and uniform distribution of recrystallized microstructure and second phase particles that have a great influence on the corrosion resistance [4-6]. Therefore, the alloy processing must be further looked into to guarantee a uniform microstructure.
Service conditions of nuclear reactors require that the zirconium alloy has a uniform microstructure after processing, which involves smelting, hot working, intermediate annealing, cold working, and recrystallization annealing. The final annealing step is necessary for releasing the residual stresses and/or improving the mechanical properties and corrosion resistance [4,7-9]. This is an important step, since it has been clearly established that the recrystallized Zr-1Sn-0.3Nb-0.3Fe-0.1Cr alloy is more suitable for nuclear applications than the as-deformed ones due to the higher irradiation creep resistance and lower irradiation growth [4,10]. In addition, the recrystallized microstructure can restore the ductility of Zr-Sn-0.3Nb-0.3Fe-0.1Cr alloy, which facilitates the following manufacturing operations of cladding materials. Therefore, it is important and necessary to investigate the influence of annealing on recrystallization mechanisms and microstructural characteristics of Zr-1Sn-0.3Nb-0.3Fe-0.1Cr alloys.
During the past few decades, several works have been devoted to study the recrystallization mechanisms of zircaloy [8,10-14] and the newly developed Zr-Sn-Nb alloys [4,15] after cold rolling or dynamic recrystallization. LUAN et al [11] studied the growth behavior of second phase particles in Zr-Nb-Sn-Fe- Cr-Cu alloys during aging. They found that linear distribution features of the second phase particles weaken with longer aging time or higher temperatures. Despite the importance of second phase particles, the recrystallization after cold working is responsible for the formation of final microstructure of Zr-1Sn-0.3Nb-0.3Fe-0.1Cr alloy. JUNG et al [10] investigated the recrystallization behavior of HANA-4 and compared with the HANA-6 and constructed the recrystallization maps. LIU et al [13] investigated the microstructural evolution of Zr-Nb-Sn-Fe-Cr alloy at 590 ��C for 1 and 2 h, which is insufficient to characterize the details of the recrystallization process. However, as an important cladding material, the recrystallization behavior of Zr-1Sn-0.3Nb-0.3Fe-0.1Cr alloy is still not fully understood.
In this work, the aim is to investigate the recrystallization behavior, microstructure, texture evolution, recrystallization mechanism and kinetics of the Zr-1Sn-0.3Nb-0.3Fe-0.1Cr alloy. In order to do so, the alloy was subjected to different deformation degrees before annealing, which also provides a reference to the hot and cold processing of this new developed Zr-alloy.
2 Experimental
The materials used were received from the Nuclear Power Institute of China, which were hot rolled plates with 5 mm in thickness. Three different reductions of 30%, 50% and 70% were applied in the cold rolling to achieve the thickness values of 3.5, 2.5 and 1.5 mm, respectively. The material was able to accommodate large strain without any evidence of cracking or delamination. The annealing processes subsequent to every cold-rolling were conducted at temperatures of 530, 560 and 580 ��C for various time.
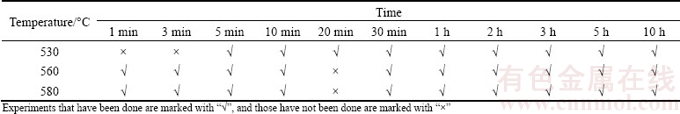
The samples were annealed under vacuum atmosphere for the isochronal and isothermal annealing and the annealing parameters are shown in Table 1. The oxidation during annealing was prevented by using quartz tubing for the vacuum. The samples for annealing were cut into 10 mm �� 8 mm pieces along the rolling direction.
The hardness of the specimens was measured by a Vickers hardness tester (HV-10B, China) with a load of 3 kg for 15 s. Prior to the hardness tests, the examined surfaces were metallographically prepared using SiC papers (4000 grit in the final step), and then etched with a 10%HF-45%HNO3-45%H2O (volume fraction) solution. The hardness was measured on the rolling direction (RD)�Ctransverse direction (TD) plane to evaluate the extent of recrystallization. For the determination of the hardness, 15 measurements were carried out to obtain an average value for each sample. A scanning electron microscope (SEM, FEI-Sirion 200) was employed to characterize the microstructure in RD�CND plane of the specimens. Prior to SEM observations, electro-polishing was conducted at -20 ��C under 17 V in a 95%C2H5OH-5%HClO4 (volume fraction) solution.
The microstructure and texture were characterized at various stages of annealing and several locations through the thickness of the sample. A combination of two techniques was used in order to have a complete picture of the microstructures present. EBSD was used to measure the grain size, the distribution of grain boundary misorientations and the texture on the surface. A large EBSD data set was acquired on this recrystallized material using an HKL-Technology system (Channel 5 software) (Oxford Instruments HKL, Hobro, Denmark) coupled to a JELL-6300 SEM (scanning electron microscopy). Sample preparation for EBSD measurement included grinding with increasingly finer SiC papers of 240, 600, 800, 1000, 2000, 3000, and 5000 grit size, followed by polishing with 3.5 ��m diamond paste. Special care was taken to avoid the formation of twins during grinding and polishing. The samples were further etched with a solution of nitric acid (45%), distilled water (45%) and hydrofluoric acid (10%) for EBSD examination. The etched surface was rinsed with running water for 20 min in order to eliminate all the residues from the etching solution. TEM was performed on a TecnaiG220ST (USA) with a 200 kV 2010 JEOL microscope to examine the microstructure along the plane parallel to the RD, located at the mid-thickness of the sample. Sample preparation for TEM involved a final thinning step to electron transparency using a Struers Tenupol double-jet electropolisher using 35 V and an electrolyte mix of 90%C2H5OH-10%HClO4 at -25 ��C.
Table 1 Annealing parameters of cold-rolled Zr-1Sn-0.3Nb-0.3Fe-0.1Cr alloy sheets
3 Results and discussion
3.1 Recrystallization softening
The process of recrystallization was studied by measuring the micro hardness as a function of annealing time, annealing temperature, and rolling reduction. Figure 1 shows the Vickers hardness of the cold-rolled samples annealed at different temperatures for various time. The initial hardness was taken from the cold-rolled specimens and the final hardness was taken from the specimens annealed for 12 h to represent the stage of full recrystallization. The curves consist of three stages, i.e., early stage of annealing which did not have a notable decrease of hardness, middle stage with a substantial decrease of the hardness induced by the proceeding of recrystallization, and the last steady stage indicating the completion of recrystallization. The incubation stage suggests that the degree of recovery of the cold-rolled Zr-1Sn-0.3Nb-0.3Fe-0.1Cr alloy was limited by the hexagonal close-packed structure and low stacking fault energy, which is in line with the experimental observation in Zr-4 alloy [9] and other alloys [7,16]. From Fig. 1, it can be concluded that increasing annealing temperature accelerated the decrease of the hardness. This proves that increasing annealing temperature is an effective method to accelerate the recrystallization process.
For any particular annealing temperature, the increasing rolling reduction was attributed to the increase of stored strain energy [17], which shortened the incubation period and accelerated the process of recrystallization of the Zr-1Sn-0.3Nb-0.3Fe-0.1Cr alloy. For instance, the time needed for the recrystallization to begin was shortened from 50 to 5 min when the reduction was raised from 30% to 70% for the specimen annealed at 530 ��C. The reduction still has an effect on recrystallization at higher temperatures, but the effect becomes weaker. As shown in Fig. 1(c), the recrystallization remained nearly unchanged at 580 ��C, though the reduction was increased from 50% to 70%.
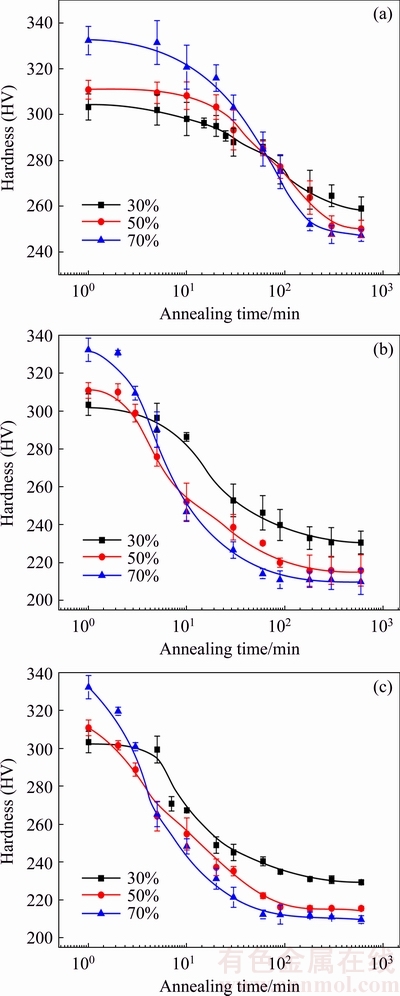
Fig. 1 Relationship between Vickers hardness and annealing time of cold rolled Zr-1Sn-0.3Nb-0.3Fe-0.1Cr alloy at 530 ��C (a), 560 ��C (b), and 580 ��C (c) under rolling reductions of 30%, 50% and 70%
3.2 Microstructure evolution
The variation of the Vickers hardness is caused by the microstructure evolution during annealing. A typical microstructure evolution of the 30% cold-rolled sample during annealing at 580 ��C is shown in Fig. 2. In cold-rolled samples, the grains were elongated along the rolling direction (RD). After annealing at 580 ��C for 10 min, the cold-rolled sample started to recrystallize (Fig. 2(b)), and as the annealing progressed, the volume fraction of recrystallized grains increased. Equiaxed grains could be detected in the specimens after annealing at 580 ��C for 180 min (Fig. 2(f)). These corresponded well with the results that the hardness of the specimens decreased to low values after 10 min.
Figure 3 shows the microstructures of the specimens subjected to different rolling reductions and then annealed at 580 ��C for 30 min. This suggested that large rolling reduction accelerated the recrystallization process of the Zr-1Sn-0.3Nb-0.3Fe-0.1Cr alloy. Figure 4 shows the effect of annealing temperature on the recrystallization of the Zr-1Sn-0.3Nb-0.3Fe-0.1Cr alloy. In the case of 30% rolling reduction, the cold-rolled microstructure can still be found after annealing for 30 min. The recrystallization microstructure dominated after the reduction was raised to 70%, when the specimen was annealed at 580 ��C for 30 min.
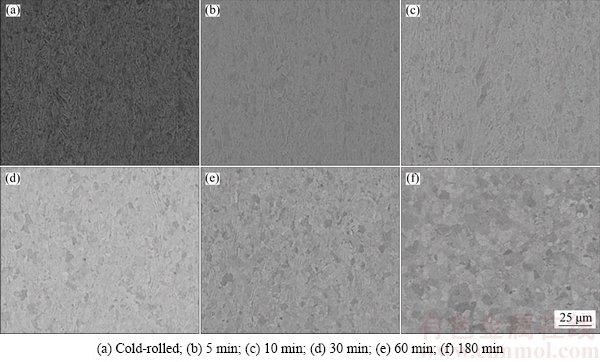
Fig. 2 Microstructural evolution of Zr-1Sn-0.3Nb-0.3Fe-0.1Cr alloy subjected to rolling reduction of 30% and then annealed at 580 ��C for various time
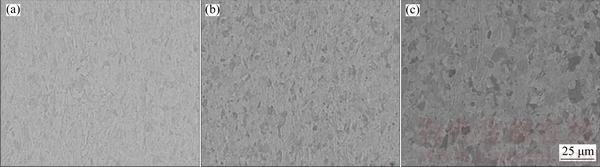
Fig. 3 Microstructures of Zr-1Sn-0.3Nb-0.3Fe-0.1Cr alloy subjected to different rolling reductions of 30% (a), 50% (b) and 70% (c) and then annealed at 580 ��C for 30 min

Fig. 4 Microstructures of Zr-1Sn-0.3Nb-0.3Fe-0.1Cr alloy subjected to rolling reduction of 50% and then annealed at different temperatures of 530 ��C (a), 560 ��C (b) and 580 ��C (c) for 30 min
3.3 Texture evolution and recrystallization mechanism
Figure 5 shows the EBSD orientation map and inverse pole figure (IPF) maps illustrating the orientation structure, grain boundary and IPF of the as-received hot-rolled Zr-1Sn-0.3Nb-0.3Fe-0.1Cr alloy. The grain size was heterogeneous and abnormal size grain could be found with low-angle boundary. Dynamic recrystallization led to the indented grain boundaries and the presence of sub-grains with tangled dislocation.
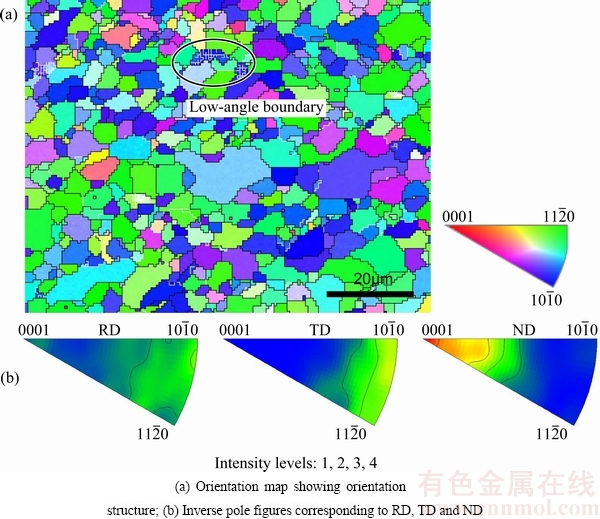
Fig. 5 EBSD orientation map and inverse pole figure (IPF) maps of as-received alloy
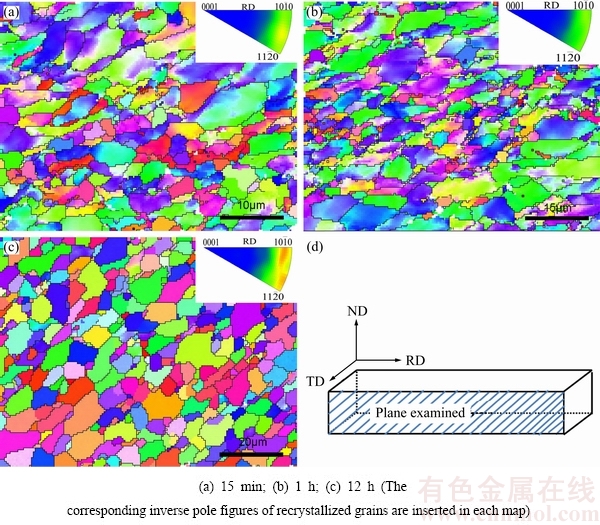
Fig. 6 Orientation maps of 30% reduction samples annealed at 530 ��C for various time
Figure 6 shows a series of IPF maps of the ND-RD plane in 30% cold rolled sample after annealing at 530 ��C for 15 min, 1 h and 12 h. The grains of cold- rolled samples were elongated along the RD, and recrystallization occurred firstly in the elongated microstructure area. A considerable amount of low-angle boundary appeared in the samples annealed for 15 min and 1 h. As shown in Fig. 6(c), with increasing annealing time and, in particular, after annealed for 12 h, a large fraction of equiaxed grains with various orientations and 2-5 ��m in size formed. It can be considered as the finishing stage of recrystallization.
The experimental results showed that nucleation occurred mainly in the early stage of recrystallization and scattered around lamellar structure. The main orientations of the nucleus were  and
and  . The rate at which nucleus grew varied from one orientation to another. As shown in Fig. 6(b), the grain size of recrystallized grains with
  (green) was larger than that of the blue one (
 ). These results indicated that the grains in direction were more likely to grow up, which could bring about the change of recrystallization texture. As a result, the texture of the rolling sheets was mainly characterized as direction parallel to rolling direction (), while the texture of the annealing sheets was direction parallel to rolling direction (). TENCKHOFF and RITTENHOUSE [18] and OKAZAKI and CONRAD [19] had come up with similar recrystallization behavior in Zr and Ti alloys. The results showed that the texture of cold rolled sheets was and then changed to after annealing. The grain growth played an important role in the process of recrystallization texture evolution. Furthermore, texture evolution during grain growth was analyzed as defined for Ti and other hexagonal crystals by BOZZOLO et al [20-23]. They found that the grains in direction were more likely to grow up and they used ��orientation pinning�� to explain it. This change of texture during recrystallization also appeared in recrystallized Ti-23Nb-0.7Ta-2Zr-O alloy that showed different orientations compared with the deformed structure [24]. The recrystallization of Ti-23Nb-0.7Ta- 2Zr-O alloy was achieved by the nucleation of new grains, and then these new grains grew at the expense of the deformed structure. The primary recrystallization nuclei possessed a different orientation from the deformed structure. But with increasing the annealing time, nuclei in different orientations began growing indistinguishably and diffused orientation of Ti-23Nb-0.7Ta-2Zr-O alloy was obtained which made distinct difference in contrast with that of Zr-1Sn-0.3Nb-0.3Fe-0.1Cr alloy.
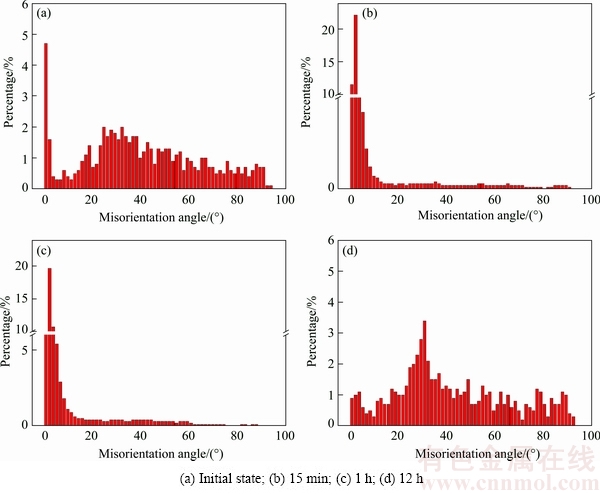
Fig. 7 Misorientation angle distribution histograms of 30% reduction samples annealed for various time
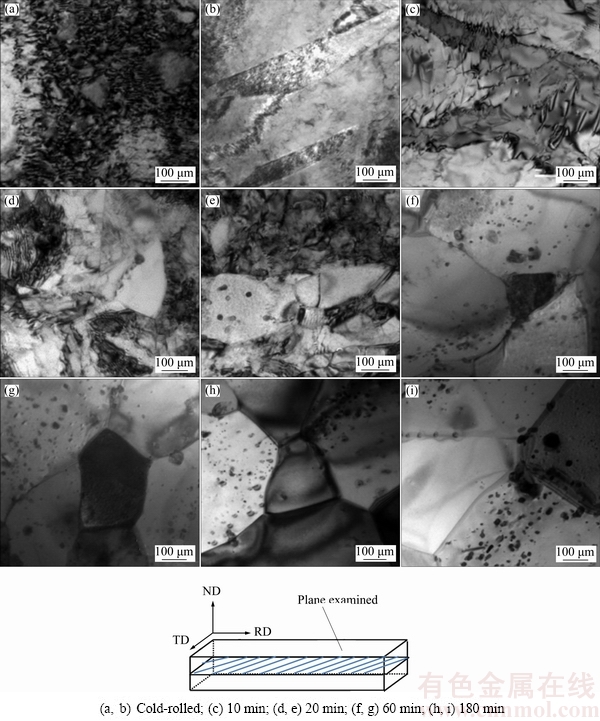
Fig. 8 TEM micrographs of Zr-1Sn-0.3Nb-0.3Fe-0.1Cr alloy samples annealed at 580 ��C for various time
The characteristic distribution of the boundaries between the selectively grown grains and the matrix was found to be strongly influenced by the cold-rolling and the following recrystallization, as it became obvious from a comparison of grain boundary characteristics in cold-rolled and annealed specimens. Figure 7 shows the evolution of misorientation angle distribution histograms during the grain growth process. Misorientation angles lower than 2�� were cut off in order to avoid artifacts in local misorientation data, which may be due to the experimental fluctuations between adjacent pixels within single grains. Apart from obtaining the huge difference on morphologies, the orientation information obtained by EBSD indicated that the density of low misorientation (<15��) was higher in original sample than that annealed for 12 h, which was random for the misorientation angle. Low misorientation was observed inside subgrains at the beginning of the process and it is corresponding to high dislocation density in Fig. 8(a). These subgrains would subsequently coalescence or be consumed by the growing neighboring grains (Fig. 8(d)). With increasing annealing time, the fraction of low misorientation decreased, and thus, the recrystallized grain predominated (Fig. 8(f)). Meanwhile, the misorientation distribution with the maximum at around 30�� (the inset in Fig. 7(d)) can be obtained. The contribution became more visible when grain growth was progressed. It could be explained by the 30��/<0001> arose from the interaction of nucleus in direction parallel to rolling direction () formed in recrystallization and basal texture. BOZZOLO et al [25] have come up with very similar result that the maximum misorientation distribution values are 60��-70�� due to the orthorhombic sample symmetry. It is worth noticing that the contribution cannot disappear even if the corresponding boundaries have high energy and mobility. During grain growth, some of these boundaries disappear but others will be formed because they are required to maintain the orthorhombic sample symmetry.
Figure 8 shows the TEM micrographs of the samples with sub-grain structures after annealing for various time along the RD-TD plane. Figure 8(a) displays a typical cold-rolled microstructure, where the high density of dislocations and the formation of dislocation tangles were caused by heavy deformation. The resultant grains tended to be elongated along the rolling direction deformation (Fig. 8(b)) and initial hardness reached a maximum as shown in Fig. 1. After annealing for 10 min, the dislocation tangles started to un-tie and dislocation clearing was first observed where the strain free and recrystallized grains appeared (Figs. 8(c) and (d)). Figure 8(e) displays the recrystallized grain with a size <1 ��m, which was observed in the untied dislocation tangles, indicating the end of the incubation period and the beginning of recrystallization. From this point, the deformed structure vanished and the recrystallization progressed (Figs. 8(g) and (h)), which was consistent with the EBSD results. In this process, the coalescence growth of sub-grains took place at the substructure near the dislocation tangles (Fig. 8(f)) corresponding to the sharp decrease of hardness in Fig. 1. As shown in Fig. 8(i), the full-recrystallized grain boundary became flat and precipitates appeared when the hardness of samples met lowest value (Fig. 1). Fine precipitates with a size <100 nm were distributed uniformly along the recrystallized grain boundary and within the grains. This recrystallization process further explained the effect of microstructure evolution on the decrease of Vickers hardness and served as base for the change of texture at the early stage of recrystallization [26].
As discussed above, the softening of cold-rolled alloy in Fig. 1 resulted from the combination operation of the change in microstructure and texture. The strain free and recrystallized grains were principal reasons for continuous decrease of hardness. After further grain growth, different textures developed, which led to the further decrease of hardness. The difference between the texture of the large and small grains is pronounced after annealing for 15 min. The final texture of the 30% cold-rolled sheets changed into a dominant texture with direction parallel to rolling direction.
3.4 Recrystallization kinetics
The volume fraction of recrystallized grains (f) can be explained by the variation of the hardness (HV) with the annealing time (t) as
 (1)
(1)
where  is the hardness of the cold-rolled sheets, and
  is the hardness of a fully-recrystallized sample. The values of and are listed in Table 2. The relationship between the volume fraction of recrystallized grains ( f ) and the annealing time (t) can be described by the Johnson-Mehl-Avrami-Kolmogorov (JMAK) equation [27]:
f=1-exp(-ktn) (2)
where k is a temperature dependent constant and n is an Avrami exponent depending on both grain geometry and annealing temperature. The hardness is inversely correlated with the volume fraction of the recrystallized grains as
 (3)
(3)
The data of f can be presented in the form of ln[-ln(1-f )] vs ln t. The values of k and n were determined by fitting the experimental data, as shown in Table 2.
Table 2 Values of k and n in JMAK equation of Zr-1Sn-0.3Nb-0.3Fe-0.1Cr alloy specimens
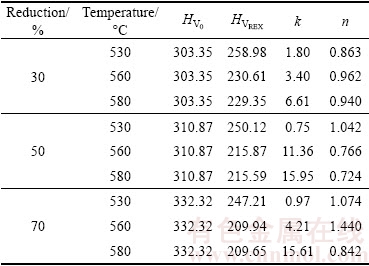
According to a classical treatment [28], the n value should be an integer, e.g., n=3 for a site-saturated process and n=4 for a constant rate of a nucleation process. However, the n values obtained from this study are less than 1, which are much lower than the theoretical values. Similar phenomenon could be found in HANA-4, HANA-6 [29,30], which explained the lower Avrami exponents by a definition of irregular distribution of stored energy. This implied that random nucleation did not occur during recrystallization. The non-uniform distribution of stored energy could be expressed by the inhomogeneity of the microstructure, which led to non-random distribution of the nucleation sites and a reduced grain growth rate [29]. As shown in Fig. 8(d), the recrystallization occurred first around the dislocation tangles��while during the incubation period nucleation occurred in the un-tied dislocation tangles and it is the place derived the fine grains.
Since recrystallization is a thermal activation process, the time to 50% recrystallization (t0.5) has the form of
 (4)
(4)
where ��0 is the temperature dependent constant, Q is the apparent activation energy, R is the mole gas constant and T is the annealing temperature [11]. By taking logarithms of both sides in Eq. (4), the ln t0.5 and 1/T can be related by a straight line, as shown in Fig. 9. The apparent activation energies for the recrystallization of the 30%, 50% and 70% cold-rolled sheets are 240, 249 and 180 kJ/mol, respectively. The 70% reduction sheet had the lowest apparent activation energy. But the rule did not apply to the other sheets. The 50% reduction sheet had higher apparent activation energy compared the sheet with 30% reduction. Although 50% reduction sheet had higher activation energy, it recrystallized faster than 30% reduction sheet. This trend is demonstrated in the study of Zr-1Nb alloy [12] and Zr 702 alloy [7] as well.
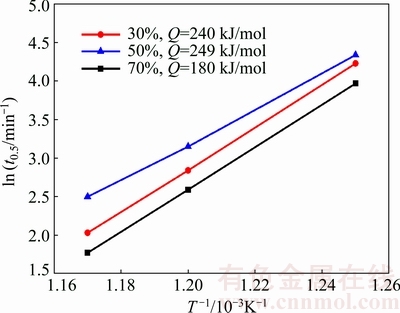
Fig. 9 ln t0.5 versus inverse temperature plots used for derivation of apparent activation energies for recrystallization of Zr-1Sn-0.3Nb-0.3Fe-0.1Cr alloy
Since the activation energies are correlated with the investigated temperature ranges, the kinetics for recrystallization can be represented using a recrystallization map. Based on the kinetics parameters presented in Table 2, recrystallization maps can be plotted to predict the recrystallization process in the temperature range investigated. Figure 10 shows the variation of the volume fraction of the recrystallized grains in Zr-1Sn-0.3Nb-0.3Fe-0.1Cr alloy sheets with different rolling reductions as a function of annealing temperature and time. As annealing temperature increased, the recrystallization process of the sheets was gradually quickened, while the recrystallized volume fraction maintained a steady curvature. The recrystallization of Zr-1Sn-0.3Nb-0.3Fe-0.1Cr alloy with 70% reduction was faster than that of the alloy with 30% reduction. The recrystallization maps obtained for Zr-1Sn-0.3Nb-0.3Fe-0.1Cr alloy would be useful for the selection of processing parameters such as rolling reduction, annealing temperature, and annealing time of this alloy and other Zr-Sn-Nb alloys.
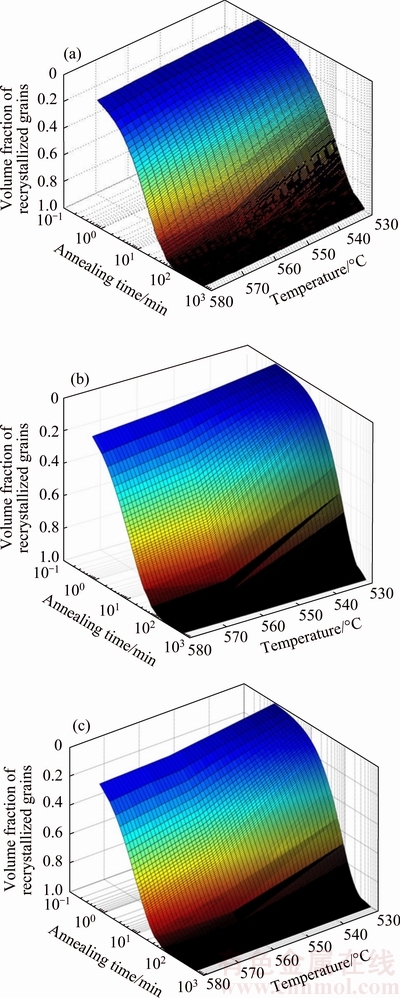
Fig. 10 Recrystallization maps of Zr-1Sn-0.3Nb-0.3Fe-0.1Cr alloy sheets with different cold-rolling reductions of 30% (a), 50% (b) and 70% (c)
4 Conclusions
1) The recrystallization behavior and its mechanism in Zr-1Sn-0.3Nb-0.3Fe-0.1Cr alloy annealed at 530, 560 and 580 ��C for different time were investigated.
2) Increasing the deformation degree and annealing temperature could accelerate the recrystallization process, which was evidenced by the hardness tests in combination with microstructural observations. The time required to complete recrystallization of the specimens with different rolling reductions and annealing temperatures was obtained.
3) Recrystallization is important for both microstructure and texture evolution. Homogeneous microstructure, with an average grain size of 2-5 ��m, and a large fraction of high-angle boundaries, was obtained after annealing for 12 h. This is attributed to large strain imposed and to the occurrence of plastic deformation. During the recrystallization process, grains with grow preferentially, leading to strengthening the texture, which dominates the final texture. The texture of the alloy changes from to during the recrystallization process.
4) The apparent activation energies of recrystallization are 240, 249 and 180 kJ/mol for specimens with 30%, 50% and 70% reductions, respectively. The values of n derived from the JMAK equation are all below 1.5. The recrystallization maps for alloys with different reductions were constructed to predict the recrystallization process of Zr-Sn-Nb alloy.
Acknowledgments
The authors would like to express their gratitude to Science and Technology on Reactor Fuel and Materials Laboratory, Nuclear Power Institute of China, for providing zirconium alloy plates. Characterization of microstructure was performed at the Zhuzhou Cemented Carbide Group Co., Ltd., which is supported by JELL-6300 SEM (scanning electron microscopy) equipped with an Oxford EBSD system.
References
[1] BOSSIS P,  D, HANIFI K, THOMAZET J, BLAT M. Comparison of the high burn-up corrosion on M5 and low tin zircaloy-4 [C]//Zirconium in the Nuclear Industry: Fourteenth International Symposium, ASTM STP 1467. West Conshohocken, PA: ASTM International, 2002: 3-24.
[2] MARDON J P, CHARQUET D, SENEVAT J. Influence of composition and fabrication process on out-of-pile and in-pile properties of M5 alloy [C]//Zirconium in the Nuclear Industry: Twelfth International Symposium, ASTM STP 1354. West Conshohocken, PA: ASTM International, 2000: 505-524.
[3] NIKULINA A V, MARKELOV V A, PEREGUD M M, VOEVODIN V N, PANCHENKO V L, KOBYLYANSKY G P. Irradiation-induced microstructural changes in Zr-1%Sn-1%Nb-0.4%Fe [J]. Journal of Nuclear Materials, 1996, 238(2): 205-210.
[4] ZHOU B X, YAO M Y, LI Z K, WANG X M, ZHOU J, LONG C S, LUAN B F. Optimization of N18 zirconium alloy for fuel cladding of water reactors [J]. Journal of Materials Science & Technology, 2012, 28(7): 606-613.
[5] SHEBALDOV P V, PEREGUD M M, NIKULINA A V. E110 alloy cladding tube properties and their interrelation with alloy structure-phase condition and impurity content [C]//Zirconium in the Nuclear Industry: Twelfth Symposium, ASTM STP 1354. West Conshohocken, PA: ASTM International, 2000: 545- 559.
[6] TENCKHOF E. Review of deformation mechanisms, texture, and mechanical anisotropy in zirconium and zirconium base alloys [C]//Zirconium in the Nuclear Industry: Fourteenth International Symposium, ASTM STP 1467. West Conshohocken, PA: ASTM International, 2002: 25-52.
[7] LI M H, MA M, LIU W C, YANG F Q. Recrystallization behavior of cold-rolled Zr 702 [J]. Journal of Nuclear Materials, 2013, 433(1): 6-9.
[8] YANG Z, LIU F, YAN Z, ZHANG F. Effect of annealing on microstructure and hardness of hot and cold rolled Zr705 [J]. Rare Metal Materials and Engineering, 2013, 42(2): 254-258.
[9] KIM H G, PARK S Y, LEE M H, JEONG Y H, KIM S D. Corrosion and microstructural characteristics of Zr-Nb alloys with different Nb contents [J]. Journal of Nuclear Materials, 2008, 373(1): 429-432.
[10] JUNG Y I, LEE M H, KIM H G, PARK J Y, JEONG Y H. Behavior of a recrystallization in HANA-4 and HANA-6 zirconium-based alloys [J]. Journal of Alloys and Compounds, 2009, 479(1): 423-426.
[11] LUAN B F, CHAI L J, CHEN J W, ZHANG M, LIU Q. Growth behavior study of second phase particles in a Zr-Sn-Nb-Fe-Cr-Cu alloy [J]. Journal of Nuclear Materials, 2012, 423(1): 127-131.
[12] TIAN H, WANG X, GONG W, ZHOU J, ZHANG H. Recrystallization behavior of cold-rolled Zr-1Nb alloy [J]. Journal of Nuclear Materials, 2015, 456: 321-328.
[13] LIU Y Z, ZHAO W J, PENG Q, JIANG H M, ZU X T. Study of microstructure of Zr-Sn-Nb-Fe-Cr alloy in the temperature range of 750-820 ��C [J]. Materials Chemistry and Physics, 2008, 107(2): 534-540.
[14] SAINTOYANT L, LEGRAS L, BR CHET Y. Effect of an applied stress on the recrystallization mechanisms of a zirconium alloy [J]. Scripta Materialia, 2011, 64(5): 418-421.
[15] ZHAO W, LIU Y, JIANG H, PENG Q. Effect of heat treatment and Nb and H contents on the phase transformation of N18 and N36 zirconium alloys [J]. Journal of Alloys and Compounds, 2008, 462(1): 103-108.
[16] YANG Z N, XIAO Y Y, ZHANG F C, YAN Z G. Effect of cold rolling on microstructure and mechanical properties of pure Zr [J]. Materials Science and Engineering A, 2012, 556: 728-733.
[17] CHAI L, LUAN B, MURTY K L, LIU Q. Effect of predeformation on microstructural evolution of a Zr alloy during 550-700 ��C aging after �� quenching [J]. Acta Materialia, 2013, 61(8): 3099-3109.
[18] TENCKHOFF E, RITTENHOUSE P L. Annealing textures in zircaloy tubing [J]. Journal of Nuclear Materials, 1970, 35(1): 14-23.
[19] OKAZAKI K, CONRAD H. Recrystallization and grain growth in titanium: I. Characterization of the structure [J]. Metallurgical Transactions, 1972, 3(9): 2411-2421.
[20] BOZZOLO N, DEWOBROTO N, GROSDIDIER T, BARBRIS P, WAGNER F. Grain growth texture evolution in zirconium (Zr702) and commercially pure titanium (T40) [J]. Materials Science Forum, 2004, 467: 441-446.
[21] DEWOBROTO N, BOZZOLO N, BARBRIS P, WAGNER F. Experimental investigations of recrystallization texture development in zirconium (Zr702) [J]. Materials Science Forum, 2004, 467: 453-458.
[22] DEWOBROTO N, BOZZOLO N, WAGNER F. Influence of deformation substructures on the early mechanisms of recrystallization in cold-rolled titanium and zirconium [J]. Materials Science Forum, 2005, 495: 711-718.
[23] BOZZOLO N, GERSPACH F, SAWINA G, WAGNER F. Accuracy of orientation distribution function determination based on EBSD data��A case study of a recrystallized low alloyed Zr sheet [J]. Journal of Microscopy, 2007, 227(3): 275-283.
[24] GUO W Y, SUN J, LI X L, WU J S. EBSD characterization of recrystallization microstructure of cold-swaged Ti-23Nb-0.7Ta-2Zr-O alloy [J]. Transactions of Nonferrous Metals Society of China, 2007, 17(S1): s55-s59.
[25] BOZZOLO N, DEWOBROTO N, GROSDIDIER T, WAGNER F. Texture evolution during grain growth in recrystallized commercially pure titanium [J]. Materials Science and Engineering A, 2005, 397(1): 346-355.
[26] MAO W M, YANG P. Formation mechanisms of recrystallization textures in aluminum sheets based on theories of oriented nucleation and oriented growth [J]. Transactions of Nonferrous Metals Society of China, 2014, 24(6): 1635-1644.
[27] ROLLETT A, HUMPHREYS F J, ROHRER G S, HATHERLY M. Recrystallization and related annealing phenomena [M]. Amsterdam: Elsevier, 2004.
[28] SAINTOYANT L, LEGRAS L, BRCHET Y. Effect of an applied stress on the recrystallization mechanisms of a zirconium alloy [J]. Scripta Materialia, 2011, 64(5): 418-421.
[29] ROLLETT A D, SROLOVITZ D J, DOHERTY R D, ANDERSON M P. Computer simulation of recrystallization in non-uniformly deformed metals [J]. Acta Metallurgica, 1989, 37(2): 627-639.
[30] SEO Y S, CHUN Y B, HWANG S K. A 3D Monte-Carlo simulation study of recrystallization kinetics in Zr with hypothetical stored energy gradients [J]. Computational Materials Science, 2008, 43(3): 512-521.
�����1,2������Ⱥ1,2������1,2���ָ���1,2���� ѵ3������ǫ3��������3������ǿ3
1. ���ϴ�ѧ ���Ͽ�ѧ�빤��ѧԺ����ɳ 410083��
2. ���ϴ�ѧ ��ɫ�����������ص�ʵ���ң���ɳ 410083��
3. �й��˶����о����Ժ ��Ӧ��ȼ�ϼ������ص�ʵ���ң��ɶ� 610213
ժ Ҫ��ͨ��Ӳ�Ȳ��ԡ�SEM��TEM��EBSD�о����������˻��¶ȼ�ʱ�������Zr-1Sn-0.3Nb-0.3Fe-0.1Cr �Ͻ��ٽᾧ��Ϊ������ѧ��Ӱ�졣����������úϽ���ٽᾧ���������˻��¶ȵ��������������������Ӷ��ӿ졣�˻�������ٽᾧ������λ������ĸߴ��ܴ������κ˳����֯����//RD �Ļ���֯��ת��Ϊ//RD�Ļ���֯�����ٽᾧ�����γɽ϶��30��ȡ��ͬʱ��ͨ��JMAK������ϳ��Ͻ��ٽᾧ����ѧ������30%��50%��70%�����������µ��ٽᾧͼ��������ٽᾧ�����ֱܷ�Ϊ240��249��180 kJ/mol��
�ؼ��ʣ�ﯺϽ��ٽᾧ������֯��֯���ݱ䣻����ѧ
(Edited by Wei-ping CHEN)
Foundation item: Project (STRFML-2013) supported by the Science and Technology on Reactor Fuel and Materials Laboratory, China; Project (2014BAC03B05) supported by the Key Projects of the National Science and Technology of China
Corresponding author: Hui-qun LIU; Tel: +86-731-88836320; E-mail: liuhuiqun@csu.edu.cn
DOI: 10.1016/S1003-6326(18)64697-7

