Trans. Nonferrous Met. Soc. China 27(2017) 694-700
Optimization of parameters, characterization and thermal property analysis of hafnium ethoxide synthesized by electrochemical method
Chang-hong WANG, Sheng-hai YANG, Yong-ming CHEN, Yan-zeng WU, Jing HE, Chao-bo TANG
School of Metallurgy and Environment, Central South University, Changsha 410083, China
Received 2 February 2016; accepted 15 June 2016
Abstract: Hafnium ethoxide was synthesized using electrochemical method. Optimization experiments were used to optimize various parameters namely Et4NBr concentration(c): 0.01-0.06 mol/L, solution temperature (t): 30-78 ��C, polar distance (D): 2.0-4.0 cm and current density (J): 100-400 A/m2. The electrolytic products obtained under optimum conditions of c=0.04 mol/L, t=78 ��C, D=2.0 cm and J=100 A/m2 were further isolated by vacuum distillation under 5 kPa. The product was characterized by Fourier transform infrared (FT-IR) spectra, nuclear magnetic resonance (NMR) spectra. The results indicated that the product was hafnium ethoxide. ICP analysis suggested that the content of hafnium ethoxide in the final product exceeded 99.997%. Thermal properties of the product were analyzed by TG/DTG. The vaporization enthalpy of hafnium ethoxide was found to be 79.1 kJ/mol. The result confirmed that hafnium ethoxide was suitable for the preparation of hafnium oxide by atomic layer deposition.
Key words: hafnium ethoxide; electrochemical synthesis; parameter optimization; characterization; thermal analysis
1 Introduction
Hafnium ethoxide is mainly used for the deposition of hafnium oxide (HfO2) layers by atomic layer deposition (ALD), and deposited in this manner, the hafnium-based high-k dielectrics show much more stable electrical characteristics in comparison with the ones formed by sputtering or chemical vapors [1]. As the semiconductor industry ushered in nanometer era, a gate dielectric thickness in the field effect transistor (FET) reached its physical limits because of an increase in leakage currents due to tunneling effects [2-4]. Therefore, it is necessary to replace SiO2 with a high-k gate dielectric. HfO2 layers are amongst the most promising high-k candidates to meet the requirements for replacing the traditional SiO2 gate oxide in complementary metal-oxide�Csemiconductor devices [4,5].
In recent years, the most common method of preparing hafnium alkoxides (Hf(OR)4) has been based on the halide synthesis [6]. This method has the disadvantage that HCl gas is liberated, because an apparatus in which the reaction is carried out is subjected to severe corrosion. And the reaction is performed using large amounts of organic solvents which are harmful to the environment. In addition, the necessary reagents are scarce and the reactions involve various side processes which contaminate the products and decrease their yields [7].
For these reasons, the direct electrochemical synthesis of metal alkoxides by anode dissolution of metals in absolute alcohols in the presence of a conductive admixture seems a very promising method. The electrochemical method has great promise for the direct conversion of the less electropositive metals to their alkoxides owing to its simplicity and high productivity as well as its continuous and non-polluting character (with hydrogen as the major by-product) [6]. In our earlier works, we prepared several tantalum and niobium alkoxides by electrochemical method [8-10]. Many metal alkoxides, such as Y, Ti, Nb, Ta, Mo, W, Cu, Ge, Sn and other metals were also produced by this technique [6,11-13]. Some hafnium alkoxides, such as Hf(OMe)4, Hf(OBut)4, H(OC5H11t)4 and Hf(OEt)4, were prepared using electrochemical method [6]. In 1995, hafnium ethoxide was obtained for the first time by TUREVSKAYA et al [14] with the electrochemical method involving electrolysis of an ethanol solution containing tetrabutylammonium bromide with a platinum cathode and a hafnium anode. However, parameter optimization in the electrochemical synthesis, characterization and thermal property analysis of hafnium ethoxide have not been undertaken so far.
In the present study, optimization experiments for electrochemical synthesis of hafnium ethoxide were carried out to study the effect of various experimental parameters. Hafnium ethoxide synthesized under optimum conditions was further characterized by FT-IR, NMR and thermal analysis techniques.
2 Experimental
Anhydrous ethanol was supplied by Tianjin Hengxing Chemical Preparation Corporation, China. Tetraethylammonium bromide (Et4NBr) was purchased from Sinopharm Chemical Reagent Corporation Limited. All reagents were used without further purification.
The electrolytic cell was made of polypropylene and its dimensions were 15.1 cm (length) �� 7 cm (width) �� 24 cm (height). A stainless steel plate was used as cathode, and its working area was 19.0 cm��12.0 cm. Hafnium plate (2.0 kg), purchased from Zhuzhou Cement Carbide Group Limited Corporation, China, was employed as anode, and its working area was 17.0 cm �� 12.0 cm. The hafnium plates were made from hafnium powders of metallurgical grade with self-resistance sintering, electron bombardment and rolling treatment. The chemical composition of hafnium plate is shown in Table 1.
Table 1 Chemical compositions of hafnium anode (mass fraction, %)
The basic experimental conditions were anhydrous ethanol of 2.2 L, conductive agent of 0.04 mol/L, solution temperature of 78 ��C (boiling temperature), polar distance of 2 cm and applied current of 2 A (current density of 100 A/m2). The effects of Et4NCl, Et4NBr or Et4NHSO4 as supporting electrolytes on the cell voltage with time were studied. The effects of solution temperature, concentration of Et4NBr and polar distance on the cell voltage with current density were investigated, respectively. The effect of current density on the current efficiency was studied.
The hafnium ethoxide and ethanol solution synthesized under optimal condition was distilled at ambient pressure to separate redundant ethanol at temperature above 78 ��C. Then, the distillation temperature was raised to 150 ��C gradually, and a little amount of ester was removed. Finally, the crude hafnium ethoxide solution was distilled at a pressure of 5 kPa and an oil bath temperature of 210-230 ��C. The condensate was preserved in a dry nitrogen-sealed glass bottle to keep it from moisture.
FT-IR spectrum was measured with a Nicolet Avatar 360 IR spectrometer operating in the region of 4000- 400 cm-1. The 1H-NMR spectrum was recorded with an Inova-400 (Varian) nuclear magnetic resonance spectroscope, and chloroform-d was adopted as the dilute reagent. Thermogravimetric measurements were carried out in nitrogen atmosphere using a SDT Q600 V8.0 Build 95 thermoanalytical equipment (flux rate of 200 cm3/min, heating rate of 10 ��C/min, temperature interval of 25-800 ��C, sample mass of 20.6 mg, and surface area of 0.227 cm2 (the TG crucible)). In order to determine impurity contents of hafnium ethoxide, some amount of water was added into hafnium ethoxide solution for hydrolysis reaction. After desiccation in desiccator at 100 ��C for 12 h, the sample was calcined in muffle furnace at 800 ��C for 2 h. The impurity contents were obtained by ICP-Mass Agilent 7500a analyzer. And then the impurity content of hafnium oxide was converted into that of hafnium ethoxide.
3 Results and discussion
3.1 Electrochemical synthesis of hafnium ethoxide
Figure 1 shows the cell voltage-time (Ec-t) curves in anhydrous ethanol using Et4NCl, Et4NBr or Et4NHSO4 as electrolytes at a polar distance of 2 cm and an applied current of 2 A. At the beginning of the electrolysis, Ec decreases steeply to a minimum at a certain time (ti), probably corresponding to the rapid increase in the temperature and the dissolution of the surface oxide film. After ti, it is worth noting that Ec values of Et4NCl and Et4NBr begin to increase slightly whereas Ec of Et4NHSO4 increases rapidly. The increase in Ec can be explained by the following points: on the one hand, after ti, as the electrolysis continues to carry out, the polar distance gradually increases and the anode working area slowly shrinks, leading to the increase of the solution resistance; on the other hand, the continuous electrolysis gives rise to the formation of increasing amounts of soluble product in the solution, contributing to the increase in the viscosity, resulting in precluding the migration rate of supporting electrolyte. At a fixed applied current, Ec values are found to be enhanced in the order: Et4NCl>Et4NBr>Et4NHSO4, among which Ec values of Et4NCl and Et4NBr are relatively very close. In addition, it is found that there is only one step for preparing Et4NBr, which is favourable to a significant reduction in the cost. In contrast, the preparation of Et4NCl and Et4NHSO4 needs three steps, in which the preparation of Et4NBr is the first step. Therefore, it is reasonable to choose Et4NBr as the supporting electrolyte.
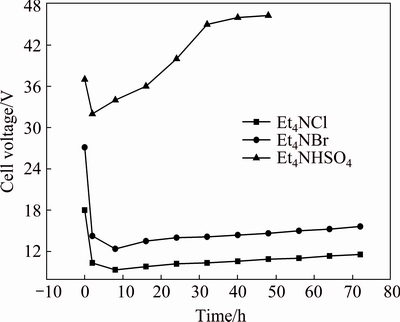
Fig. 1 Cell voltage-time (Ec-t) curves recorded for three supporting electrolytes in anhydrous ethanol at polar distance of 2 cm and applied current of 2 A
Figure 2 illustrates the current density-cell voltage (J-Ec) curves in anhydrous ethanol containing 0.01 mol/L Et4NBr at a polar distance of 2 cm and various solution temperatures. As shown in Fig. 2, at the same temperature, a linear relationship is observed between J and Ec; at the same cell voltage, it is found that a higher temperature contributes to a greater current density. These results can be interpreted in terms of the solution conductivity, which is as high as 10-4-10-3 S/cm at 20 ��C but 10-3-10-2 S/cm at 70 ��C, indicating that the increasing temperature is favorable to improving the conductivity as a result of the accelerated rates of mass-transfer by diffusion which contributes to a decreased resistance to charge-transfer. Moreover, it is worth mentioning that at higher cell voltage, the bulk of electric energy consumed is transformed to heat energy, which results in a rapid rise in the temperature of the electrolysis. This makes it more difficult to carry out the electrolysis below the temperature of the boiling point. Thus, it is reasonable to choose the optimal temperature as the boiling point (78 ��C).
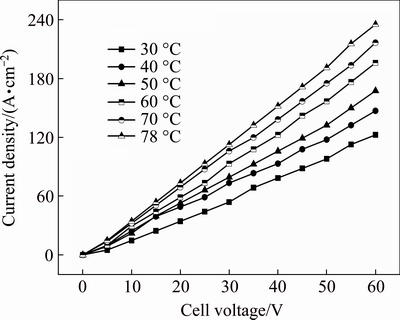
Fig. 2 J-Ec curves in anhydrous ethanol containing 0.01 mol/L Et4NBr at polar distance of 2 cm and various solution temperatures
Figure 3 presents the J-Ec curves in anhydrous ethanol containing Et4NBr with various concentrations at a polar distance of 2 cm and 78 ��C. It is observed that at the same concentration of Et4NBr, a linear relationship is observed between J and Ec; at the same cell voltage, an increase in the Et4NBr concentration causes a greater current density, but this increase in current density is disproportionate. In other words, when the Et4NBr concentration attains a certain value, the increment of current density tends to steeply decay with continuing to increase Et4NBr concentration. Therefore, it is reasonable to set the optimal Et4NBr concentration as 0.04 mol/L.
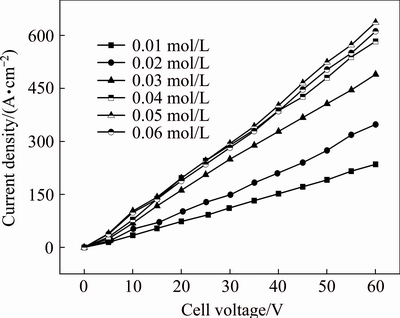
Fig. 3 J-Ec curves in anhydrous ethanol containing Et4NBr with various concentrations at polar distance of 2 cm and 78 ��C
Figure 4 presents the J-Ec curves in anhydrous ethanol containing 0.04 mol/L Et4NBr at 78 ��C and various polar distances. It is clear that at the same polar distance, a linear relationship between J and Ec is observed; at the same cell voltage, increasing the distance decreases the current density, causing an increase in energy consumption. Therefore, the optimal polar distance is assumed to be 2 cm.
At the currents of 2, 4, 5, 6 and 8 A, electrolysis is carried out on the duration of 12, 6, 5, 4 and 3 h, respectively. After the electrolysis, hafnium plates are weighed and the calculated current efficiencies are as high as 96.1%, 95.2%, 93.9%, 94.2% and 93.1%, respectively. In addition, higher current causes higher cell voltage, which results in greater energy consumption. Consequently, the optimal applied current is considered to be 2 A (100 A/m2).
Based on the above condition experiments, the optimal synthesis conditions are 0.04 mol/L Et4NBr, boiling temperature of 78 ��C, polar distance of 2 cm and current density of 100 A/m2.
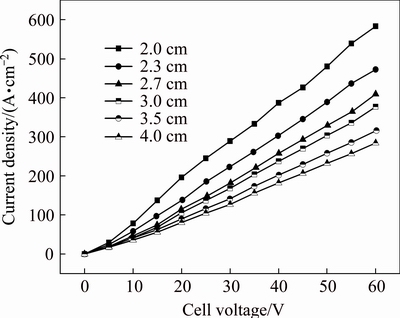
Fig. 4 J-Ec curves in anhydrous ethanol containing 0.04 mol/L Et4NBr at 78 ��C and various polar distances
3.2 Structure characterization
Figure 5 shows the FT-IR spectrum of hafnium ethoxide. Several peaks between 2998 and 2880 cm-1 are due to ��(C��H) stretching vibration of alkoxy groups. Peaks at around 2998 and 2880 cm-1 are attributed to asymmetric and symmetric stretch vibrations, respectively. The sharp bands at around 1468 and 1382 cm-1 correspond to the ��(C��H) bending vibrations. The peak at 1468 cm-1 is assigned to scissoring vibration of methylene. The peak at around 1382 cm-1 is ascribed to symmetric bending vibration of methyl groups. Bands at 1200-1000 cm-1 correspond to the C��O vibrations of alkoxy groups bound to Hf. The broad envelopes of bands below 600 cm-1 are due to the Hf��O stretching modes occurring along with bending and torsional modes of the ligands. There are no bands between 3600 and 3100 cm-1 in Fig. 5, indicating that the samples are well preserved and the partial hydrolyzation does not occur [15].
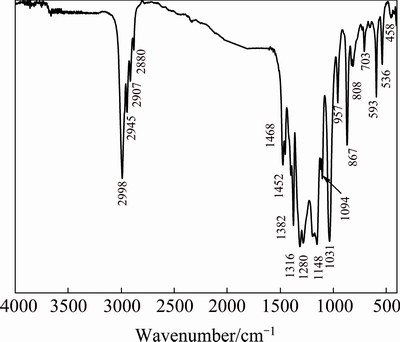
Fig. 5 FT-IR spectrum of hafnium ethoxide
Nuclear magnetic resonance studies on hafnium ethoxide have been very useful in understanding and assigning the structure of these species. Figure 6 shows the 1H NMR spectrum of Hf(OEt)4 in CDCl3 with respect to tetramethylsilane. Solvent peaks are observed at chemical shift of 7.27��10-6. Peak assignments in the plot are as follows: the signals at chemical shifts of 4.50��10-6 and 4.36��10-6 are attributed to HA. The major peak at chemical shift of 1.25��10-6 is due to HB, namely the H atom of the terminal methyl. The proportion of spectral integral area is 1.00:1.61��2:3, conforming the stoichiometry of the compound Hf(OCH2CH3)4.
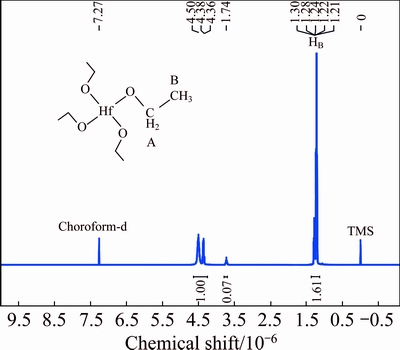
Fig. 6 1H NMR spectrum of hafnium ethoxide sample(A and B represent serial number of H atom)
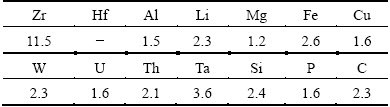
Table 2 presents the content of impurities in hafnium ethoxide. The total content of all other impurity elements except for Zr is 2.51��10-5. Therefore, the purity of hafnium ethoxide purified by reduced pressure distillation can be up to 99.997% and can meet the demand of atomic layer deposition (ALD). The content of Zr is relatively high whereas the element zirconium is not more harmful to the quality than other elements.
Table 2 Impurity contents in hafnium alkoxides (mass fraction, 10-6)
3.3 Thermal property analysis and vapour pressure estimation
Thermal property is of prime consideration in assessing the feasibility of a metallorganic compound as a precursor in ALD, demonstrating the conditions required to transport material from its source container to the deposition zone.
A typical TG-DTA/DTG curve for hafnium ethoxide obtained at a heating rate of 10 ��C/min is shown in Fig. 7(a). Below 350 ��C, the DTA plot has two peaks, the first is due to the evaporation of hafnium ethoxide in the temperature range of 152-268 ��C, and the second is probably due to the pyrolytic decomposition of hafnium ethoxide in the temperature range 268-320 ��C. The TG curve displays a single mass loss in the temperature range of 172-251 ��C. On the DTG plot, the rate of mass loss shows a rapid increase after reaching 175 ��C. The rate of mass loss continues to increase as the sample evaporates, reaching the maximum rate at the DTG peak temperature of 240 ��C. A white residue of about 22% of the total mass loss remains in the sample crucible at the end of the experiment, indicating that a part of pyrolytic decomposition of hafnium ethoxide had occurred.
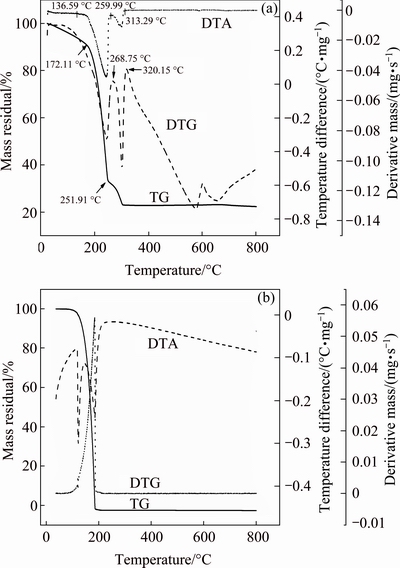
Fig. 7 TG-DTA/DTG plots for hafnium ethoxide (a) and benzoic acid (b)
Langmuir equation is used to calculate the vapour pressure and the vaporization enthalpy of hafnium ethoxide. The principle of using thermogravimetry to estimate the vapour pressure is based on the Langmuir equation [16]:
 (1)
(1)
where (1/a)(dm/dt) is the rate of mass loss per unit area (kg/(s��m2)), p is the vapour pressure (Pa), M is the relative molecular mass of the vapour of the evaporating compound (kg/mol), T is the thermodynamic temperature (K), and �� is the vaporization coefficient. In vacuum, �� is assumed to be 1, but in a flowing gas atmosphere as commonly found in TG experiments �� is assumed to be a significantly different value. Rearranging the Langmuir equation gives
p=kv (2)
where  /�� and v=(1/a)(dm/dt)
 The usual procedure using TG is to determine the rate of mass loss over the temperature range of interest using a compound known to be thermally stable. Knowing the vapour pressure of the standard compound at different temperatures, and obtaining dm/dt from TG/DTG plots, the value of k is determined. Benzoic acid has been assumed as a suitable material for this role [17-19]. Then, it is used as the calibrating material for the determination of k in the modified Langmuir equation. The enthalpy of vaporization is calculated from the vapour pressure-temperature data using the Clausius- Clapeyron equation:
 (3)
(3)
Hence, a plot of ln p versus 1/T gives a straight line, the slope of which is -��H/R. Thus, the enthalpy of vaporization may be calculated.
The TG/DTG plot for benzoic acid is shown in Fig. 7(b). The values of dm/dt at different temperatures are obtained, and divided by the surface area of the TG crucible to get the mass loss rate per unit surface area. k is calculated to be 1.472��105 J1/2/(K1/2��mol1/2) as required by Eq. (1). Using this value of k, the vapour pressure- temperature curve for hafnium ethoxide is calculated, as shown in Fig. 8. Using the vapour pressure-temperature data, the plot of ln p versus 1/T is obtained as straight line for hafnium ethoxide, from which, using the Clausius�CClapeyron equation, the slope gives -��H/R, and hence the vaporization enthalpy ��H. The plot of ln p versus 1/T for hafnium ethoxide is shown in Fig. 9. The linear fitting to the data, the slope of which gives the enthalpy of sublimation, is also shown in Fig. 9. The linear nature of this curve allows the vaporization enthalpy to be calculated from the slope, and the value is calculated to be 79.1 kJ/mol for hafnium ethoxide. The vapour pressure-temperature equation for hafnium ethoxide can be expressed as ln p=24.1-9510.3/T. Since the TG data are calculated from 157 to 237 ��C, and since none of the white residue appears on the TG crucible at the end of 157-237 ��C mass loss, indicating that the decomposition is likely to be much slower at lower temperatures, the TG data are probably valid.
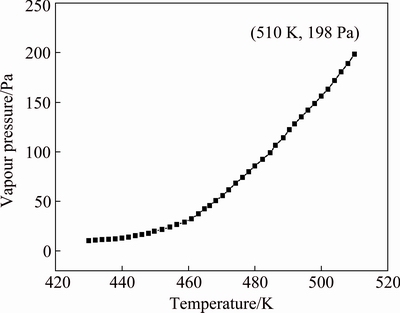
Fig. 8 Vapour pressure-temperature curve of hafnium ethoxide
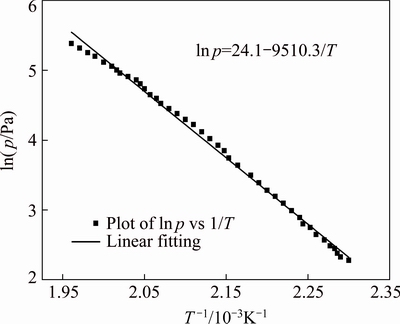
Fig. 9 Plot of ln p versus 1/T for hafnium ethoxide
4 Conclusions
1) Optimization experiments were carried out to optimize various parameters including Et4NBr concentration, solution temperature, polar distance and current density. Based on the condition experiments, optimal electrochemical synthesis conditions were found to be Et4NBr concentration of 0.04 mol/L, boiling temperature of 78 ��C, polar distance of 2 cm and current density of 100 A/m2. The current efficiency was found to be higher than 93%.
2) The electrolytic products obtained under the optimum conditions were further isolated by vacuum distillation to acquire the pure hafnium ethoxide. Its structure was characterized by FT-IR and NMR spectra. The results consistently demonstrated that the sample was hafnium ethoxide. The purity of hafnium ethoxide purified by reduced pressure distillation can be up to 99.997%.
3) Thermal properties of the product were analyzed by TG/DTG. The vapour pressure-temperature equation for hafnium ethoxide can be expressed as ln p=24.1- 9510.3/T. The vaporization enthalpy of hafnium ethoxide was found to be 79.1 kJ/mol. The results confirmed that Hf(OEt)4 was suitable for the preparation of hafnium oxide (HfO2) by atomic layer deposition (ALD).
References
[1] BOHR M T, CHAU R S, GHANI T, MISTRY K. The high-k solution [J]. IEEE Spectrum, 2007, 44: 29-35.
[2] USUI T, DONNELLY C A, LOGAR M, SINCLAIR R, SCHOONMAN J, PRINZ F B. Approaching limits of dielectric breakdown for SiO2 films deposited by plasma-enhanced atomic layer deposition [J]. Acta Materialia, 2013, 61(20): 1-11.
[3] KARMAKOV I, KONOVA A, ATANASSOVA E, PASKALEVA A. Spectroscopic ellipsometry of very thin tantalum pentoxide on Si [J]. Applied Surface Science, 2009, 255: 9211-9216.
[4] ZHANG F, LIU G X, LIU A, BYOUNGCHUL S, SHAN F. Solution-processed hafnium oxide dielectric thin films for thin-film transistors applications [J]. Ceramics International, 2015, 41: 13218-13223.
[5] HILDEBRANDT E M. Oxygen engineered hafnium oxide thin films grown by reactive molecular beam epitaxy [M]. Darmstadt: Technical University of Darmstadt Press, 2012: 11-17.
[6] BRADLEY D C, MEHROTRA R, ROTHWELL I, SINGH A. Alkoxo and aryloxo derivatives of metals [M]. San Diego: Academic Press, 2001.
[7] SHREIDER V A, TUREVSKAYA E P, KOSLOVA N I, TUROVA N Y. Direct electrochemical synthesis of metal alkoxides [J]. Inorganica Chimica Acta, 1981, 53: 73-76.
[8] YANG S H, CHEN Y M, YANG H P, LIU Y Y, TANG M T, QIU G Z. Preparation of high-purity tantalum ethoxide by vacuum distillation [J]. Transactions of Nonferrous Metals Society of China, 2008, 18(1): 196-201.
[9] YANG S H, CAI Y N, YANG H P, Jin S M. Electrochemical synthesis and characterization of tantalum alkoxides [J]. Transactions of Nonferrous Metals Society of China, 2009, 19(6): 1504-1508.
[10] CAI Y N, YANG S H, JIN S M, YANG H P, HOU G F, XIA J Y. Electrochemical synthesis, characterization and thermal properties of niobium ethoxide [J]. Journal of Central South University of Technology, 2011, 18: 73-77.
[11] BANAIT J S, PAHIL P K. Electrochemical reactions at sacrificial electrodes. Part III: Electrochemical synthesis of unique copper (II) alkoxides [J]. Synthesis and Reactivity in Inorganic, Metal-Organic, and Nano-Metal Chemistry, 1988, 18(4): 309-315.
[12] BANAIT J S, BALJIT S, RALA S. Electrochemical reactions at sacrificial electrodes. Part XIX: Sythesis of antimony alkoxides [J]. Journal of the Indian Chemical Society, 2007, 84: 135-138.
[13] BANAIT J S, BALJIT S, KAUR H. Electrochemical reactions at sacrificial electrodes: Synthesis of zinc (II) alkoxides. Part XVII [J]. Indian Journal of Chemistry A, 2007, 46: 266-268.
[14] TUREVSKAYA E P, KOZLOVA N I, TUROVA N Y, BELOKON A I, BERDYEV D V, KESSLER V G, GRISHIN Y K. The alkoxides of zirconium and hafnium: Direct electrochemical synthesis and mass-spectral study. Do ��M(OR)4��, where M=Zr, Hf, Sn, really exist? [J]. Russian Chemical Bulletin, 1995, 44(4): 734-742.
[15] SILVERSTEIN R M, WEBSTER F X, KIEMLE D. Spectrometric identification of organic compounds [M]. New York: John Wiley & Sons, 2005: 82-101.
[16] LANGMUIR I. The vapor pressure of metallic tungsten [J]. Physical Review, 1913, 2: 329-342.
[17] KUNTE G V, SHIVASHANKAR S A, UMARJI A M. Thermogravimetric evaluation of the suitability of precursors for MOCVD [J]. Measurement Science and Technology, 2008, 19(2): 1-7.
[18] WRIGHT S F, DOLLIMOREL D, DUNN J G, ALEXANDER K. Determination of the vapor pressure curves of adipic acid and triethanolamine using thermogravimetric analysis [J]. Thermochimica Acta, 2004, 421: 25-30.
[19] WRIGHT S F, PHANG P, DOLLIMORE D, ALEXANDER K S. An overview of calibration materials used in thermal analysis��Benzoic acid [J]. Thermochimica Acta, 2002, 392-393: 251-257.
�绯ѧ�ϳ��Ҵ����IJ����Ż��������������ܷ���
�����죬�������������������������� �����Ƴ���
���ϴ�ѧ ұ���뻷��ѧԺ����ɳ 410083
ժ Ҫ�����õ绯ѧ�����ϳ��Ҵ������Ż��绯ѧ�ϳɹ����еĸ����������������һ��廯�Ũ��(c)��0.01~0.06 mol/L����Һ�¶�(t)��30~78 ��C������(D): 2.0~4.0 cm �͵����ܶ�(J)��100~400 A/m2������������(c=0.04 mol/L��t=78 ��C��D=2.0 cm��J=100 A/m2)�»�õĵ绯ѧ����ͨ����ѹ����(5 kPa)��һ�������ᴿ�����������ղ���ͨ��������ͺ˴Ź�����б������������������Ϊ�Ҵ��������ղ������ʺ���ͨ��ICP ����������������Ҵ��������ղ���ĺ�������99.997%������TG/DTG�����ò����Ҵ��������ȷ������õ�����������Ϊ79.1 kJ/mol�����������Ҵ����ʺ�ԭ�ӳ������Ʊ���������
�ؼ��ʣ��Ҵ������绯ѧ�ϳɣ������Ż����������ȷ���
(Edited by Wei-ping CHEN)
Foundation item: Project (51374254) supported by the National Natural Science Foundation of China
Corresponding author: Sheng-hai YANG; Tel: +86-13975894838; E-mail: Yangshcsu@163.com
DOI: 10.1016/S1003-6326(17)60077-3

