
Hydrogen diffusion in Zr35Ni55V10 amorphous alloy
CHENG Xiao-ying(程晓英), WAHG Fang(王 芳)
Institute of Materials Science, Shanghai University, Shanghai 200072, China
Received 20 October 2006; accepted 25 December 2006
Abstract: Hydrogen diffusion in Zr35Ni55V10 amorphous alloy was measured by chronopotentiometry. The results show that at lower molar ratio of hydrogen (x<0.06, x=n(H)/n(M)), the diffusivity of hydrogen increases rapidly with increasing the molar ratio of hydrogen. However, when x(H)>0.1, the diffusivity of hydrogen decreases slightly with increasing the molar ratio of hydrogen, which is similar to the change in crystalline alloy. It is proposed that hydrogen atoms mainly occupy the sites corresponding to tetrahedra with 4 Zr atoms at lower molar ratio of hydrogen. When the molar ratio of hydrogen is higher, the additional hydrogen atoms are in sites with higher energy and these sites in amorphous state are similar to these in crystalline states.
Key words: Zr35Ni55V10 alloy; amorphous materials; hydrogen diffusion; melt spinning; chronopotentiometry
1 Introduction
The interaction of hydrogen with amorphous metals has been studied extensively during the last two decades because of both scientific and technological interests. For example, hydrogen in amorphous metals may be used as a probe to study the structure of the amorphous state [1-2]. In addition, the study on hydrogen transport processes in the amorphous structure may enable a better understanding of the diffusion of hydrogen through grain boundaries and its interaction with structural defects (trapping) in crystalline metals. On the other hand, various actual and potential applications of amorphous metals are concerned with exposure to hydrogen (e.g. improving the production and electrical properties of amorphous semiconductor structures, hydrogen storage technology, devices for fusion reactors, hydrogen- permeable membrane). Recently, amorphous alloys are developed as new hydrogen permeation membrane materials[3-5]. The study on hydrogen diffusion is of great important.
Some research results[6-8] showed that the diffusivity of hydrogen in amorphous metals increases with hydrogen concentration due to the structural features of amorphous alloys. Some models[9] indicated that the diffusion coefficient of hydrogen in metallic glasses is deviated from Arrhenius law because of the existence of various kinds of jumps or in terms of continuous distributions of activation energies due to different kinds of disorder. Recently, a new concentration dependence of diffusivity and diffusion activation energy of hydrogen was presented[10-11]. However, the influence of the hydrogen concentration on hydrogen diffusion in amorphous alloys is still obscure and there needs more hydrogen diffusivity data to elucidate the rule. Further, data of hydrogen diffusivity in amorphous alloys are not abundant as that in crystalline alloys. One reason is that these traditional experiments (e.g. time-lag method) used in studying hydrogen diffusion in crystalline alloy are not proper in amorphous alloys because of small-size amorphous samples and the dependence of hydrogen diffusivities on the hydrogen concentration in amorphous alloys. In this research, hydrogen diffusion in Zr35Ni55V10 amorphous alloy was measured by chronopotentiometry. This method can deal with the small-size samples and the measured hydrogen diffusivity can denote the diffusivity in a small range of hydrogen concentration. In addition, Zr35Ni55V10 alloy is one of the model materials to study hydrogen behavior in amorphous state because of its simple component and ease to obtain bulk amorphous state.
2 Experimental
Zr35Ni55V10 alloy with a mean thickness of 30 μm and wideness of 1.1 mm was prepared by arc melting and subsequently rapidly quenched by a single roller melt spinning technique in an argon atmosphere. Structures of the sample after melt spinning or after hydrogen diffusion were identified by X-ray diffraction(XRD) using Cu Kα radiation.
Before hydrogen diffusion, a sandwich-structural electrode was made through cold-rolling the Zr35Ni55V10 alloy between two pieces of porous nickel. Then the electrode was immersed in the electrolyte in two electrolytic compartments, which were equipped with calomel-reference and platinum-counter electrodes. Hydrogen diffusion in the electrode was measured by chronopotentiometry (see Fig.1). First, the cathode bias current was loaded at a constant current density (Jcathode) on both faces of the electrode, and then, the electrode was changed to load an anode current (Janode). After a charged current step (cathode current) was end, the potential change was recorded chronologically. The electrolyte was 0.1 mol/L NaOH solution poisoned with 2 mL/L Na2S saturated solution. With the aid of a potentiostat, a constant voltage between the sample electrode and reference electrode could be maintained, and choosing an appropriate voltage, the sample was depleted of hydrogen and used again for different hydrogen concentration and temperature.
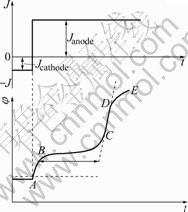
Fig.1 Schematic diagram of galvanostat transient curve
3 Results and discussion
3.1 Chronopotentiometry
After the cathode current is biased, the electrode is doping hydrogen. The ratio, x=n(H)/n(M) was calculated by the Faraday’s Law [1]:
where Jcathode is the biased current density of cathode, x is the molar ratio of doping hydrogen, F is the Faraday’s constant, A is the sample’s area, tcathode is the charging time, n(M) is the mole number of alloy. The charged hydrogen is assumed homogenization when the charging time is long enough and bubbles of hydrogen do not appear on the sample surfaces.
When the current of anodic is biased, the potential changes (Fig.1). “AB” denotes the change of potential resulting from the polarized current, i.e., bielectrolytic layer charging; “BC” is a plateau and denotes little change of potential with time, when the electron donated by electrode through Eqn.(2) is equal to the electron taken away through anodic polarization at a constant density. In “BC”, the hydrogen is discharged from the alloy. “CD” is also denoted a bielectrolytic layer charging; the potential becomes more positive because the electron donated by electrode through Eqn.(2) is less than the electron taken away through anodic polarization; “DE” denotes the formation of oxide or releasing oxygen. In this study, “DE” was not allowed to occur.

Before the transition time(τ), there is a relation as follows:
where Janode is the biased current density of anodic, x is the molar ratio of hydrogen, D is the diffusivity of hydrogen, X is the distance, h is the thickness of the alloy. However, the diffusion process through the sample is described by the classical Fick’s Second Law, and in our case, a discussion of one-dimensional problem is only necessary:
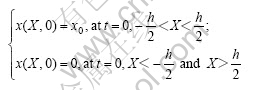
under initial and boundary conditions:
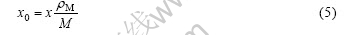
where x0 is the initial molar number per volume of hydrogen. x0 and x are related by
where erf(.) is the density of the alloy, M is the molar quality of the alloy. Therefore, x(X, t) in the sample is given by
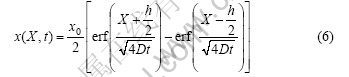
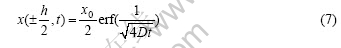
where erf(?) is an error function. At X=±h/2, it can be obtained:
The differential of x at X=±h/2 is
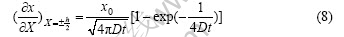
According to Eqn.(8), the gradient of hydrogen at X=±h/2 decreases with increasing the time. According to Eqn.(3), there is a relation at the transition time τ:
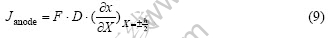
Therefore, the diffusivity of hydrogen in the sample can calculated by Eqn.(8) and Eqn.(9)
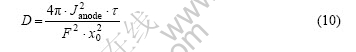
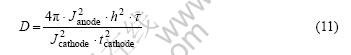
Being substituted by Eqn.(1) and Eqn.(5), the Eqn.(10) can be simplified:
3.2 Diffusivities measured at different anodic currents
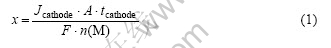
From XRD patterns of the sample after melt- spinning or measuring the diffusivity of hydrogen (see Fig.2), they are clearly recognized that only amorphous phase is detected. The molar ratio of hydrogen doping at different cathode currents is less than 0.22. This indicates that the hydrogen diffusion occurs exclusively through the amorphous phase, not the hydride phase or crystalline phase.
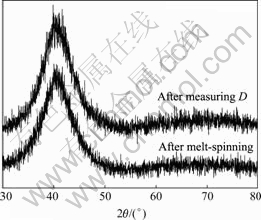
Fig.2 XRD patterns of samples
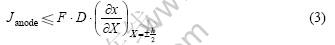
According to Eqn.(7) and Eqn.(8), the molar ratio and concentrations gradient of hydrogen at X=±h/2 decrease with increasing the time. To improve measurements of diffusivity, different anodic currents were loaded on different initial molar ratios of hydrogen. As the anodic current is large enough (i.e. the concentrations gradient of hydrogen is large enough), the diffusivity measured is more close to the diffusivity at initial concentration of hydrogen. As the anodic current is decreased, the diffusivities are average data between the diffusivities at initial and lower concentrations of hydrogen. However, if the anodic current is too large, the transition time is obscure. Therefore, it should select a proper anodic current to measure diffusivity at a hydrogen concentration. Fig.3 shows the hydrogen diffusivities measured at different anodic currents after doping hydrogen at different cathode currents at room temperature of 23 ℃. It can be seen that when the cathode current is beyond 0.40 mA, the diffusivity decreases slightly with increasing the anodic current. When the cathode current is less than 0.40 mA, the diffusivity increases rapidly with increasing the anodic current. These results were collected on the basis of the relation of diffusivity and concentration (see Fig.4). The measured hydrogen diffusivities are on the same orders as that measured by other methods[6,10].
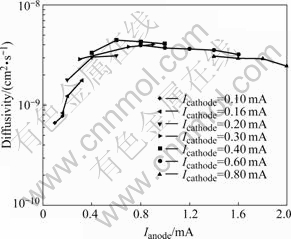
Fig.3 Diffusivity vs anodic current after doping hydrogen at different cathodic currents at 23 ℃
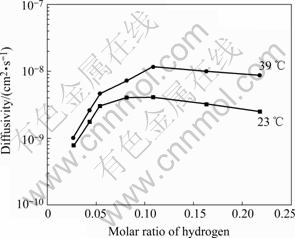
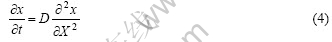
Fig.4 Diffusivity vs molar ratio of hydrogen (x) at different temperatures
3.3 Diffusivities at different molar ratios of hydrogen
Fig.4 shows the effects of molar ratio of hydrogen on the diffusivity. The diffusivity was calculated by the largest anodic current at each initial hydrogen concentration (i.e., cathode current) in Fig.3. From Fig.4, it is found that at lower molar ratio of hydrogen (x<0.06), the diffusivity increases rapidly with increasing the ratio at 23 ℃ and 39 ℃. This is consistent with other works, where the hydrogen jump rates in glassy hydrides often very rapidly become faster[1-2, 9, 12-13] as the hydrogen content increases. However, when x>0.1, the diffusivity decreases slightly with increasing the ratio. In Monte-Carlo simulations of interstitial hydrogen diffusion in amorphous metals, KIRCHHEIM and STOLZ[14] indicated that when x>0.1, blocking of sites as expressed in the model by the factor 1-C squared plays an important role. In experiments of measuring hydrogen diffusivity by the emf-values, STOLZ et al[12] also indicated that the emf-values exhibit a distinct change at a concentration of about 0.25. In their work, the diffusion coefficients of hydrogen in amorphous Ni35Ti65 showed remarkable dependence on concentration. Even at concentration as high as 1, where blocking of sites and correlation effects were expected to decrease hydrogen mobility, the diffusivity still increases. However, a recent work[10-11] showed that the dependence of the hydrogen diffusivity on concentration in the concentration range between 0 and 1.9 in Zr69.5Cu12- Ni11Al7.5 metallic glass has three regions. At x<0.2, D exhibits a weakly pronounced maximum at x=0.1; when 0.2<x<0.9, D decreases in a linear-like manner due to site blocking and lattice expansion; at x>0.9, D does not change any more with concentration. In our work, the dependence of D and x exists a turn at x=0.06 and a maximum in D at x=0.1, which is similar to the result in Ref.[10]. When x>0.1, the dependence of D on x in amorphous alloy shows as similar as that in crystalline alloy. The usual hydrogen diffusion behavior in crystalline hydrides[2,14] is that mobility decreases with increasing hydrogen concentration, but the change in the diffusion coefficients as a function of concentration is remarkably small. The reason is that the pre-exponential factors D0 shows nearly no concentration dependence, the activation energies increase (in spite of the expansion of the lattice) by nearly a factor of two. It may suggest that in both amorphous and crystalline structures hydrogen occupies similar sites when x>0.1.
HARRIS et al[15] created universal features of hydrogen absorption in AnB1-n metallic glasses, A(B) is an early(late) transition metal and proposed a statistical model suggesting a chemically random alloy with a structure consisting of packed, distorted tetrahedral sites AnB4-n (n=0, 1, 2, 3, 4). The sequence of site energy from low to high is B4, B3A, B2A2, BA3, A4. They also suggested the maximum values of x for the first three energy levels to be 0.03, 0.23, or 0.62, respectively. It is intriguing in Fig.4 that the turning point corresponds to the initial concentration 0.06. The value corresponds to the actual concentration 0.03 on the faces of the electrode according to Eqn.(7) when the hydrogen discharge time is not very long. It is proposed from the maximum values of x for the Zr4 site that hydrogen atoms mainly occupy the sites corresponding to tetrahedra with 4 Zr atoms in the x range between 0 and 0.03. When the hydrogen concentration is above 0.03, the additional hydrogen above 0.03 occupies sites of much higher energy (e.g. Zr3Ni, Zr2Ni2, ZrNi3) and these sites in amorphous state are similar to that in crystalline state.
4 Conclusions
1) The H/M-dependence of the hydrogen diffusivity in the molar ratio of hydrogen between 0 and 0.22 demonstrates that a turn exists at x=0.06.
2) At lower molar ratio of hydrogen, x<0.06, the hydrogen diffusivity rapidly increases with increasing molar ratio. The hydrogen atoms mainly occupy the sites corresponding to tetrahedra with 4 Zr atoms.
3) When x>0.10, the hydrogen diffusivity slightly decreases with increasing molar ratio, which is similar to that in crystalline state.
References
[1] KIRCHHEIM R, SOMMER F, SCHLUCKEBIER G. Hydrogen in amorphous metals (I) [J]. Acta Metall, 1982, 30: 1059-1068.
[2] ELIAZ N, ELIEZER D. An overview of hydrogen interaction with amorphous alloys [J]. Adv Perform Mater, 1999, 6: 5-31.
[3] DOLAN M D, DAVE N C, ILYUSHECHKIN A Y, MORPETH L D, MCLENNAN K G. Composition and operation of hydrogen-selective amorphous alloy membranes [J]. Journal of Membrane Science, 2006, 285:30-55.
[4] KIM K B, KIM K D, LEE D Y, KIM Y C, FLEURY E, KIM D H. Hydrogen permeation properties of Pd-coated Ni60Nb30Ta10 amorphous alloy membrane [J]. Materials Science and Engineering A, 2007, 449/451: 934-936.
[5] YAMAURA S, KIMURA H, INOUE A. Hydrogen permeation characteristics of melt-spun Ni-Nb-Zr amorphous alloy membranes [J]. Mater Trans, 2003, 44: 1885-1890.
[6] dos SANTOS D S, de MIRANDA P E V. Hydrogen diffusion in Fe40Ni38Mo4B18 amorphous metallic alloys [J]. J Alloys Comp, 2003, 348: 241-246.
[7] GOO N H, LEE K S. The electrochemical hydriding properties of Mg-Ni-Zr amorphous alloy [J]. International Journal of Hydrogen Energy, 2002, 27: 433-438.
[8] LEE Y S, STEVENSON D A. Hydrogen permeation in amorphous Cu-Ti and Pd-Si alloys [J]. Journal of Non-Crystalline Solids, 1985, 72: 249-266.
[9] ELIAZ N, FUKS D, ELIEZER D. A new model for the diffusion behavior oh hydrogen in metallic glasses [J]. Acta Mater, 1999, 47: 2981-2989.
[10] APIH T, BOBNAR M, DOLIN?EK J, JASTROW L, ZANDER D, K?STER U. Influence of the hydrogen content on hydrogen diffusion in the Zr69.5Cu12Ni11Al7.5 metallic glass [J]. Solid State Communications, 2005, 134: 337-341.
[11] DOLIN?EK J, APIH T, KLANJ?EK M, KIM H J, K?STER U. Hydrogen diffusion in quasi crystalline and amorphous Zr-Cu-Ni-Al [J]. Catalysis Today, 2007, 120(3/4): 351-357.
[12] STOLZ U, WELLER M, KIRCHHEIM R. Internal friction of hydrogen in amorphous Ni35Ti65 [J]. Scripta Metall, 1986, 20:1361-1366.
[13] KIRCHHEIM R. Solubility, diffusivity and trapping of hydrogen in dilute alloys, deformed and amorphous metals (II) [J]. Acta Metall, 1982, 30: 1069-1078.
[14] KIRCHHEIM R, STOLZ U. Monte-carlo simulations of interstitial diffusion and trapping (II): Amorphous metals [J]. Acta Metall, 1987, 35: 281-291.
[15] HARRIS J H, CURTIN W A, TENHOVER M A. Universal features of hydrogen absorption in amorphous transition-metal alloys [J]. Phys Rev, 1987, B36: 5784-5797.
Foundation item: Project(0452NM002) supported by the Science and Technology Committee of Shanghai, China; Project(02ZE14033) supported by the Natural Science Foundation of Shanghai, China
Corresponding author: CHENG Xiao-ying; Tel: +86-21-56336532; E-mail: chengxy@staff.shu.edu.cn
(Edited by YANG Hua)

