基于机器视觉的再生铜铜含量快速估计系统
来源期刊:中国有色金属学报(英文版)2014年第8期
论文作者:张宏伟 葛志强 袁小锋 宋执环 叶凌箭
文章页码:2665 - 2676
关键词:再生铜;铜含量估计;样本筛选;颜色向量角;最小二乘支持向量回归
Key words:secondary copper; copper content estimation; sample selection; color vector angle; least squares support vector regression
摘 要:针对废杂铜再生熔炼过程中铜含量指标离线检测时滞大的问题,提出一个基于机器视觉的铜含量快速检测系统。首先,使用3CCD彩色相机获取再生铜样本的横截面图像。然后,利用图像亮度标准差和边缘像素百分比这两个特征筛选建模样本。改进了颜色向量角,并提取建模铜样本的颜色向量角。最后,利用改进的颜色向量角和实测铜含量数据建立一个基于最小二乘支持向量机的铜含量估计模型。为了对比,如下铜含量最小二乘支持向量回归模型也被建立: 1)仅使用样本筛选方法; 2) 仅改进颜色向量角;3) 不使用样本筛选方法和改进的颜色向量角。另外,还分别建立了使用样本筛选方法和不使用样本筛选方法的两个指数函数铜含量回归模型。实验结果表明,同时使用样本筛选方法和改进颜色向量角的最小二乘支持向量回归模型具有最高的估计准确度,尤其是当建模样本数目较少的时候。
Abstract: A vision-based color analysis system was developed for rapid estimation of copper content in the secondary copper smelting process. Firstly, cross section images of secondary copper samples were captured by the designed vision system. After the preprocessing and segmenting procedures, the images were selected according to their grayscale standard deviations of pixels and percentages of edge pixels in the luminance component. The selected images were then used to extract the information of the improved color vector angles, from which the copper content estimation model was developed based on the least squares support vector regression (LSSVR) method. For comparison, three additional LSSVR models, namely, only with sample selection, only with improved color vector angle, without sample selection or improved color vector angle, were developed. In addition, two exponential models, namely, with sample selection, without sample selection, were developed. Experimental results indicate that the proposed method is more effective for improving the copper content estimation accuracy, particularly when the sample size is small.
Trans. Nonferrous Met. Soc. China 24(2014) 2665-2676
Hong-wei ZHANG1, Zhi-qiang GE1, Xiao-feng YUAN1, Zhi-huan SONG1, Ling-jian YE1,2
1. State Key Laboratory of Industrial Control Technology, Institute of Industrial Process Control, Zhejiang University, Hangzhou 310027, China;
2. Ningbo Institute of Technology, Zhejiang University, Ningbo 315100, China
Received 8 July 2013; accepted 30 September 2013
Abstract: A vision-based color analysis system was developed for rapid estimation of copper content in the secondary copper smelting process. Firstly, cross section images of secondary copper samples were captured by the designed vision system. After the preprocessing and segmenting procedures, the images were selected according to their grayscale standard deviations of pixels and percentages of edge pixels in the luminance component. The selected images were then used to extract the information of the improved color vector angles, from which the copper content estimation model was developed based on the least squares support vector regression (LSSVR) method. For comparison, three additional LSSVR models, namely, only with sample selection, only with improved color vector angle, without sample selection or improved color vector angle, were developed. In addition, two exponential models, namely, with sample selection, without sample selection, were developed. Experimental results indicate that the proposed method is more effective for improving the copper content estimation accuracy, particularly when the sample size is small.
Key words: secondary copper; copper content estimation; sample selection; color vector angle; least squares support vector regression
1 Introduction
Copper recovery from wastes is more economically appealing than copper production from primary sources [1]. Reusing waste copper not only reduces the cost of production, but also saves the natural resources and energy of the earth from a big stand of view. Therefore, the interest in copper recycling technologies has been steadily increasing in recent years [2-8]. The final product of copper recovery process is usually called secondary copper in smelting industry. However, measuring the content of the secondary copper mainly relies on the expensive spectrograph through an off-line manner, which may introduce a significant measurement delay. In this delayed period, the melting process will not stop keeping the molten copper at a specified temperature range until the desired measurement result of copper content is reported. Therefore, much energy is wasted in this period. In addition, spectrograph machines may not work well in a dusty on-site condition with high temperature, which may introduce extra difficulties for measuring copper content. Overall, much fuel and energy have been wasted in traditional spectrograph approach. To overcome these problems, a rapid copper content measurement system is highly desired.
Like other quality monitoring problems [9], a key step of constructing an in-situ copper content measurement system is to select fast, reliable, and low-cost sensors. With the development of digital image acquisition and processing methods, vision-based techniques have become more and more popular [10-14]. The idea of implementing rapid secondary copper content measurement using the vision-based system is innovated for several reasons. Firstly, The vision-based system has been successfully adopted for copper quality estimation [15], as well as in other industrial applications [16-18]. Secondly, the copper content prediction at the smelting location (in-situ) is usually estimated by skilled workers based on their accumulated experiences. The human experts make judgments on the copper product contents with their direct visual observations. Therefore, it is possible to use a vision system to estimate the copper content.
Previously, OESTREICH et al [12] demonstrated the use of color features for real-time mineral quality estimation. Recently, color features have been used in quality evaluation for fruits [10] , beef [19] and other foods. KIM et al [15] suggested that the hue intensity may reflect the composition difference of Zn, Sn or Al in the Cu binary alloys. An exponential equation model was used for composition estimation of Cu-Zn, Cu-Sn and Cu-Al alloys by measuring the average hue intensity. However, defects on the surface of a copper sample may affect the average values of hue intensity, which may result in a significant error of the quality estimation model. Therefore, a sample selection strategy by defect detection can be used to improve the accuracy of the estimation model. Besides, since the composition of secondary copper is more complex than ideal Cu binary alloys, the exponential equation model may not function well to model the relationship between color feature and copper content of secondary copper.
In the present work, we develop a copper content estimation model based on color analysis, where the development of the copper content estimation model is treated as a supervised regression problem. Firstly, mean filtering is employed to remove noise and the region of interest (ROI) method is applied to segmenting copper images from the background. Secondly, the Canny edge detection technique is combined with luminance standard deviation for detecting the defects and selecting appropriate modeling sample images, followed by the extraction of improved color vector angle. Finally, a LSSVR model is developed to correlate the copper contents and the extracted color vector angles.
2 Vision-based system
The proposed vision-based system consists of two main parts: the hardware and the software. The hardware is an image acquisition system, which captures images of copper samples in the smelting process and transmits the images to the computer. The software is specially developed to analyze the captured copper images and estimate the copper content of the testing secondary copper samples. The vision-based copper content estimation system has been established both in the lab and in-situ. The major tasks performed by the system are shown in Fig. 1, which are copper image acquisition, defect detection, color feature extraction and copper content estimation.
2.1 System hardware
The image acquisition system consists of a color assessment cabinet with D65 light sources, a 3CCD color camera and an industrial computer. The cabinet is applied to keeping dust away and providing a constant lighting condition. D65 (PHILIPS TLD 18W/965) is a kind of artificial daylights acknowledged by CIE, whose color temperature is 6500 K. An industrial 3CCD progressive scan RGB color camera (JAI, model CV-M9GE 3×1/3′′, 1024×768 active pixels) mounted with a 15 mm lens (FUJINON, model TF15DA-8) is applied to capturing the images of secondary copper samples. The copper images are transmitted from the camera to the industrial computer through Gigabit Ethernet. Compared with a traditional single CCD color camera, the 3CCD color camera is more precise and reliable, which could capture more accurate color information from the secondary copper samples. In addition, the copper samples are fixed by a sample holder to ensure that every image has the same shooting angle and the illumination angle shown in Fig. 2. Especially, the shooting angle is adjusted to reduce the effects of reflection and ensure that the image defect is not derived from the illumination. The photograph details of the proposed vision system are presented in Fig. 2.
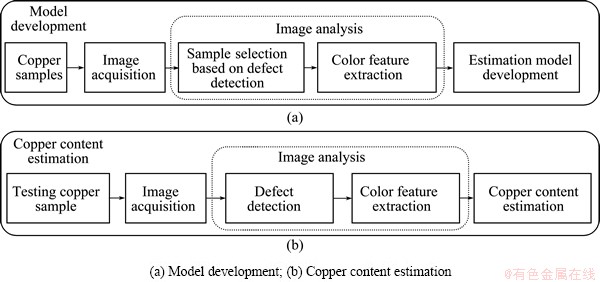
Fig. 1 Schematic diagram of copper content estimation system
2.2 System software
The developed software consists of two main parts: a user interactive interface and a copper content estimation program. The user interface is written by LabVIEW 2011, which can be used to modify the parameters of both the 3CCD color digital camera and the copper content estimation model, as shown in the right part of Fig. 2.
The copper content estimation program is written by MATLAB 2011b, which is used to extract color features and uses the color features to estimate copper content of a secondary copper sample. To improve estimation accuracy, a sample selection strategy of copper images is adopted before color feature extraction. As shown in Fig. 3, the interaction interface is intuitive and easy to operate. The details of the image analysis algorithm mentioned above will be elaborated in Section 3 shortly.
2.3 Secondary copper samples
The secondary copper samples used in this study were collected from Ningbo Jintian Copper (Group) Co., Ltd in China, some of which are shown in Fig. 4. Because the cross section area of the copper sample is rarely affected by the effect of oxidation, it is used for image acquisition and image analysis.
3 Image processing and feature extraction
3.1 Preprocessing and image segmentation
The secondary copper samples were collected from practical products of the industry, so the stochastic noise and defects in the copper image are ineluctable. Therefore, the copper images should be preprocessed before color feature extraction to make sure that the correct image features can be extracted.
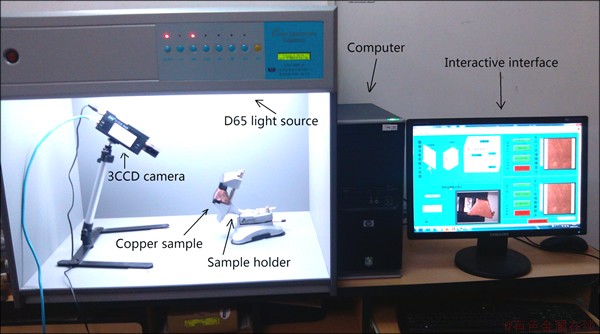
Fig. 2 Photograph of vision-based copper content estimation system
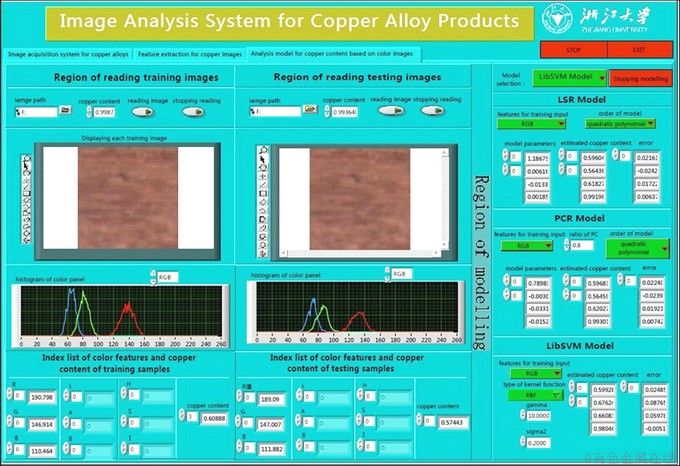
Fig. 3 Details of interaction interface
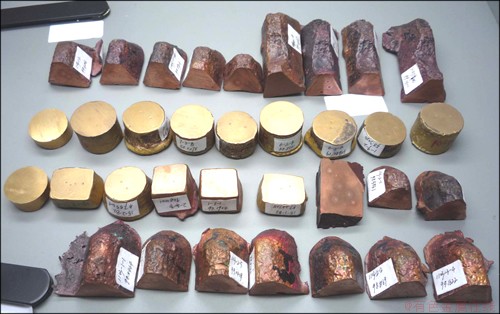
Fig. 4 Photograph of secondary copper samples
To smooth the images, median filtering method is applied to removing the noise in the images. Furthermore, since the background information cannot be used for copper content estimation, the copper sample region must be identified and segmented from the whole image before color feature extraction. There are many traditional image segmenting methods, such as edge-based methods and area-based methods, which have been applied in many applications. However, none of these techniques could solve image segmentation problems in all applications. Recently, machine learning technique has been successfully applied to the image segmentation problems. However, machine learning methods are too complicated and time-consuming, although they are generally better than traditional image segmentation methods.
In this work, the region of interest (ROI) method will be used. Different from aforementioned methods, ROI is a fast image segmentation method because it just sets coordinates of the interested region. ROI method is especially suitable to segment the objects with certain and constant location in the images. Because the locations of the camera and the sample holder are fixed in the color assessment cabinet, the region coordinates of the copper samples are constant in every captured copper image. Therefore, the ROI method can ensure the segmentation is absolutely correct because the region is selected by users. In addition, ROI method is simple to implement and can greatly improve the computing speed. Based on the above reasons, the ROI method is adopted to segmenting the cross section area from the original copper image in the present work.
The ROI method is performed by simply setting the coordinates of a rectangular region in the captured image. As shown in Fig. 5(b), the region labeled by a white rectangular (160×160) is the region of interest (ROI) in the cross section, which is a subset of the original image (1024×768). Figure 5(c) shows the ROI image segmented from Fig. 5(b).
3.2 Defect detection for sample selection
Data selection is an important issue because it determines which key information will be used in later steps. Poor results are generally obtained if the collected data are used without any selection. Due to the factors from both cutting tools and environmental conditions, some obvious defects such as scratches and speckles may appear in the cross section of copper sample occasionally. The defects might introduce incorrect color information, thus resulting in unwanted effects on the copper images. If an image with defect could be eliminated before model development, it will be helpful to ensuring the reliability of the developed model. Two typical defects in copper images can be seen in Fig. 6.
The goal of the defect detection is to select copper samples for further color feature extraction as quickly as possible. Therefore, the rapidity is also important for defect detection algorithm. There are many image defect detection methods: gray level co-occurrence matrices (GLCM), texture based methods, wavelets and so forth. These methods could be largely classified into three main approaches: statistical, structural and transform- based methods. Regarding the statistical methods, the simplest feature is the first-order statistic related to the intensity levels histogram such as mean and median. However, the first-order statistic does not give any insights into the possible defect differences in an image, because they do not extract any information about the correlation of their intensities. When the intensity distribution has to be characterized, the second-order statistic is more suitable. Probably, the most well-known second-order statistic in image analysis is the GLCM method. But GLCM is not suitable here because the problem of the image rotation cannot be solved. Though wavelets method has been successfully applied to image defect detection, they are too complicated and time- consuming. Recently, texture based methods, especially those using local binary patterns (LBP) have been employed in many image classification system. LBP method was proposed by OJALA et al [20] and has been extensively explored by many other researchers [21]. But this method still cannot be used in this application because it is time-consuming.
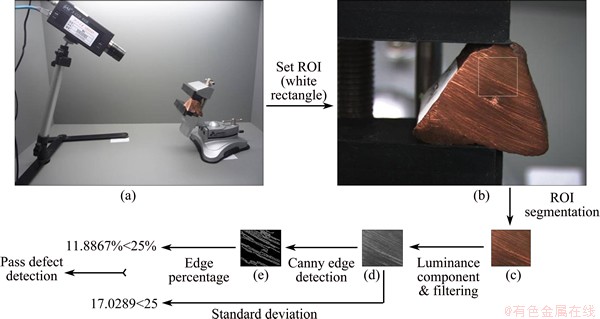
Fig. 5 Schematic diagram of preprocessing, segmentation and samples selection algorithm
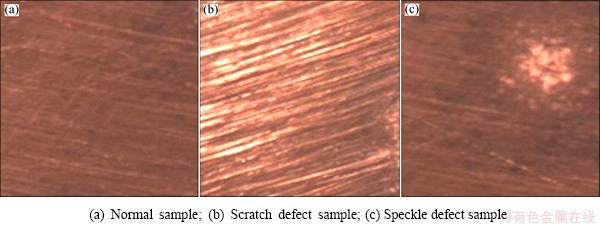
Fig. 6 Comparison of a normal sample and two representative defect samples
Considering the rapidity of the defect detection, Canny edge operator is a good choice, which has been successfully applied to surface quality detection for many years. This method is suitable for scratch defects, but fails for speckle defect detection. The standard deviation, as another second-order statistic, is quick and accurate for speckle defect, but is inaccurate for scratch defect detection. Therefore, these techniques cannot be directly applied to detecting speckle defects and scratch defects. The definitions and the mathematical equations of these defect detection techniques can be found in details in the previous works [19,20,22].
This work proposed a novel method to detect scratch defects and speckle defects, which combined pixels standard deviation and Canny edge detection. The proposed method could detect scratch defects and speckle defects based on Canny edge detection and standard deviation of pixel grayscale values, respectively. The method is simple yet rapid and accurate. Because scratch defects and speckle defects are reflected by the difference of luminance in the surface, the luminance components of captured color images are extracted before defect detection. Figure 7 shows the flow chart of the proposed algorithm for defect detection.
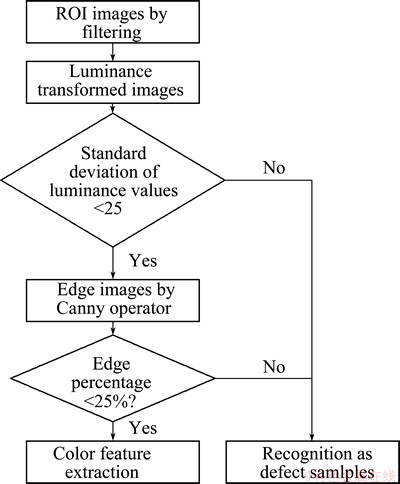
Fig. 7 Flow chart of algorithm for defect detection
Firstly, since the scratch defects look like many edges in the smooth cross section, the percentage of edge pixels is used to quantify the amount of scratch defects. Those copper samples with percentage of edge pixels more than specified threshold (25%) will be eliminated from the training data because they introduce too much noise to copper images. The Canny operator will be used to detect the edges in a grayscale image, in which two thresholds are used to detect strong and weak edges. It includes the weak edges in the output only if they are connected to strong edges. As a result, the method is more robust considering noise, and more likely to detect true weak edges. In this work, Canny method is used to detect edges in the luminance component of the captured color copper images. Since luminance values of the speckle area are different from the smooth area, luminance component is also applied to calculating the standard deviation after the image is transformed from RGB color space to L×a×b color space. Luminance image could be calculated by the following equations:


where Y0 is 0.329, corresponding to the reference white point parameter in CIE D65 light sources. After the edge images are transformed from the luminance images according to the equation, the speckle defects could be easily detected based on the standard deviation of the luminance component image. Then the percentage of edge pixels, η, is calculated by the following equation:

where nedge and nall are the number of edge pixels and the total number of pixels in an edge image, respectively.
Finally, copper images with luminance standard deviation less than 25 and percentage of edge pixels less than 25% (threshold) could pass the samples selection, which could be used for further color feature extraction.
3.3 Color feature extraction
Depending upon the properties of copper, the copper samples exhibit different colors. Therefore, color is an important indicator for content estimation. Currently, skilled workers estimate the copper content of the secondary copper products in-situ, here, the mathematical regression or classification model is to be developed for content estimation. Color information can be represented by color histograms, RGB, hue- saturation-intensity (HSI), CIE L×a×b, color vector angle and so forth. Each color space interprets and models color in a particular way. No single-color space is panacea for all industrial applications. The HSI and CIE L×a×b color spaces are usually applied for color analysis where only two components exist in the color space. In particular, the hue intensity has been successfully applied to copper content estimation for copper binary alloys [15]. However, the color information in saturation component is not used for model development without some detailed interpretations, which makes it difficult to decide which color component could be used for color extraction. The color vector angle (CVA) has been used in commercial television broadcasting to calibrate color video cameras. A critical concern is that it uses one component to qualify color information, which is suitable for the rapid computing. Moreover, the color vector angle (θ) has been proven to be an excellent measure of the subtle color changes resulting from differences in mineral concentrations. The traditional color vector angle can be calculated using the equations below [12]:


where R', G', B' represent the pixel grayscale values of each R'G'B' triplet, respectively.
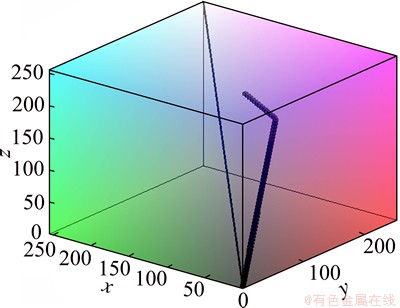
Fig. 8 Color distribution of standard copper map in color cube
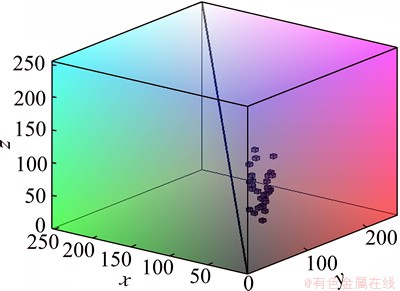
Fig. 9 Color distribution of secondary copper samples in color cube
Our investigations have led us to conclude that every color quantization must be adjusted for a practical application. Figure 8 shows the color distribution (the little cubes) of standard copper map in MATLAB, which represents the common copper color. As we can see from the color distribution, the common copper color is not symmetric around the central black line, resulting in the similar traditional color vector angle of the common copper colors. Because the traditional color vector angle is a vector angle in the color cube starting from the viewpoint (0, 0, 0), if the viewpoint could be transformed properly, the color vector angles of copper colors may be more distinguishable from each other. As can be observed from Fig. 9, the real copper colors are also not symmetric a little around the central black line, which will lead it to be difficult to be distinguished from traditional color vector angles of secondary copper colors. Therefore, we propose a transformed color vector angle to distinguish the slight color differences of copper sample colors, which is formulated as follows:


The offset values in Eqs. (7) and (8) are got by repeating trials and tests. Transformed by Eqs. (7-9), the colors of the secondary copper samples are symmetric around transformed center line. For intuitive comparisons, both the traditional color vector angle and transformed color vector angle are used to quantify the color of the copper color map in MATLAB as shown in Fig. 10. As can be seen from the figures, the improved color vector angles have better ability to measure the subtle color changes than traditional color vector.
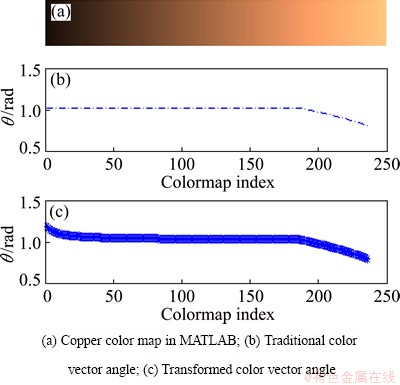
Fig. 10 Comparison of traditional and transformed color vector angle
The 3CCD digital camera outputs the RGB color signals for each pixel, which is digitized into an eight-bit value between 0 and 255. Considering the good color consistency in the selected copper image, the improved color vector angle of the pixels in the image will be represented by averaged color vector angle of the segmented copper image. Then the copper content could be estimated by comparing the averaged color vector angle to the developed copper content estimation model.
4 Copper content estimation model
In this section, the copper content estimation model is to be developed. A wide variety of strategies have been proposed in literatures to develop the regression estimation model depending on the level of a priori knowledge of the process. There are two main strategies to build an estimation model: mechanistic modeling and machine learning modeling such as neural networks, support vector machine (SVM) and hybrid methods. Due to the complicated nonlinear relation between the color feature and copper content of the secondary copper, it is difficult to build an accurate mechanistic model.
Recently, an exponential function model was proposed by KIM et al [15] for composition estimation of Cu-Zn, Cu-Sn and Cu-Al alloys. The exponential model can be formulated as follows:

where x is the composition, y is the hue intensity, y0 is the offset, A is the amplitude and t is a damping constant. For convenience, the exponential model is usually transformed to an equivalent logarithm formula, whose dependent variable is the composition. Through transformation, the logarithmic copper content estimation model is formulated as follows:

where x is the hue intensity, y is the content, x0 represents the offset, A is the amplitude and t represents the damping constant.
However, the secondary copper is different from ideal Cu binary alloys because copper has more complicated compositions. The exponential model may not work well for copper content estimation of the secondary copper. For comparison purpose, the exponential model will be used in following experiments.
In the catalog of machine learning modeling, neural networks, support vector regression (SVR) and LSSVR are usually used in practice. From a theoretical view, SVR and LSSVR are expected to perform better than neural networks, especially when the sample size is small. In our situation, the number of samples obtained from the Jintian Copper Group is limited due to their strict limits and regulations of material management. Therefore, the small sample size problem must be concerned for the model structure selection. Generally, we handle this problem with SVM and LSSVM.
SVR is a powerful tool for small size sample learning, which was developed based on sophisticated risk theory [22]. Due to its theoretical foundations, SVR exhibits better generalization performance and can work well under limited training data samples, which is in the exact situation in the study [23]. This is because the number of collected secondary copper samples is limited due to the strict material management rule of Ningbo Jintian Copper (group) Co., Ltd. However, the modeling efficiency of SVR is not very competitive since it requires a quadratic programming optimization. The efficiency of SVR can be greatly improved by LSSVR because the complex optimization step is avoided, instead, only a series of linear equations should be solved [24]. In this work, the LSSVR model is used to model the relationship between copper contents and color vector angles.
Given the training data sample (xi, yi)i=1,…,n, where n is the size of sample, xi (i=1, …, n) are color vector angles as the input, and yi (i=1, …, n) are the available corresponding copper content values as the output. Given regression function y(x)=wTφ(x)+b, where w is the factor vector, b is the error vector.
The regression problem is expressed as

Subjected to equality constraints, it yields

where ei (i=1, …, n) are the random errors, C is the parameter of standardization and wTw is used to control the model complexity. To solve the optimization problem, Lagrange function and Lagrange multipliers αi are introduced as follows:


Solving the Karush-Kuhn-Tucker (KKT) optimization condition, the result of Eq. (13) could be transferred to a series of linear equations. According to Mercer’s theorem, the resulting LSSVR model could be formulated as

where αi (i=1, …, n) are the coefficients corresponding to each training data,  is the estimation function of the LSSVM model and K(xi, x) is the Kernel function which satisfies Mercer condition. There are a lot of Kernel functions, such as the linear function, the polynomial function, the radial basic function and the multi-layer perception function. In this research, the radial basic function
  is adopted. Once the LSSVR model is developed, each testing secondary copper sample could be estimated for copper content. For a new color vector angle data sample xnew, the estimated output variable of LSSVR could be calculated as:

The training and testing process of the LSSVR-based copper content estimation model can be seen in Figs. 11(a) and (b), respectively.
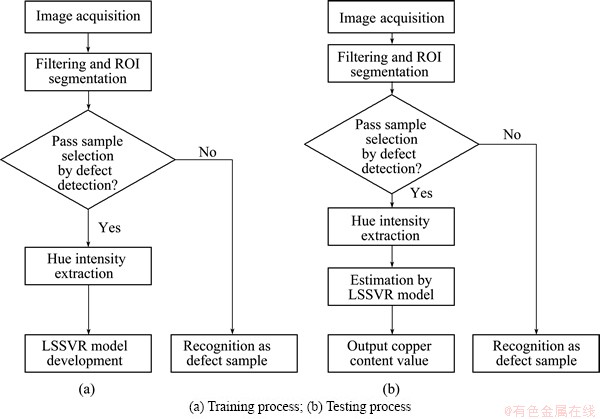
Fig. 11 Training and testing flowchart of LSSVR model
5 Experiments and discussion
In this section, an experiment is provided to test the performance of the vision-based copper content estimation system. The rapidity and accuracy of the proposed copper content estimation model are evaluated in the experiments, which verify the proposed sample selection strategy and LSSVR model structure. At the same time, the LSSVR models without sample selection strategy, the exponential model with sample selection strategy and the exponential model without sample selection strategy are also compared in the experiments. Precisely, rapidity is evaluated by training time of the developed models. The estimation accuracy is evaluated by the root mean square error (RMSE), which is defined as follows:

where ntest is the number of testing image samples, yi and  are real and estimation values, respectively.
In addition, the recognition accuracy of defect samples (ADSR) is also calculated by Eq. (18) to evaluate the ability of defect detection:

where nr is the number of samples with defects recognized by samples selection strategy; ndefect represents the number of samples with defects in practice. The MATLAB software was used for model analysis in the experiment, and the configuration of the computer is listed as follows: OS: Windows 7(32 bit); CPU: Intel Core i3-2350M; RAM: 4 GB; MATLAB version: 2011b.
5.1 Samples preparation
There are 64 representative secondary copper samples in the experiment, which were collected from Ningbo Jintian Copper (group) Co., Ltd, China. The copper images were captured by the image acquisition system, which is mentioned in Section 2.1. For comparison of the estimation accuracy with spectrograph in the off-line manner, copper contents of all samples were measured in advance by a spectrograph in the laboratory.
In this experiment, 32 copper images (image 1-32) were randomly selected as the training date, while the other 32 images (image 33-64) were selected as the testing data, which were used to test the estimation accuracy and rapidity of the developed models.
5.2 Preprocessing and sample selection by defect detection
Before defect detection, the preprocessing was necessary to remove the noise in the captured copper images. A 3×3 median filter was applied in the experiment. Besides, the ROI segmentation technique was used to segment the copper region from the background.
The defect was analyzed in the luminance component of the segmented images according to the procedure presented in Section 3.2. Firstly, the luminance components of the segmented images were transformed from RGB color space using Eqs. (1) and (2). The standard deviations of luminance images could be easily calculated. Then those images whose standard deviation values were less than 25 were selected for Canny edge detection. The threshold values of a Canny operator usually affect the edge detection result, but there is no unified threshold selection method. Generally, the thresholds are selected according to the accurate edge detection result. Through trail and error, the low threshold and high threshold of the Canny operator are set to be 0 and 0.43, respectively. The percentages of edge pixels in the edge image were calculated using Eq. (3). Finally, the images whose percentage is lower than 25% were used to develop the copper content estimation model.
For 64 segmented copper images (images 1-64), the time and recognition accuracy of the above defect detection method are listed in Table 1. Besides, the time and recognition accuracy of LBP method for 64 images are also listed in Table 1 for comparisons. The rotation-invariant-uniform pattern  is used in the experiment, whose parameter P and parameter R are 16 and 2, respectively. As can be observed in Table 1, the proposed defect detection method has the same accuracy as LBP method; however, the rapidity performance is much better (1.8722 s compared to 23.6498 s). Therefore, the proposed defect detection method is more suitable for sample selection due to its rapidity and accuracy.
Table 1 Comparison of LBP method and proposed defect detection method
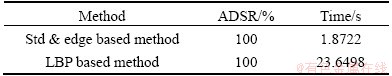
Figure 12 shows the luminance standard deviations and edge percentages of all copper images. As can be seen in Fig. 12, the symbol ‘*’ and the symbol ‘o’ represent the calculated luminance standard deviations and edge percentage values, respectively. The straight lines represent the defect detection thresholds. If the luminance standard deviation exceeds 25 or the edge percentage exceeds 25%, the corresponding copper image will be recognized as defect sample. It could be observed from Fig.12 that there are four detect samples in the training data and one defect sample in the testing data. Therefore, the samples without defects can be selected to develop the proposed copper estimation models.
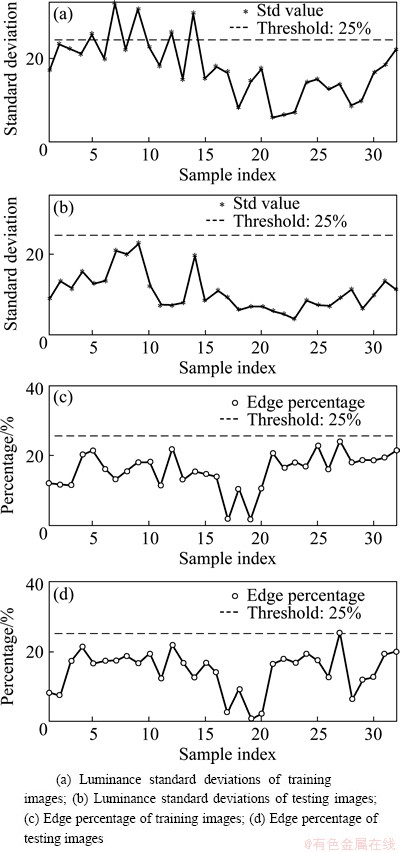
Fig. 12 Luminance standard deviations and edge percentage of all samples
5.3 Color feature extraction and copper content estimation model development
After defect detection, the transformed color vector angle is extracted from the selected image using Eqs. (7) and (8). In addition, the hue intensity proposed by KIM et al [15] and the traditional color vector angle are also extracted.
Six copper content estimation models are developed for comparison purpose. Model 1 is the proposed LSSVR model with sample selection strategy and transformed color vector angle. Model 2 is the LSSVR model with only the sample selection strategy. Model 3 is the LSSVR model with only the transformed color vector angle. Model 4 is the LSSVR model without sample selection strategy and the transformed color vector angle. Model 5 is the hue-based logarithm model with sample selection strategy. Model 6 is the original exponential model proposed by KIM et al [15].
The LSSVR models are trained in a supervised learning manner based on the color vector angle data and the corresponding copper content data. Thus, several parameters of model should be determined first. There are also many parameter optimization methods to improve the estimation ability of LSSVR models. However, parameter selection for LSSVR models is not the scope of this article. For comparison, the proposed LSSVR model and other three LSSVR models use the same parameters, so local optimal parameters is enough and can be selected by repeating experiment. In this experiment, the parameter C and the Kernel width parameters σ of LSSVR model described in Section 4 are randomly chosen as 10 and 0.2, respectively. For exponential models, the parameters x0, A and t are recognized by the nonlinear least squares method.
It could be obviously observed from Fig. 13 that the estimation results of the LSSVR model with sample selection strategy and transformed color vector angle are in good agreement with the results given by the spectrograph analysis. In addition, the detailed testing results of six models are listed in Table 2.
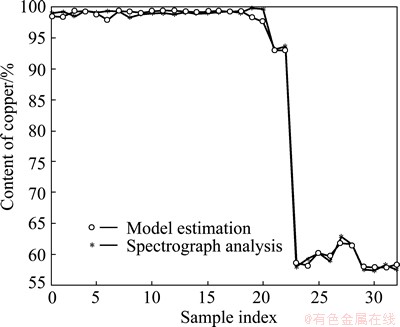
Fig. 13 Estimation result of Model 1
Table 2 Results comparison of six models with different algorithms
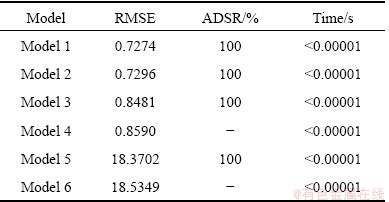
As can be seen from the test results in Table 2, Model 1 is the best model according to the criterion of RMSE, ADSR and rapidity. It indicates that the LSSVR model combined with the sample selection strategy and the transformed color vector angle can effectively estimate copper contents for secondary copper samples. From the view of RMSE, Models 1-4 have smaller estimation errors than Models 5-6. It demonstrates that the LSSVR models are more suitable than logarithm models for copper content estimation. Because LSSVR models have better generalization ability than logarithm models, LSSVR models can estimate the copper content more accurately. In addition, color vector angle is an more excellent measure of the subtle color changes resulting from differences in the secondary copper. Therefore, the proposed model has smaller estimation error than the hue-based logarithm model used for Cu binary alloys.
Moreover, the RMSE of Model 1 is smaller than that of Model 2 or Model 3. It indicates that the combination of the sample selection strategy and the transformed color vector angle is better than the individual improvement in sample selection or color vector angle. Furthermore, both Model 2 and Model 3 are better than Model 4. It indicates that both sample selection strategy and transformed color vector angle can improve the copper content estimation accuracy. The RMSE of Model 5 is slightly smaller than that of Model 6. It indicates that the samples selection strategy is also helpful to improving the estimation accuracy of the hue-based exponential model.
Considering ADSR for testing images, Model 1 and Model 2 are able to recognize defect samples in testing data. Therefore, the estimation accuracy of Model 1 or Model 2 is smaller than that of Model 3 or Model 4 because incorrect data had been eliminated accurately by the proposed samples selection strategy.
Considering the rapidity criterion, all the copper content estimation models are time-effective compared to the time delay caused by spectrograph in off-line manner which is usually more than 30 min. It indicates that the vision-based copper content estimation system is more rapid than the traditional spectrograph analysis.
Above all, the LSSVR model with samples selection strategy and transformed color vector angle is the most suitable method for copper content estimation, compared with other five models in the experiment. In addition, it is concluded that the proposed model can estimate the copper content for not only the secondary copper but also Cu binary alloys because the proposed model is flexible data-driven model.
6 Conclusions
In this study, a vision-based copper content estimation system has been proposed for rapid copper content estimation in secondary copper smelting industry. The LSSVR model is developed by using copper images and available copper content data. The images are captured from the cross-section area of copper samples in a color assessment cabinet. To improve the estimation rapidity, the ROI copper images are segmented from the original images and improved color vector angle is used to extract the color feature. To improve estimation accuracy, the training samples are selected by sample selection strategy. Then the transformed color vector angles are extracted from the copper images. Finally, the LSSVR model is developed by the color vector angles of selected images and available content values. The experiments and comparative study demonstrate that the proposed model is more suitable for copper content estimation than other five methods.
References
[1] AGRAWAL A, SAHU K K. Problems, prospects and current trends of copper recycling in India: An overview [J]. Resour Conserv Recycl, 2010, 54(7): 401-416.
[2] TUNCUK A, STAZI V, AKCIL A, YAZICI E Y, DEUECI H. Aqueous metal recovery techniques from e-scrap: Hydrometallurgy in recycling [J]. Minerals Engineering, 2012, 25(1): 28-37.
[3] HAQUE M M, KIM H, KONG M S, HONG H S, KIM K S, LEE C S. Recycling copper from waste copper wire using an applied voltage [J]. Int J Precis Eng Manuf, 2012, 13(7): 1251-1254.
[4] KASPER A C, BERSELLI G B T, FREITAS B D, TENORIO J A S, BERNARDZS A M, VEIT H M. Printed wiring boards for mobile phones: Characterization and recycling of copper [J]. Waste Manage, 2011, 31(12): 2536-2545.
[5] HOANG L L, JEONG J, LEE J C, PANDEY B D, YOO J M, TRUNG H H. Hydrometallurgical process for copper recovery from waste printed circuit boards (PCBs) [J]. Miner Process Extr Metall Rev, 2011, 32(2): 90-104.
[6] SETHU V S, AZIZ A R, AROUA M K. Recovery and reutilisation of copper from metal hydroxide sludges [J]. Clean Technol Environ Policy, 2008, 10(2): 131-136.
[7] REDDY R G, PRABHU V L, MANTHA D. Recovery of copper from copper blast furnace slag [J]. Miner Metall Process, 2006, 23(2): 97-103.
[8] YUE Q, WANG H M, LU Z W. Quantitative estimation of social stock for metals Al and Cu in China [J]. Transactions of Nonferrous Metals Society of China, 2012, 22(7): 1744-1752.
[9] CHATTERJEE S, BHATTACHERJEE A. Genetic algorithms for feature selection of image analysis-based quality monitoring model: An application to an iron mine [J]. Eng Appl Artif Intell, 2011, 24(5): 786-795.
[10] LEE D J, ARCHIBALD J K, XIONG G M. Rapid color grading for fruit quality evaluation using direct color mapping [J]. IEEE Trans Autom Sci Eng, 2011, 8(2): 292-302.
[11] SZATVANYI G, DUCHESNE C, BARTOLACCI G. Multivariate image analysis of flames for product quality and combustion control in rotary kilns [J]. Ind Eng Chem Res, 2006, 45(13): 4706-4715.
[12] OESTREICH J M, TOLLEY W K, RICE D A. The development of a color sensor system to measure mineral compositions [J]. Minerals Engineering, 1995, 8(1-2): 31-39.
[13] YU X J, LIU K S, HE Y, WU D. Color and texture classification of green tea using least squares support vector machine (LSSVM) [M]// Components, Packaging and Manufacturing Technology. Stafa-Zurich: Trans Tech Publications Ltd, 2011: 774-779.
[14] LLORCA D F, PARRA I, SOTELO M A, LACE Y G. A vision-based system for automatic hand washing quality assessment [J]. Mach Vis Appl, 2011, 22(2): 219-234.
[15] KIM C W, KIM H G, SUK H G. A study on the composition determination of Cu alloys by image processing technology [J]. Solid State Phenomena, 2006, 116-117: 795-798.
[16] FACCO P, MASIERO A, BEZZO F, BAROLO M, BEGHI A. Improved multivariate image analysis for product quality monitoring [J]. Chemometrics Intell Lab Syst, 2011, 109(1): 42-50.
[17] ISHAK W I W, HUDZARI R M. Image based modeling for oil palm fruit maturity prediction [J]. J Food Agric Environ, 2010, 8(2): 469-476.
[18] JACKMAN P, SUN D W, DU C J, ALLEN P. Prediction of beef eating qualities from colour, marbling and wavelet surface texture features using homogenous carcass treatment [J]. Pattern Recognition, 2009, 42(5): 751-763.
[19] JACKMAN P, SUN D W, ALLEN P. Prediction of beef palatability from colour, marbling and surface texture features of longissimus dorsi [J]. Journal of Food Engineering, 2010, 96(1): 151-165.
[20] OJALA T, PIETIKAINEN M, MAENPAA T. Multiresolution gray-scale and rotation invariant texture classification with local binary patterns [J]. IEEE Transactions on Pattern Analysis and Machine Intelligence, 2002, 24(7): 971-987.
[21] NANNI L, BRAHNAM S, LUMINI A. Combining different local binary pattern variants to boost performance [J]. Expert Syst Appl, 2011, 38(5): 6209-6216.
[22] LI W C, TSAI D M. Wavelet-based defect detection in solar wafer images with inhomogeneous texture [J]. Pattern Recognition, 2012, 45(2): 742-756.
[23] CORTES C, VAPNIK V. Support-vector networks [J]. Mach Learn, 1995, 20(3): 273-97.
[24] SUYKENS J A K, van GESTEL T, de BRABANTER J, de MOOR B, VANDEWALLE J. Least squares support vector machines [M]. Singapore: World Scientific, 2002.
张宏伟1,葛志强1,袁小锋1,宋执环1,叶凌箭1,2
1. 浙江大学 工业过程控制研究所,工业控制国家重点实验室,杭州 310027;
2. 浙江大学 宁波理工学院,宁波 315100
摘 要:针对废杂铜再生熔炼过程中铜含量指标离线检测时滞大的问题,提出一个基于机器视觉的铜含量快速检测系统。首先,使用3CCD彩色相机获取再生铜样本的横截面图像。然后,利用图像亮度标准差和边缘像素百分比这两个特征筛选建模样本。改进了颜色向量角,并提取建模铜样本的颜色向量角。最后,利用改进的颜色向量角和实测铜含量数据建立一个基于最小二乘支持向量机的铜含量估计模型。为了对比,如下铜含量最小二乘支持向量回归模型也被建立: 1)仅使用样本筛选方法; 2) 仅改进颜色向量角;3) 不使用样本筛选方法和改进的颜色向量角。另外,还分别建立了使用样本筛选方法和不使用样本筛选方法的两个指数函数铜含量回归模型。实验结果表明,同时使用样本筛选方法和改进颜色向量角的最小二乘支持向量回归模型具有最高的估计准确度,尤其是当建模样本数目较少的时候。
关键词:再生铜;铜含量估计;样本筛选;颜色向量角;最小二乘支持向量回归
(Edited by Hua YANG)
Foundation item: Project (2011BAE23B05) supported by National Key Technology R&D Program of China; Project (61004134) supported by the National Natural Science Foundation of China; Project (LQ13F030007) supported by Zhejiang Provincial Natural Science Foundation of China
Corresponding author: Zhi-huan SONG; Tel: +86-571-87951442-8007; E-mail: zhsong@iipc.zju.edu.cn
DOI: 10.1016/S1003-6326(14)63397-5

