J. Cent. South Univ. (2017) 24: 2693-2704
DOI: https://doi.org/10.1007/s11771-017-3682-7

A method for extracting anomaly map of Au and As using combination of U-statistic and Euclidean distance methods in Susanvar district, Iran
Seyyed Saeed Ghannadpour1, Ardeshir Hezarkhani1, Mostafa Sharifzadeh2
1. Department of Mining & Metallurgical Engineering, Amirkabir University of Technology(Tehran Polytechnic), Tehran, Iran;
2. Department of Mining Engineering and Metallurgical Engineering, Western Australia School of Mine,Curtin University, Kalgoorlie, Western Australia, Australia
 Central South University Press and Springer-Verlag GmbH Germany, part of Springer Nature 2017
Abstract: Quantitative descriptions of geochemical patterns and providing geochemical anomaly map are important in applied geochemistry. Several statistical methodologies are presented in order to identify and separate geochemical anomalies. The U-statistic method is one of the most important structural methods and is a kind of weighted mean that surrounding points of samples are considered in U value determination. However, it is able to separate the different anomalies based on only one variable. The main aim of the presented study is development of this method in a multivariate mode. For this purpose, U-statistic method should be combined with a multivariate method which devotes a new value to each sample based on several variables. Therefore, at the first step, the optimum p is calculated in p-norm distance and then U-statistic method is applied on p-norm distance values of the samples because p-norm distance is calculated based on several variables. This method is a combination of efficient U-statistic method and p-norm distance and is used for the first time in this research. Results show that p-norm distance of p=2 (Euclidean distance) in the case of a fact that Au and As can be considered optimized p-norm distance with the lowest error. The samples indicated by the combination of these methods as anomalous are more regular, less dispersed and more accurate than using just the U-statistic or other nonstructural methods such as Mahalanobis distance. Also it was observed that the combination results are closely associated with the defined Au ore indication within the studied area. Finally, univariate and bivariate geochemical anomaly maps are provided for Au and As, which have been respectively prepared using U-statistic and its combination with Euclidean distance method.
Key words: mineral anomaly; Susanvar district; U-statistic method; Euclidean distance; bivariate anomaly map
1 Introduction
The Torud-Chah Shirin mountain range of Semnan Province is located in the eastern part of the Alborz mountain system, which crosses northern Iran for about 1800 km from the border with Afghanistan in the east to the Caucasus border in the northwest [1]. The Alborz belt merges in the northwest with another Tertiary calc-alkaline magmatic belt, the Urumieh-Dokhtar (UD) zone, which runs parallel to the NW-trending Zagros zone. KAZMIN et al [2] and ALAVI [3] attributed these two belts, ZAGROS and Alborz-UD, to two subduction zones. Recently, HASSANZADEH et al [4] suggested that the two belts were once a single arc, but separated by intra-arc extension that started in the late Eocene [5]. A regional geochemical survey in early 1990s by the Geological Survey of Iran covered 42000 km2 in north-central Iran, including the Torud-Chah Shirin range. This project found a number of precious-metal anomalies [6].
Some gold resources were reported in this region, and finding out the further study using statistical characteristics such as mean and variance of elements like Au, As and Ag from exploration drilling and surface sampling and their geochemical behavior is necessary for the separation of anomalous values from background, also determining prospective areas and providing multivariate anomaly maps. In addition to Au and As which are two main elements in epithermal systems (gold mineralization) with granodioritic host rock, Ag is also important element (as trace) for estimating the extent of a primary geochemical halo; even in some cases, Ag grade increases to the level of ore deposit cutoff grade.
Thus for separating anomalous values from background and for providing multivariate anomaly maps, geochemical behavior and statistical populations type should be specified first and then, mean and variance of them should be determined (refer to Refs. [7, 8]). Finally, anomalous values are separated from background. Suggested application by GHANNADPOUR and HEZARKHANI [9] can be used for identifying distribution type and normalizing.
Different statistical methods such as Sinclair��s method, Gap statistic, discriminant analysis, U-spatial statistics, fractal technique and fuzzy clustering have been presented and developed for separating and specifying anomalous ranges [10�C21]. These methods range from simple approaches (based on distributions of statistical parameters) to complicated ones (based on spatial structure of data). The latter include approaches which consider sampling point coordinates and their spatial relation in the estimation of anomalous areas. Hence, anomaly separation methods can be divided in two groups which include nonstructural and structural methods. The U-statistic method is one of the structural methods. The algorithm and idea of U-statistic method was first presented and used by CHENG et al [14]. This method is a moving averaging method that in each particular point, window dimensions for averaging are changed and also for each particular point, some of U-statistic values of that point are calculated using surrounding points. Thus the spatial relation of each point is considered completely. This method separates subpopulations and specifies anomalous areas based on the distribution model and statistical analysis of data [14, 20]. The only controlling factor of two error types of e1 and e2 (errors of separating anomaly from background) in this method is the number of samples [15]. Results are usually improved by increasing the number of samples.
Many studies [22�C24] have compared several nonstructural methods (for determining the threshold based on median and standard deviation, median absolute deviation (MAD), P.N product and Sinclair��s method) with the U-statistic method. Results show that nonstructural methods are inefficient in comparison with the U-statistic method and they are not effective. In another study, GHANNADPOUR and HEZARKHANI [20] introduced 3D U-statistic method and applied the same method for separating anomaly from background in the case of two test examples in the three-dimensional space. Moreover, GHANNADPOUR and HEZARKHANI [25] combined the U-statistic and the Mahalanobis distance method for comparing and separating anomaly from background in the case of Cu, Mo, Pb and Zn in Parkam district, Iran. U-statistic method has a good performance to separate the anomaly from background based on the results of these studies.
In current research, to use the U-statistic method in multivariate mode, to decrease the error of separating anomaly from background and to provide univariate and bivariate anomaly map of Au and As, U-statistic as one of the structural methods is applied on Euclidean distance values for separating anomaly from background in the case of data resulted from surface sampling in the Susanvar district, Iran.
2 Regional geology
Paleogene arc-related rocks represent the most voluminous igneous rocks in Iran. They form two belts (excluding the east Iranian Eocene zone): the NW-trending UD zone of central Iran and the Alborz magmatic belt of northern Iran. Similar age and lithologic sequence of the two belts suggest that the two likely formed as a single continental arc that was subsequently rifted apart [4]. Eocene magmatism produced calc-alkaline felsic to intermediate rocks in the arc, whereas Oligocene magmatism is characterized by mafic-alkaline compositions [4]. The Torud-Chah Shirin mountain range consists mainly of Paleogene igneous rocks. Peak magmatic activity was middle Eocene to possibly upper Eocene in age, and has been divided into three stages from the oldest to the youngest [1, 5]: 1) explosive volcanic activity represented by rhyolitic to rhyodacitic ash tuffs, and locally andesitic lava flows, with subordinate marls, tuffaceous marlstones and sandstones; 2) lava flows and pyroclastic rocks of andesite, trachyandesite, and basaltic andesite composition; and 3) subordinate dacitic-rhyodacitic rocks and hypabyssal intrusions. The structural patterns are controlled by two NE-trending strike slip faults, Anjilow in the north and Torud in the south. The Torud-Chah Shirin mountain range hosts many mineral showings and abandoned mines, particularly epithermal base-metal veins, such as those in the areas of Gandy, Abolhassani, Cheshmeh Hafez, Chalu, Chahmessi, and Pousideh. Other types of deposits include placer gold and an underground mine of turquoise at Baghu, skarn deposits, and Pb-Zn deposits in carbonates [1, 5].
3 Geology of Susanvar district
The Susanvar exploration district with the coordinates of 54��31��18��C54��34��14�� E and 35��16��49��C 35��19��51��N is situated at a distance of 550 km from the east of Tehran, in about 120 km from south of Damghan and in 7 km from north of the Moaleman area. It is located on the Torud-Chah Shirin mountain range (TCS) of Semnan Province. TCS mountain range is in the eastern part of the Alborz magmatic belt that crosses northern Iran for about 1800 km in length, from the border with Afghanistan in the east to the border with the Caucasus in the northwest [1, 5].
The oldest rock formation in the area is belonging to Silurian and in terms of mineralogy it consists of calcite, dolomite and serpentine and in terms of rock classification it includes green schist, mica-schist, tuff and shale.
The following rock formations are as Devonian- Carboniferous carbonate, dark gray and light marble Permian limestone, brownish gray dolomite and Triassic marble units as well as dark gray and black Jurassic metamorphic sandstone and shale, respectively.
Stratigraphic sequence has shown that regional metamorphism happened after lower Jurassic; hence, the age of metamorphism should be considered to be between lower Jurassic and Cretaceous.
Older sediments have been covered by upper Cretaceous rocks containing limestone, sandstone, sandy limestone, green shale and conglomerate. Geological map of Susanvar area is illustrated in Fig. 1
4 Study of data resulted from surface sampling in Susanvar
A rock sampling grid with square and rectangle cells having two sides of 50�C50, 50�C100, 100�C100 and 100�C200 m has been executed in the Susanvar exploration district. There were 603 samples collected and analyzed for major and trace element concentration by ICP-OES and ICP-MS at Amdel Mineral Laboratories, Adelaide, South Australia. Figure 2 shows the location of these samples as well as the lithology from which they were collected. The samples located in sediments (Fig. 2) were collected either from rock outcrops or from trenches having access to rock, and mostly shared the lithology of their adjacent igneous units.
In this section, results from chemical analysis are prepared to be processed first and then prospective areas are mapped using different processing methods. Table 1 shows the statistical parameters of elements (gold, silver and arsenic) before taking logarithm. Population distribution type is determined and normalizing is carried out using suggested application by GHANNADPOUR and HEZAEKHANI [9]. Finally, primary statistical parameters are calculated.
Through application of abovementioned method, the distribution types of gold, silver and arsenic are specified as lognormal and their statistical characteristics are presented in Table 2 (in confidence level of 95%).
4.1 Relative geochemical behavior of elements using K-means clustering
In this section, we will find just one element between As and Ag, which has a similar behavior with that of the gold. According to the criterion presented in studies of GHANNADPOUR and HEZAEKHANI [8] for determining the optimal k, clustering with k=3 for the specimens of Au with Ag and As grade attributes was selected. The central points of the k=3 classification and the regression line crossed from classes central points for Au�CAg and Au�CAs are represented in Fig. 3. As illustrated, As grade varies linear relative to Au grade values. The best regression was y=2.0649x+31.693 and the correlation coefficient was reported R2=0.9464. Whereas, the correlation coefficient between Au and Ag in linear mode was low and the regression line slop was negative.
According to Fig. 3, As was selected as a trace element for Au and both are used to provide univariate and bivariate prospective area map of Susanvar.
4.2 Assessment of threshold using Chi-square plot of Mahalanobis distance
The Mahalanobis distance is one of the multivariate nonstructural methods which devotes a new value to samples as a criterion of distance and also assess the threshold by Chi-square plot based on several variables (several elements) [26, 27]. Details and description of this method could be followed in the study of GHANNADPOUR and HEZARKHANI [25]. Mahalanobis distances have been calculated according to study of GHANNADPOUR and HEZARKHANI [25]. Plotting Chi-square of squared Mahalanobis distance is necessary to detect the anomalous values.
Chi-square plot of squared Mahalanobis distance is resulted as in Fig. 4. In this figure, the first discontinuity occurs at point 2.3. Therefore, samples with Mahalanobis distance more than 2.3 can be assumed as anomalous samples. Determined anomalous values for gold and arsenic using this method are shown in Fig. 5.
4.3 Assessment of threshold using U-statistic method
This method is introduced as a powerful method in separating an anomalous population from background and is a kind of moving averaging in which for each particular point, window dimensions in which moving window dimensions change in each particular point. Thus for each particular point, U-statistic values for that point are calculated from surrounding points. A distance criterion is determined first and then according to that, a particular weight is devoted to each sample and the weighted average value of points located in the search area for each sample is specified and dispersion of each point is calculated. Finally using Eq. (1), U value is determined as below [14, 15].
 (1)
(1)
where �� is mean and �� is standard deviation of all data; Ui(r) is a function of r, meaning that as r changes, different values of Ui are determined. For each r, a number of surrounding samples are used in calculating U value of unknown point. Hence, different U values are calculated for each unknown point that the greatest one is considered for that point as final U value [14, 15].
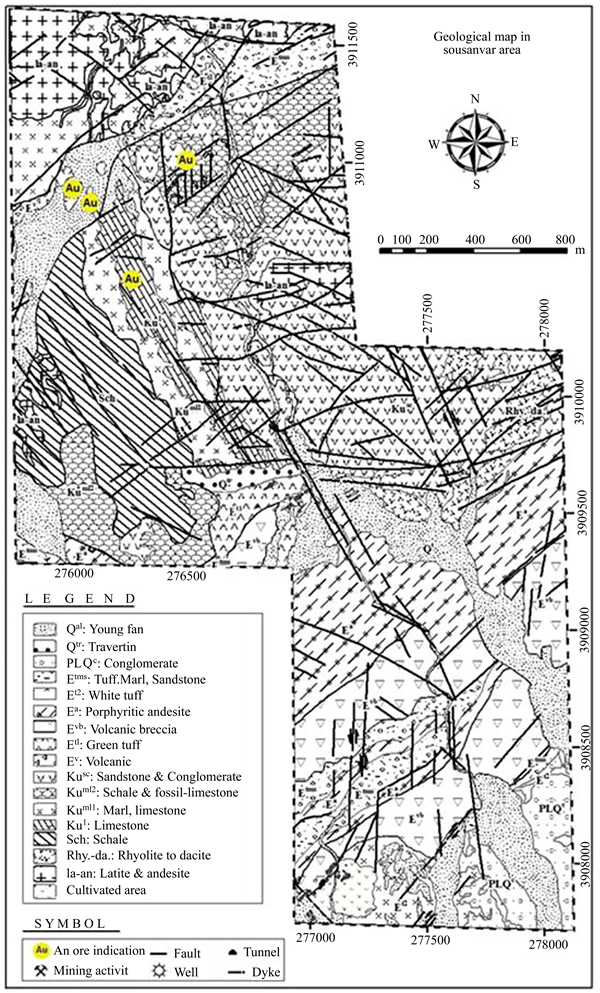
Fig. 1 Geologic map of Susanvar exploration district
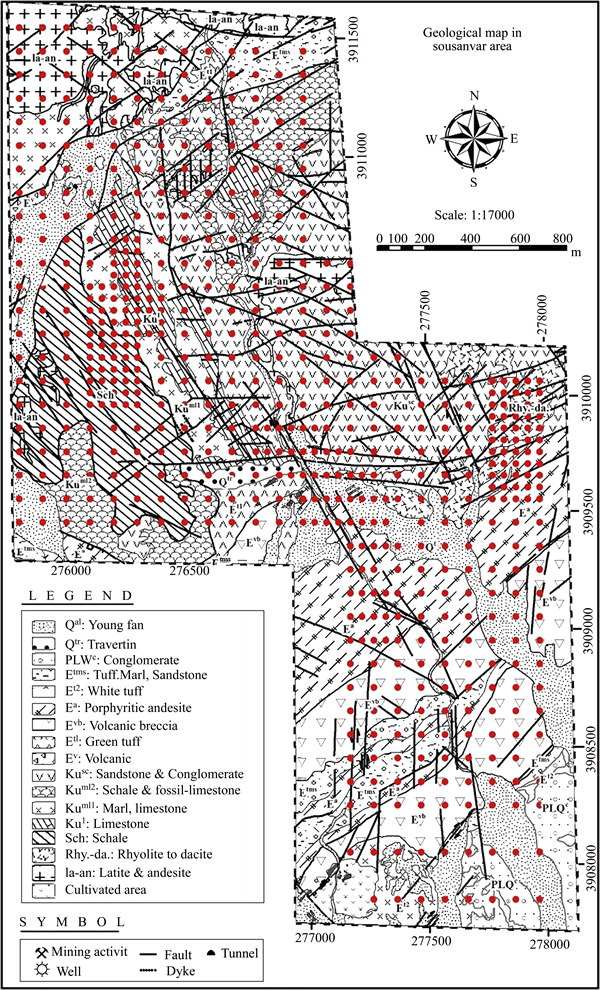
Fig. 2 Sampling points (spots) draped over geologic map in Fig. 1
Table 1 Statistical parameters of elements (original sample values)

Table 2 Statistical parameters of elements (logarithmic values)
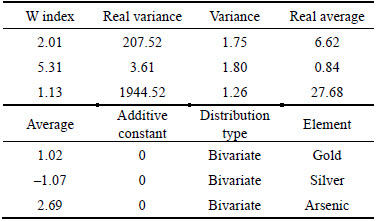
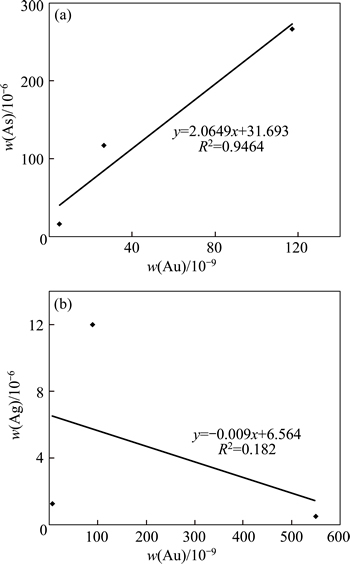
Fig. 3 Regression curve fitted to classes central points relating to Au and As (a) and Au and Ag (b)
Two types of errors are always associated with the classification [14]: type 1 (rejection error) occurs when a sample with a background value is rejected as background (e1=(the number of background samples that classified in anomalous population)/(the number of total samples)), and type 2 (acceptance error) when a sample with an anomalous value is accepted as a background (e2=(the number of anomalous samples that classified in background population)/(the number of total samples)).

Fig. 4 Chi-square plot of Au and As in Susanvar district
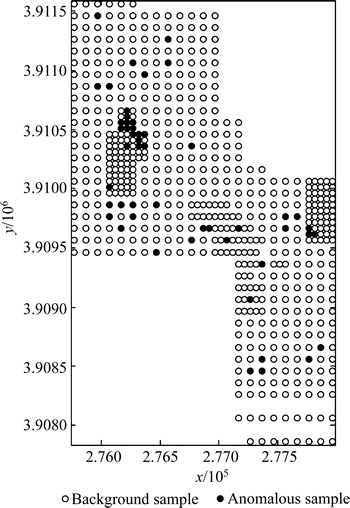
Fig. 5 Anomalies determined by considering variables of Au and As using Mahalanobis distance method (as a nonstructural method)
These two types of errors are negatively associated. If one type of error is made small by changing the threshold, the other will be large. Therefore, the sum of them should be close to zero. To separate the anomaly from background methods, by increasing the number of samples, two things may happen [14]:
1) The total error is reduced down to the zero by increasing the number of samples:
 (2)
(2)
2) The total error is not reluctant down to the zero by increasing the number of samples:
 (3)
(3)
For the first type of statistic, increasing the sample size (n) may greatly improve the testing results. It has been shown that U-statistic, as developed method by CHENG et al [14].
In order to run the U-statistic algorithm, the selected initial radius is considered 30 m [23]. Likewise, the rate of increase for the radius is also considered 30 m considering the systematic layout of the samples (Fig. 2). After calculating U value for each sampling point, a frequency diagram of U values distribution for two elements of interest, gold and arsenic, with a circular neighborhood for the sampling is obtained (Fig. 6).
According to the nature of the U-statistic method in separating at zero point, an acceptable separation is well seen in Fig. 6 for frequency diagram of U values distribution for two elements of gold and arsenic.
Finally, for showing background and also local and regional thresholds which finally can end to determination of anomalies for a series of geochemical data, the zero among the values of U is used. The resulted anomalous samples from this method for gold and arsenic can be observed in Fig. 7.
In the above figures, the background value has decreased and also the samples determined to be anomalous are more regular and less scattered. Thus obtained results are used for providing an accurate and perfect map of prospective areas and Fig. 8 shows univariate prospective areas map of the Susanvar for two elements of gold and arsenic.
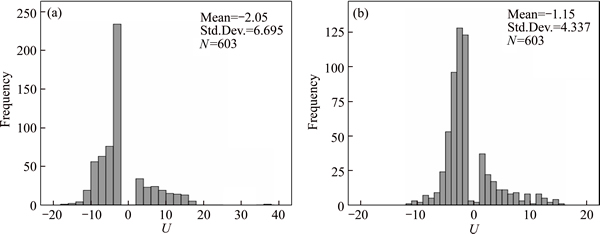
Fig. 6 Frequency diagram of U values for Au (a) and As (b)

Fig. 7 Separated values of Au (a) and As (b) using U-statistic method

Fig. 8 Prospective areas map of study area using U-method for Au (a) and As (b)
In following, the first type of statistic used for determining the optimum p ranged in calculating the distance from p=1 to p=10 in order to achieve the lowest possible error. Afterward, to use U-statistic method in multivariate mode, the U-statistic will be combined with optimum p-norm distance of elements for separating anomaly from background in multivariate mode. Actually U-statistic method is applied on values of Euclidean distance of elements.
4.4 Separating anomalous values using multivariate U-statistic
In this section, we will combine the U-statistic method with the Euclidean distance of elements for separating anomaly from background based on several variables. For this purpose, in the first step, optimum p-norm distance is selected in Euclidean space; in the second step, p-norm distance for optimum p-norm value is calculated; and in the third step, distribution of optimum p-norm distance of Au and As should be normalized. Finally, in the final step, the U-statistic method is applied on values of optimum p-norm distance of normalized elements.
In the Euclidean space Rn, the distance between two points is usually given by the Euclidean distance (2-norm distance). Other distances, based on other norms, are sometimes used instead. For a point x=(x1, x2, ��, xn) and a point y=(y1, y2, ��, yn), the most common norm is the Euclidean norm which is defined as [28]
 (4)
(4)
The Euclidean norm is a specific case of a family of norms called the p-norm, given by [28]
 (5)
(5)
p needs not to be an integer, but it cannot be less than 1, because otherwise the triangle inequality does not hold. The 1-norm is used to calculate the distance in an alternate form of geometry, referred to as the taxicab geometry, because it is the distance that a car would drive in a city laid out in square blocks (if there are no one-way streets) [28].
At first, we applied Eq. (5) for calculating distance of element grads derived from surface sampling in the Susanvar deposit. Equations of the error consideration section (in fact, Eq. (2)) used for determining the optimum p ranged in calculating the distance from p=1 to p=10 and afterwards, we analyzed derived total error in order to choose the optimum p. Results showed that p-norm distance of a fact that p=2 (Euclidean distance) in the case of Au and As was optimized p-norm distance with the lowest error (etotal=e1+e2).
The Euclidean distances have been calculated according to Eq. (4) (p=2). The grades of Au and As are considered as input and the Euclidean distance will be determined by Eq. (4). Values of Euclidean distance for Au and As are presented in Fig. 9.
In Fig. 10, the histograms of Euclidean distance values show a good tendency to normal distribution. Thus, the mentioned Euclidean distance values for Au and As can be considered a bivariate lognormal type (the identification software of trivariate lognormal populations suggested by GHANNADPOUR and HEZARKHANI [9] was applied for distinguishing bivariate and trivariate lognormal distributions).

Fig. 9 Euclidean distance values for samples

Fig. 10 Frequency diagram of logarithmic Euclidean distance values for Au and As
As said before, the selected initial radius to run the U-statistic algorithm [23, 29�C32] is considered 30 m. Likewise, the rate of increase for the radius is also considered 30 m considering the systematic layout of the samples (Fig. 2). After calculating U value for each sampling point, a frequency diagram of U values distribution for values of Euclidean distance with a circular neighborhood for the sampling region is provided and has presented in Fig. 11.

Fig. 11 Frequency diagram of U values for Euclidean distance values of Au and As
In above figures, according to the U-statistic on values of Euclidean distance, a good separation has occurred at the zero point.
For showing background and also local and regional thresholds which finally can end to determination of anomalies for a series of geochemical data, the zero among the values of U is used. The resulted anomalous samples from those two methods for gold and arsenic can be observed in Fig. 12.
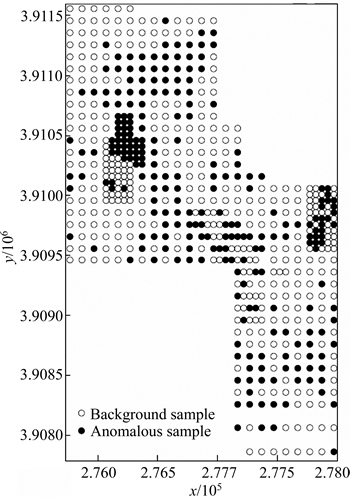
Fig. 12 Anomalies determined by considering variables of Au and As using combination of U-statistic and Euclidean distance method
As shown in Fig. 12, the background value has decreased compared to just the U-statistic results (Fig. 7). And also the samples determined to be anomalous are more regular and less scattered compared to the Mahalanobis distance method results (Fig. 5). It shows the advantage of the combination of these two methods to just U-statistic and other multivariate methods such as Mahalanobis distance method.
More importantly, as shown in positioning plan of anomalous values separated by combination method (Fig. 13(a)), 98 samples can be seen that are placed in anomaly range of U-statistic for both Au and As, while there are only 26 samples (Fig. 13(b)) with this characteristic using only the Mahalanobis distance method.
In above figure, the green points (the joint points of Au and As) delineated by this combination method are closely associated with the defined Au ore indication in the study area (see Fig. 1; Fig. 13(a)).

Fig. 13 Comparing results of combination of U-statistic and Euclidean distance method (a) with Mahalanobis distance method (b) for Au and As
Advantage of this combination in comparison with the U-statistic and the Mahalanobis distance method is respectively selecting anomalous samples based on two variables and increasing the number of the jointed samples.
Considering surrounding points, decreasing the effect of outlier points (data), selecting anomalous samples based on two variables instead of one and increasing the number of joint samples using a combination of these two methods, makes the results very efficient and also more favorable. Based on the results, the gold and arsenic follow Au ore indication within the study area. It is due to importance of the gold and arsenic in epithermal systems with granodioritic host rock that are two main elements in these systems.
Thus the obtained results are used for providing an improved map of prospective areas and Fig. 14 shows bivariate prospective areas maps of the Susanvar for gold and arsenic.
5 Conclusions
1) In the present study, K-means clustering method was used for finding an element which has a similar behavior with behavior of gold. Results of this method showed that the growth in Au grade is proportional to increase in As grade values, and As values vary linearly with respect to that of Au. According to this result, As and Au are selected to provide univariate and bivariate prospective areas map of Susanvar.
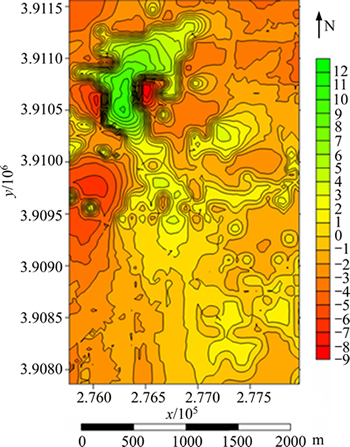
Fig. 14 Bivariate prospective map of study area using combination of U-statistic and Euclidean distance method for Au and As
2) By applying U-statistic method as a structural method and also multivariate Mahalanobis distance as nonstructural methods in the studied area for the elements of Au and As, anomalous samples were determined.
3) By the purpose of using U-statistic method in multivariate mode, at the first step, the optimum p was calculated in p-norm distance. Results showed that p-norm distance of p=2 (Euclidean distance) in the case of a fact that Au and As was optimized p-norm distance with the lowest error. Then U-statistic was applied on 2-norm distance (Euclidean distance) values of the samples. This method is a combination of efficient U-statistic and Euclidean distance and was used for the first time in this article.
4) Determined samples based on the combination of these methods as anomalous were more regular, less dispersed and more accurate than using just the U-statistic and other nonstructural methods such as Mahalanobis distance one. Also it was observed that combined results are closely associated with the defined Au ore indication in the study area. Eventually, univariate and bivariate geochemical anomaly maps of the studied area for Au and As are respectively provided using U-statistic and its combination with Euclidean distance method.
Acknowledgements
We are grateful to the Geological Survey of Iran and Kavesh Kansar Engineering Company for sampling operations; and to Ms Fatemeh Ghashghaei for giving us data about Susanvar region.
References
[1] SHAMANIAN G H, HEDENQUIST J W, HATTORI K H, HASSANZADEH J. The Gandy and Abolhassani epithermal deposits in the Alborz magmatic arc, Semnan Province, northern Iran [J]. Economic Geology, 2004, 99: 691�C712.
[2] KAZMIN V G, SBORSHIKOV I M, RICOU L E, ZORENSHAIN E P, BOULIN S, KNIPPER A L. Volcanic belts as markers of the Mesozoic-Cenozoic active margin of Eurasia [J]. Tectonophysics, 1986, 123: 123�C152.
[3] ALAVI M. Tectonic map of the Middle East, 1:5000000 [M]. Tehran, Iran: Geologic Survey of Iran, 1991.
[4] HASSANZADEH J, GHAZI A V, AXEN G, GUEST B. Oligomiocene mafic-alkaline magmatism in north and northwest of Iran: Evidence for the separation of the Alborz from the Urumieh-Dokhtar magmatic arc [J]. Geological Society America Abstracts with Program, 2002, 34: 331.
[5] SHAMANIAN G H, HEDENQUIST J W, HATTORI K H, HASSANZADEH J. Epithermal precious- and base-metal mineralization in the Eocene arc of Torud-Chah Shirin mountain range: Gandy and Abolhassani districts, Semnan, northern Iran [C]// ELIOPOULOS D G, et al. Mineral Exploration and Sustainable Development. Rotterdam: Mill Press, 2003: 519�C522.
[6] Geological Survey of Iran. Explanatory text of geochemical map of Moaleman (6960) [R]. 1995, 1: 33.
[7] GHANNADPOUR S S, HEZARKHANI A. Lead and zinc geochemical behavior based on geological characteristics in Parkam Porphyry Copper System, Kerman, Iran [J]. Journal of Central of South University, 2015, 22: 4274�C4290.
[8] GHANNADPOUR S S, HEZARKHANI A. Investigation of Cu, Mo, Pb, and Zn geochemical behavior and geological interpretations for Parkam porphyry copper system, Kerman, Iran [J]. Arabian Journal of Geosciences, 2015, 8(9): 7273�C7284.
[9] GHANNADPOUR S S, HEZARKHANI A. Developed software to calculate the additive constant number of average in three�Cvariable normal logarithm [J]. Global Journal of Computer Sciences, 2012, 2: 7�C13.
[10] HAWKES H E, WEBB J S. Geochemistry in mineral exploration [M]. New York: Harper and Row, 1962, 415 p.
[11] MIESCH A T. Estimation of the geochemical threshold and its statistical significance [J]. Journal of Geochemical Exploration, 1981, 16: 49�C76.
[12] SINCLAIR A J. A fundamental approach to threshold estimation in exploration geochemistry: Probability plots revisited [J]. Journal of Geochemical Exploration, 1991, 41: 1�C22.
[13] CHENG Q, AGTERBERG F P, BALLANTYNE S B. The separation of geochemical anomalies from background by fractal methods [J]. Journal of Geochemical Exploration, 1994, 51: 109�C130.
[14] CHENG Q, AGTERBERG F P, BONHAM-CARTER G F. A spatial analysis method for geochemical anomaly separation [J]. Journal of Geochemical Exploration, 1996, 56: 183�C195.
[15] CHENG Q. Spatial and scaling modelling for geochemical anomaly separation [J]. Journal of Geochemical Exploration, 1999, 65: 175�C194.
[16] GONCALVES M A, MATEUS A, OLIVERIA V. Geochemical anomaly separation by multifractal modeling [J]. Journal of Geochemical Exploration, 2001, 72: 91�C114.
[17] LI C, MA T, SHI J. Application of a fractal method relating concentrations and distances for separation of geochemical anomalies from background [J]. Journal of Geochemical Exploration, 2003, 77: 167�C175.
[18] ZUO R. Identifying geochemical anomalies associated with Cu and Pb�CZn skarn mineralization using principal component analysis and spectrum�Carea fractal modeling in the Gangdese Belt, Tibet (China) [J]. Journal of Geochemical Exploration, 2011, 111: 13�C22.
[19] ROSHANI P, MOKHTARI A R, TABATABAEI S H. Objective based geochemical anomaly detection��Application of discriminant function analysis in anomaly delineation in the Kuh Panj porphyry Cu mineralization (Iran) [J]. Journal of Geochemical Exploration, 2013, 130: 65�C73.
[20] GHANNADPOUR S S, HEZARKHANI A. Introducing 3D U-statistic method for separating anomaly from background in exploration geochemical data with associated software development [J]. Journal of Earth System Science, 2016, 125(2): 387�C401.
[21] GHANNADPOUR S S, HEZARKHANI A. Exploration geochemistry data-application for anomaly separation based on discriminant function analysis in the Parkam porphyry system (Iran) [J]. Geosciences Journal, 2016, 20(6): 837�C850.
[22] GHANNADPOUR S S, HEZARKHANI A, MAGHSOUDI A, FARAHBAKHSH E. Assessment of prospective areas for providing the geochemical anomaly maps of lead and zinc in Parkam district, Kerman, Iran [J]. Geosciences Journal, 2015, 8(1): 345�C355.
[23] GHANNADPOUR S S, HEZARKHANI A, SABETMOBARHAN A. The Parkam exploration district, Kerman, Iran: Geology, alterations, and delineation of Cu- and Mo-mineralized zones using U-spatial statistic with associated software development [J]. Journal of Earth Science, 2017, 28(2): 283�C294.
[24] GHANNADPOUR S S, HEZARKHANI A. Comparing U-statistic and nonstructural methods for separating anomaly and generating geochemical anomaly maps of Cu and Mo in Parkam district, Kerman, Iran [J]. Carbonates and Evaporites, 2017, 32(2): 155�C166.
[25] GHANNADPOUR S S, HEZARKHANI A. Providing the bivariate anomaly map of Cu�CMo and Pb�CZn using combination of statistic methods in Parkam district, Iran [J]. Carbonates and Evaporites, 2017, doi: 10.1007/s13146-017-0349-2.
[26] FILZMOSER P, GARRETT R G, REIMANN C. Multivariate outlier detection in exploration geochemistry [J]. Computer & Geosciences, 2005, 31: 579�C587.
[27] RAMZAN S, ZAHID F M, RAMZAN S. Evaluating multivariate normality: A graphical approach [J]. Middle-East Journal of Scientific Research, 2013, 13: 254�C263
[28] MERINO D I. The distance between a point and a line using different norms [D]. Cadence Lee Ellington: Southeastern Louisiana University, 2002: 1�C2.
[29] GHANNADPOUR S S, HEZARKHANI A, ROODPEYMA T. Combination of separation methods and data mining techniques for prediction of anomalous areas in Susanvar, Central Iran [J]. Journal of African Earth Sciences, 2017, 134: 516�C525.
[30] GHANNADPOUR S S, HEZARKHANI A. Applying the combination of U-statistic and Mahalanobis distance as a multivariate structural method for the delineation of geochemical anomalies [J]. Geosystem Engineering, 2017, doi: 10.1080/12269328. 2017.1355268.
[31] HEZARKHANI A, GHANNADPOUR S S. Exploration information analysis [M]. First ed. Tehran, Iran: Amirkabir University of Technology (Tehran Polytechnic) Press, 2015: 245. (in Persian)
[32] GHANNADPOUR S S. Geochemical studies of porphyry copper ore deposit of Parkam, Tehran [D]. Tehran, Iran: Amirkabir University of Technology, 2013.
(Edited by YANG Hua)
Cite this article as: Seyyed Saeed Ghannadpour, Ardeshir Hezarkhani, Mostafa Sharifzadeh. A method for extracting anomaly map of Au and As using combination of U-statistic and Euclidean distance methods in Susanvar district, Iran [J]. Journal of Central South University, 2017, 24(11): 2693�C2704. DOI:https://doi.org/10.1007/s11771-017-3682-7.
Received date: 2016-05-24; Accepted date: 2017-03-13
Corresponding author: Ardeshir Hezarkhani, Professor; Tel: +98�C912�C187�C2494, Fax: +98�C21�C66405846; E-mail: ardehez@aut.ac.ir

