Cloud model-clustering analysis based evaluation for ventilation system of underground metal mine in alpine region
来源期刊:中南大学学报(英文版)2021年第3期
论文作者:李孜军 闫放 董陇军 黄锐 曹日红 葛及 许开立
文章页码:796 - 815
Key words:ventilation system; underground metal mine; alpine region; cloud model; cloud similarity; Euclidean distance
Abstract: Ventilation system is significant in underground metal mine of alpine region. Reasonable evaluation of ventilation effectiveness will lead to a practical improvement for the maintenance and management of ventilation system. However, it is difficult to make an effective evaluation of ventilation system due to the lack of classification criteria with respect to underground metal mine in alpine region. This paper proposes a novel evaluation method called the cloud model-clustering analysis (CMCA). Cloud model (CM) is utilized to process collected data of ventilation system, and they are converted into cloud descriptors by CM. Cloud similarity (CS) based Euclidean distance (ED) is proposed to make clustering analysis of assessed samples. Then the classification of assessed samples will be identified by clustering analysis results. A case study is developed based on CMCA. Evaluation results show that ventilation effectiveness can be well classified. Moreover, CM is used alone to make comparison of evaluation results obtained by CMCA. Then the availability and validity of CMCA is verified. Meanwhile, difference of CS based ED and classical ED is analyzed. Two new clustering analysis methods are introduced to make comparison with CMCA. Then the ability of proposed CMCA to meet evaluation requirements of ventilation system is verified.
Cite this article as: YAN Fang, LI Zi-jun, DONG Long-jun, HUANG Rui, CAO Ri-hong, GE Ji, XU Kai-li. Cloud model-clustering analysis based evaluation for ventilation system of underground metal mine in alpine region [J]. Journal of Central South University, 2021, 28(3): 796-815. DOI: https://doi.org/10.1007/s11771-021-4646-5.

J. Cent. South Univ. (2021) 28: 796-815
DOI: https://doi.org/10.1007/s11771-021-4646-5

YAN Fang(闫放)1, 2, LI Zi-jun(李孜军)1, 2, DONG Long-jun(董陇军)1, 2, HUANG Rui(黄锐)1, 2,CAO Ri-hong(曹日红)1, GE Ji(葛及)3, 4, XU Kai-li(许开立)3
1. School of Resources and Safety Engineering, Central South University, Changsha 410083, China;
2. Safety & Security Theory Innovation and Promotion Center (STIPC), Central South University,Changsha 410083, China;
3. Key Laboratory of Ministry of Education on Safe Mining of Deep Metal Mines, Northeastern University, Shenyang 110819, China;
4. School of Resources and Environmental Engineering, Jilin Institute of Chemical Technology,Jilin 132022, China
 Central South University Press and Springer-Verlag GmbH Germany, part of Springer Nature 2021
Abstract: Ventilation system is significant in underground metal mine of alpine region. Reasonable evaluation of ventilation effectiveness will lead to a practical improvement for the maintenance and management of ventilation system. However, it is difficult to make an effective evaluation of ventilation system due to the lack of classification criteria with respect to underground metal mine in alpine region. This paper proposes a novel evaluation method called the cloud model-clustering analysis (CMCA). Cloud model (CM) is utilized to process collected data of ventilation system, and they are converted into cloud descriptors by CM. Cloud similarity (CS) based Euclidean distance (ED) is proposed to make clustering analysis of assessed samples. Then the classification of assessed samples will be identified by clustering analysis results. A case study is developed based on CMCA. Evaluation results show that ventilation effectiveness can be well classified. Moreover, CM is used alone to make comparison of evaluation results obtained by CMCA. Then the availability and validity of CMCA is verified. Meanwhile, difference of CS based ED and classical ED is analyzed. Two new clustering analysis methods are introduced to make comparison with CMCA. Then the ability of proposed CMCA to meet evaluation requirements of ventilation system is verified.
Key words: ventilation system; underground metal mine; alpine region; cloud model; cloud similarity; Euclidean distance
Cite this article as: YAN Fang, LI Zi-jun, DONG Long-jun, HUANG Rui, CAO Ri-hong, GE Ji, XU Kai-li. Cloud model-clustering analysis based evaluation for ventilation system of underground metal mine in alpine region [J]. Journal of Central South University, 2021, 28(3): 796-815. DOI: https://doi.org/10.1007/s11771-021-4646-5.
1 Introduction
With the recent economic development, the requirement of resources has satisfied the substantial growth in China [1-3]. To expand the resource development, the mining industry has experienced a gradual development in the alpine region of China [4].
Most alpine regions of China are going to be exploited by the mining industry, including Qinghai-Tibet Plateau and Yunnan-Guizhou Plateau [4]. The ventilation system is very important for air purification and maintenance of the temperature and humidity of an underground metal mine [5]. Especially in the alpine region, a ventilation system is significant in the improvement of the oxygen supply [6]. Ventilation is also significant for the cleaner production of an underground metal mine because it not only regulates the temperature but also eliminates the influence of dust [7]. Because most underground metal mines in the alpine region are deep mines, thermal damage caused by temperature change may occur [8, 9]. Thus, the ventilation system is important and effective for the improvement of the thermal environment [10]. A ventilation system can also be utilized to handle the air pollution in an underground metal mine. The air quality can be continuously improved based on the effective ventilation system [11]. As a result, the ventilation effectiveness can generate a series of influences on mining activities. Therefore, the scientific and reasonable evaluation of a ventilation system will improve the maintenance and management of a ventilation system [12]. Numerous studies address the evaluation of ventilation systems of underground mines. CHENG and YANG [13] indicated that mine ventilation should be tracked and monitored to maintain a suitable working environment. They proposed a proper early warning model to improve the mine ventilation safety. For the proposed model, the rough set (RS) theory and support vector machine (SVM) were employed to assess the risk rank of a ventilation system, and the test case showed that the model had better accuracy and reliability. HUANG et al [14] also proposed a fuzzy comprehensive theory model for the safety evaluation of a mine ventilation system. They took advantage of artificial neural network and fuzzy control theory to assess credibility levels. The assessment results demonstrated that uncertainties with respect to the evaluation of mine ventilation can be solved, and quantitative analysis can be subsequently performed. In regard to the optimization of a ventilation system, LEE [15] created a ventilation improvement index (VII) to optimize a mine ventilation system. Both the ventilation effectiveness and cost efficiency were considered in the proposed index. The suggested VII can be regarded as a powerful tool for the evaluation of ventilation improvement. Similarly, NEL et al [16] developed a scalable method to improve operational decisions based on a computational simulation. The proposed method presented a means for determining the best alternative based on the comprehensive evaluation, which yielded 23% energy savings of the ventilation system. In LIANG’s study [17], a decision-making framework was constructed based on the hesitant linguistic preference relation (HLPR) to solve the uncertainty problem of a ventilation system. The researchers effectively conducted an evaluation of the optimal mine ventilation system by the proposed method. Various methods can be employed to fulfill the requirements in the evaluation of a mine ventilation system.
For the ventilation system of an underground metal mine in the alpine region, many uncertainties exist in the evaluation process. Thus, the cloud model (CM)-based clustering analysis can be introduced to solve the problem. The CM is an efficient method in the evaluation of objectives, including uncertainties. ZHANG et al [18] used the CM to overcome the uncertainty of fuzziness and randomness during the gradation of evaluation factors and proposed the extended cloud model (ECM) to evaluate adjacent buildings in tunneling environments. The results showed that an ECM can be regarded as a valid tool for risk assessment in urban tunneling construction. To perform an evaluation of properties with respect to carbon/ carbon composites, LI et al [19] developed a quantitative characteristic method that is based on CM [19]. They established the relationship between the extinction angle and texture types by the CM and realized the quantitative characterization of carbon/carbon composites matrix. WANG et al [20] investigated a CM-based assessment approach to perform an evaluation of the water quality. In their study, the proposed approach was utilized to evaluate the eutrophication status of typical lakes and reservoirs, and accurate evaluation results were obtained. The CM is also extensively applied in various fields, including comprehensive stability evaluation of rock slopes [21], analysis of accelerated life test data [22], risk assessment of biomass gasification [23, 24], and safety assessment of petrochemical enterprises [25]. LI et al [26] presented a significant concept referred to as cloud similarity (CS) to analyze the relationship among assessed data [26]. ZANG et al [27] developed the definition and algorithm of CS, took advantage of fuzzy methods to improve the CS and proposed an extended CS. The extended CS was utilized to confirm the harmonic pollution level, which achieved excellent evaluation results. In addition, XU et al [25, 28] used the CM to perform a safety assessment of a petrochemical enterprise and quality evaluation of Chinese red wine based on the calculation of CS. In their study, the CS was calculated by cloud descriptors. The calculation results of CS can indicate the relationship of normal clouds and will provide appropriate evaluation results for the assessed objectives. To evaluate a ventilation system of an underground metal mine in the alpine region, the utilization of CM and CS will improve the evaluation effectiveness. The Euclidean distance (ED) can be introduced to perform a clustering analysis to obtain the evaluation results. The ED can be employed to identify the relevance of normal clouds with respect to the assessed samples. As a straight-line distance metric [29], the ED can be used to assess the relevance of fuzzy linguistic variables [30]. KUMAR et al [31] indicated that the ED was effective in the analysis of multiple-input and multiple-output networks. The ED can also be applied to the anomaly detection of mechanical systems [32]. In GOMEZ’s study [33], the ED combined with information about the control treatment was treated as a useful method to perform an evaluation of plant experimental analyses. Their results showed that the ED can contribute to establishing a more integrated evaluation. With regard to YAN’s study [34], usage of ED in hazard assessment of biomass gasification stations demonstrated its ability in the clustering analysis of assessed data. Therefore, a CM-based clustering analysis can be considered a feasible approach for the evaluation of a ventilation system of an underground metal mine in the alpine region.
In this study, a novel evaluation method that is referred to as cloud model-clustering analysis (CMCA) is proposed. Corresponding evaluation procedures and detailed algorithms are shown in Section 2. In Section 3, a case study is introduced to verify the applicability and effectiveness of the proposed CMCA. Section 4 presents the evaluation results, and CMCA is compared with the CM to verify its validity. In addition, appropriate discussions have addressed the advantages of CMCA. The main contributions of this work are as follows:
1) A novel method CMCA used for the evaluation of underground metal mine’s ventilation system in alpine region is proposed.
2) The framework of proposed CMCA is established. Flowchart of the overall algorithm is provided and shown in the end of Section 2.
3) The CS based ED is introduced to make clustering analysis of multiple samples with respect to the effectiveness of ventilation system.
4) Assessed samples can be well classified based on the evaluation results. It will provide valid guidance for the management and maintenance of ventilation system.
2 Methodology
2.1 Related concept of CM
The probability theory focuses on the research of randomness, while a fuzzy set focuses on the study of fuzziness. The CM is used to elucidate the membership of the fuzzy set that is based on the probability theory; the randomness and fuzziness in the system can be reflected. The uncertainty of the mass of data can be analyzed by a conceptual approach that is based on the CM, and the transformation model for qualitative concepts and quantitative values also can be developed by the CM.
With regard to the CM, U is assumed to be the quantitative universe of investigation that is represented by precise values. C is defined as the qualitative concept of U. If the quantitative value x satisfies the condition x∈U, it is a random realization of qualitative concept C. The certainty degree μ(x)∈[0, 1] is a random number with a stable tendency [35]. The distribution of x in U is referred to as the cloud, and each x denotes a cloud drop of the cloud (Eq. (1)) [35].
The cloud consists of a mass of cloud drops, and the realization of a qualitative concept is reflected by a cloud drop. Thus, additional cloud drops will be conductive to a better reflection of the qualitative concept. To achieve a better comprehension of the cloud, three descriptors with respect to the CM are introduced to ensure the accurate representation of the concept: Expectation Ex is the measurement of essential certainty for the qualitative concept and is the mathematical expectation of the distribution with respect to cloud drops in the universe of discourse. Entropy En denotes the measurement of uncertainty for the qualitative concept and is confirmed by the randomness and fuzziness of the concept. The excess entropy He means the entropy of En; it is the measurement of uncertainty of En and is also referred to as the second-order entropy. The concept C can be expressed by CM descriptors (Ex, En and He). Similarly, assuming that U is a quantitative universe of discourse that is represented by precise values, and C(Ex, En, He) is a qualitative concept in U. The quantitative value x (x∈U) is a random realization of the qualitative concept C and is subjected to the Gaussian distribution, which has the expectation Ex and variance En′2, i.e., x~N(Ex, En′2). En′ is subjected to the Gaussian distribution, which has the expectation En and variance He2, i.e., En′~N(En, He2), and is also a random realization. The certainty of x for C will satisfy the following condition (Eq. (1)), and the distribution of x in U can be referred to as the Gaussian cloud or normal cloud [26].
 (1)
(1)
where μ(x) denotes the cloud membership.
Cloud drops (xi, μi) can be generated by a forward cloud generator based on cloud descriptors C(Ex, En, He). Cloud descriptors can be confirmed using a backward cloud generator based on cloud drops (Figure 1) [21, 26]. For the confirmation of cloud descriptors using a backward cloud generator, original data of the assessed samples should be initially normalized (Eq. (2)). Equation (3) is employed to calculate the cloud descriptors according to the original data of assessed samples [23, 35]. In addition, the aggregation of multiple normal clouds considering their weights can be achieved by Eq. (4) [24, 36].
 (2)
(2)
where Sx,i denotes the normalized value of sample x with respect to index i, and sx,i denotes the original value of sample x with respect to index i.
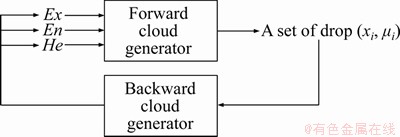
Figure 1 Diagram of cloud generator
 (3)
(3)
where Exx,i, Enx,i and Hex,i denote the cloud descriptors Cx of sample x, and N denotes the quantity of original data l.
 (4)
(4)
where ω denotes the index weight, and n denotes the number of indices.
As previously mentioned, a qualitative concept is reflected by the number of quantitative cloud drops, which will contribute to the concept. However, each cloud drop has a different contribution to the concept. The “3En rule” is employed to recognize cloud drops that are significant for the concept. For the “3En rule”, cloud drops within the range of [Ex-3En, Ex+3En] are considered valid for the qualitative concept, that is, cloud drops within the range of [Ex-3En, Ex+3En] will make a crucial contribution for the concept [26, 37]. To make a visual explanation of the '3En rule', a normal cloud C(5, 1, 0.05) is generated by a forward cloud generator (Figure 2).
2.2 Clustering analysis based on cloud descriptors
In general, the assessment can be conducted when the classification of a system or sample is known. The assessment for the ventilation system of an underground metal mine in the high alpine region is significant due to the harsh environment [38, 39]. Therefore, the clustering analysis can be introduced to enhance the effectiveness with respect to the assessment of the ventilation system. The clustering analysis is aimed at classifying a group of individuals when the corresponding information for the classification is lacking. The samples can be classified based on the relation among the data with respect to the samples. In regard to the traditional clustering analysis, the classification of a system is reflected by one factor. However, CM uses three descriptors, i.e., Ex, En and He to describe the concept. Thus, the clustering analysis that considers cloud descriptors will provide a more reasonable basis for the assessment of a ventilation system. To implement the clustering analysis, the CS should be introduced to measure the relationships of the assessed samples (Eq. (5)) [25, 26]. Considering the impact of various indices, the ED is introduced to perform a clustering analysis for multiple normal clouds (Eq. (6)) [30, 32]. With regard to the clustering of normal clouds, the effect of each index should be initially confirmed. The indices are divided into two categories, i.e., positive index and negative index. For the positive index, the greater index value indicates a better effectiveness of the ventilation system. Conversely, the negative index means that the greater index value represents a lower effectiveness of the ventilation system. Therefore, algorithms for a positive index and a negative index are addition and subtraction, respectively. The value of ED is distinctly within [-1, 1] because the value of CS is within [0, 1]. A higher similarity will be obtained when the value of ED is near 1. Conversely, a lower similarity will be confirmed if the value of ED is near -1.
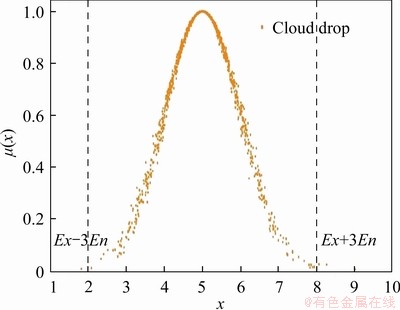
Figure 2 An example of a normal cloud
 (5)
(5)
where λ(Cx, Cy) denotes the CS from sample x to sample y; Exx and Exy denote the expectation of sample x and the expectation of sample y, respectively; and Eny denotes the entropy of sample y.


 (6)
(6)
where d(Cx, Cy)denotes the ED between sample x and sample y; m1 and m2 denote the number of positive indices and the number of negative indices, respectively; ipositive and inegative denote the positive index and the negative index, respectively; and ωi denotes the weight of index i.
The following steps are provided to illustrate the clustering analysis based on cloud descriptors.
Step 1: Original data with respect to each sample are converted into normal clouds by a backward cloud generator, and corresponding cloud descriptors are confirmed by Eqs. (2) and (3).
Step 2: Assuming that the number of assessed samples is n, and the assessed samples are classified into n categories, that is, each category includes only one sample.
Step 3: In regard to the assessed samples (the number of them is P), Eqs. (5) and (6) are used to calculate the cloud descriptors-based similarity matrix (Eq. (7)).
 (7)
(7)
Step 4: Two categories that have the maximal similarity, i.e., MAX(d(Cx, Cy)) can be obtained based on the calculations using Eq. (7). The corresponding samples x and y are merged into the new category r=n+1.
Step 5: Let the mean value of normal clouds with respect to sample x and y be the clustering center of category r. The algorithm for the mean value of normal clouds is shown in Eq. (8) [23, 36]. Subsequently, Eqs. (5) and (6) are used again to calculate the new similarity matrix (Eq. (9)).
 (8)
(8)
where Exmean, Enmean, and Hemean denote the mean values of the cloud descriptors for the new category.
 (9)
(9)
Step 6: Repeat Steps 4 and 5 until the number of category is 1; the clustering analysis results can be subsequently obtained.
2.3 CMCA-based evaluation model
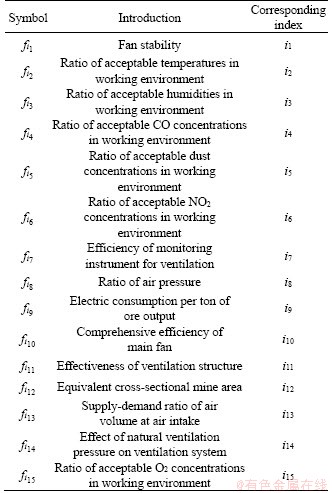
Mine ventilation has a very important role in the guarantee of the normal operation and safety production of mines. With regard to the underground metal mine in the high alpine region and at high altitude, various factors should be comprehensively considered to perform an evaluation. In addition, characteristics with respect to the alpine region need to be considered for the establishment of the evaluation index. The proposed CMCA is employed to conduct the evaluation based on the established index, and the evaluation results can provide guidance for the ventilation system optimization. Based on the characteristics with respect to an underground metal mine in the high alpine region and at high altitude, the evaluation of a ventilation system is considered by four aspects, i.e., safety (a1), economic rationality (a2), technical feasibility (a3) and alpine region characteristics (a4). For these four aspects, fifteen corresponding indices (i1-i15) are introduced to perform an evaluation. The established evaluation index is shown in Figure 3 [40].
Indexes i1-i6 are confirmed by field measurements and calculated by Eqs. (10)-(15). Index i1 is confirmed by the effective pressure of main fan and maximum pressure of main fan (Eq. (10)). For index i2 and i3, the acceptable temperature and relative humidity are set to 17-28 °C and 45%- 65%, respectively [41]. For index i4, the standard CO concentration is set to 22.33×10⁻⁶ mg/m3 (at altitude 2000-3000 m) and 18.98×10⁻⁶ mg/m3 (at altitude 3000-4500 m) [42]. Because the air will be thinner when the altitude increases, the standard concentration of CO should be reduced as the altitude increases. With regard to index i5, the standard dust concentration is confirmed by Table 1 [43]. According to the relevant standards of China, the standard concentration of dust is not affected by the variation altitude. For index i6, the standard NO2 concentration is set to 6.11×10⁻⁶ mg/m3 (at altitude 2000-3000 m) and 5.64×10⁻⁶ mg/m3 (at altitude 3000-4000 m) [42]. Similar to index i4, the standard concentration of NO2 should be reduced as the altitude increases. The qualification parameters of indices i2 and i3 are in an interval of values [41]. The evaluated data in the interval will be regarded as acceptable. The qualification parameters with respect to indices i4-i6 are maximally acceptable parameters [42, 43]. If the values of the evaluated data are less than these parameters, they will be regarded as acceptable. Index i7 represents the monitoring level of the mine ventilation, which is calculated by Eq. (16). Index i8 denotes the matching ratio of main fan and the ventilation resistance, which is obtained with Eq. (17). Data with respect to index i9 are confirmed by Eq. (18). For index i10, Eq. (19) is utilized to obtain the results [42]. With regard to index i11, the ventilation control facilities are used to control the air flow, they include the air door, air crossing, ventilation wall, etc. If the air leakage is more than 2%, the ventilation structure will be considered as unacceptable. Equation (20) is used to obtain the calculation results. Index i12 and i13 are confirmed by Eqs. (21) and (22), respectively [42]. Index i14 is obtained by Eq. (23). For index i15, the O2 concentration shall not be lower than 20% at sea level [42]. The O2 concentration will decrease by approximately 0.76% when the altitude increases by 100 m. The relationship between the acceptable O2 concentration and the altitude is shown as Eq. (25). For the measuring point, the value of β, i.e., the acceptable O2 concentration, can be calculated by its measured altitude. The measured O2 concentration is compared with the calculated β to confirm that the measuring point is acceptable. Equation (26) is utilized to obtain the results. The proposed functions with respect to fi1-fi15 are introduced and shown in Table 2. It should be noted that the calculation of above indices is made based on corresponding standards and criteria of China.
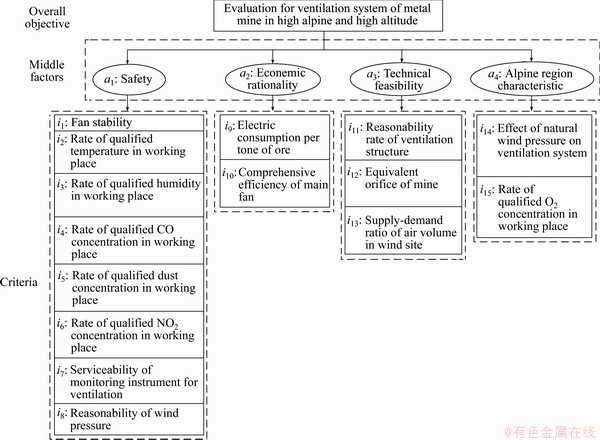
Figure 3 Evaluation index for ventilation system of underground metal mine in high alpine region and high altitude
Table 1 Standard dust concentration in working environment
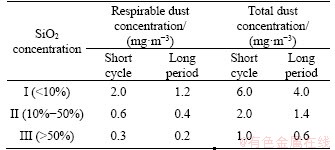
Table 2 Summary of proposed functions
With regard to the evaluation of ventilation system in alpine underground metal mines of other countries, the calculation needs to follow their related standards and criteria. Meanwhile, the construction of evaluation indices still keeps the same of this paper.
 (10)
(10)
where fi1 denotes the fan stability; h (Pa) denotes the effective pressure of main fan; and hmax (Pa) denotes the maximum pressure of main fan.
 (11)
(11)
where fi2 denotes the ratio of acceptable temperatures in the working environment; Q1 denotes the number of acceptable temperature measuring points; and Q2 denotes the number of total temperature measuring points.
 (12)
(12)
where fi3 denotes the ratio of acceptable humidity in the working environment, the kind of humidity is relative humidity, Q3 denotes the number of acceptable humidity measuring points; and Q4 denotes the total number of humidity measuring points.
 (13)
(13)
where fi4 denotes the ratio of acceptable CO levels in the working environment; Q5 denotes the number of acceptable CO concentration measuring points; and Q6 denotes the number of total CO concentration measuring points.
 (14)
(14)
where fi5 denotes the ratio of acceptable dust concentrations in the working environment; Q7 denotes the number of acceptable dust concentration measuring points; and Q8 denotes the number of total dust concentration measuring point.
 (15)
(15)
where fi6 denotes the ratio of acceptable NO2 concentrations in the working environment; Q9 denotes the number of acceptable NO2 concentration measuring points; and Q10 denotes the number of total NO2 concentration measuring points.
 (16)
(16)
where fi7 denotes the efficiency of the monitoring instrument for ventilation; Q11 denotes the number of installed monitoring instruments in satisfactory condition; and Q12 denotes the number of monitoring instruments that should be set in the assessed mine.
 (17)
(17)
where fi8 denotes the ratio of the air pressure; hr (Pa) denotes the ventilation resistance; and Qf (m3/s) denotes the working ventilation volume of main fan.
 (18)
(18)
where fi9 denotes the electric consumption per ton of ore output; W (kW・h) denotes the total electric consumption of fans; and V (t) denotes the ore production.
 (19)
(19)
where fi10 denotes comprehensive efficiency of the main fan; hs (Pa) denotes the air pressure of the main fan; u (V) and I (A) denote the input voltage and incoming current, respectively, of the electromotor; and η denotes the power factor.
 (20)
(20)
where fi11 denotes the effectiveness of the ventilation structure; Q13 denotes the number of acceptable ventilation control facilities; and Q14 denotes the total number of ventilation control facilities.
 (21)
(21)
where fi12 denotes the equivalent cross-sectional area of the mine; Q (m3/s) denotes the total air-quantity of mine; and hRm (Pa) denotes the total resistance of the mine ventilation.
 (22)
(22)
where fi13 denotes the supply-demand ratio of air volume at the air intake, and Q0 (m3/s) denotes the actual required air volume.
 (23)
(23)
where fi14 denotes the effect of the natural ventilation pressure on the ventilation system; Qna (m3/s) denotes the natural air volume; and Qre (m3/s) denotes the required air volume, which is calculated by Eq. (24) [41].
 (24)
(24)
where Npeople denotes the number of people who work in a mine.
 (25)
(25)
where β denotes the acceptable O2 concentration, and H (m) denotes the actual altitude.
 (26)
(26)
where fi15 denotes the ratio of acceptable O2 concentrations in the working environment; Q15 denotes the number of acceptable O2 concentration measuring points; and Q16 denotes the number of total O2 concentration measuring points.
After establishing the evaluation index for a ventilation system, the integrated evaluation model for a ventilation system of an underground metal mine in the alpine region can be constructed (Figure 4).
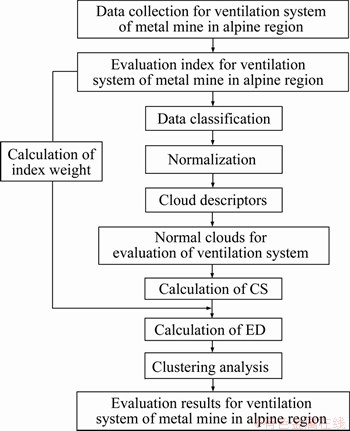
Figure 4 Flowchart of provided evaluation model
3 Case study
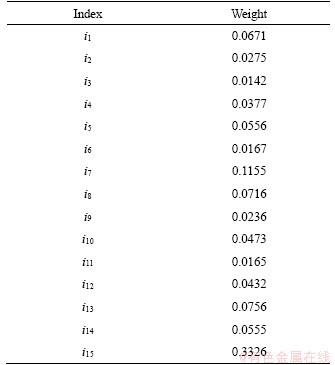
In this study, an underground copper mine located in Southwest China was employed to perform a case study. The analytic hierarchy process (AHP) is used to confirm the weight of each index, as shown in Figure 3. The index is classified in three levels, i.e., the total objective, middle factors and criteria. The pair-wise comparison and 1/9-9 scale are utilized to work out the judgment matrix (Eqs. (27)-(31)). Note that indices i9, i10, i12 and i13 exhibit a mutual correlation, and the pair-wise comparison and establishment of a judgment matrix should consider the effect of mutual correlation. Subsequently, the index weight can be confirmed, and calculated values are listed in Table 3. In addition, the consistency ratio (CR) of the judgment matrix is calculated based on the AHP. If the value of CR was less than 0.1, then the judgment matrix had satisfactory consistency; otherwise, the judgment matrix has unsatisfactory consistency and must be adjusted. For the obtained judgment matrices (Eqs. (27)-(31)), all values of CR are less than 0.1.

 (27)
(27)

 (28)
(28)
 (29)
(29)
 (30)
(30)
 (31)
(31)
Table 3 Calculated values of index weights
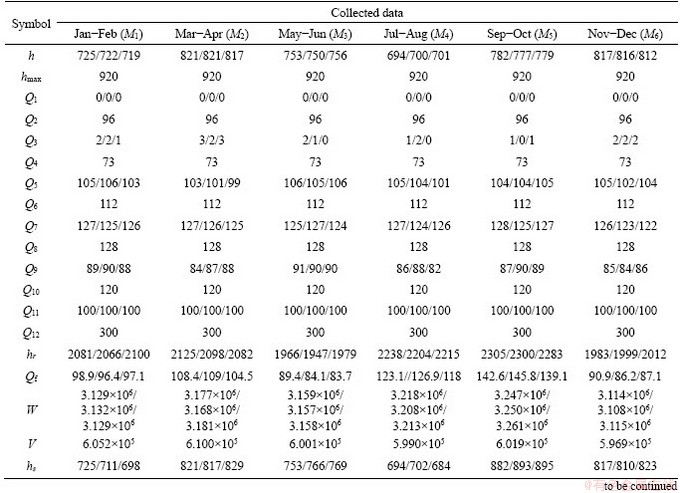
Data are collected by detection and collection during the production process. The data collection is implemented three times within one period (two months). The corresponding data of the ventilation system with respect to the assessed mine are collected according to the evaluation index shown in Figure 3; they are listed in Table 4.
4 Results and discussion
4.1 Confirmation of cloud descriptors with respect to assessed mine
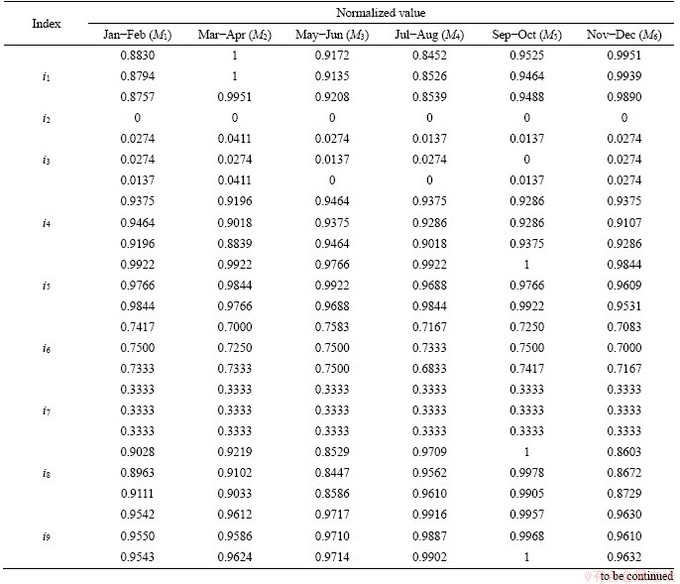
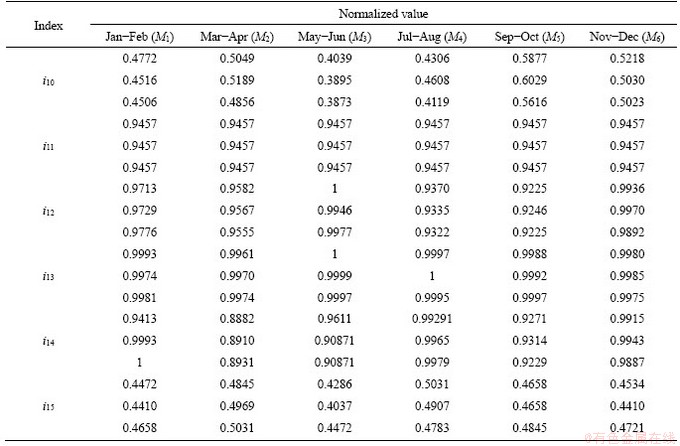
As previously mentioned in the section of the case study, corresponding data of the ventilation system for the assessed mine have been collected. The value with respect to each index in each period is confirmed by Eqs. (10)-(26). Subsequently, the calculated values of the evaluation indices need to be normalized by Eq. (2), and the normalized values of the evaluation indices are shown in Table 5. Note that the data of indices i2-i7, i10-i11 and i15 are presented as normalized values. Thus, the normalization will only be performed for the values in indices i1, i8-i9 and i12-i14.
Table 4 Collected data of assessed mine
Continued
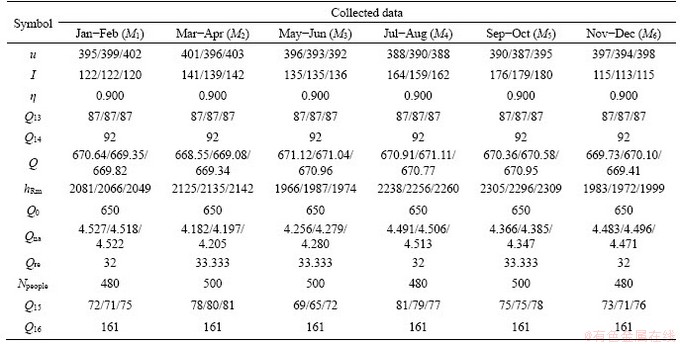
Table 5 Normalized values of evaluation indices
Continued
Because the data of each index have been collected and normalized, cloud descriptors can be calculated by Eq. (3). The calculation results of the cloud descriptors for each sample within 15 indices are listed in Table 6.
4.2 Clustering analysis for assessed mine during different periods
The results indicate that i2-i7, i10-i12 and i15 are positive indices and i8-i9 and i14 are negative indices. To confirm the category of indices i1 and i13, further analysis should be performed. For index i1, the fan will operate stably when the value of fi1 is within [0.5, 0.9) [40]. Therefore, index values that belong to [0.5, 0.7) are regarded positive, and index values that belong to [0.7, 0.9) are regarded negative. However, all values of i1 are within [0.7, 0.9) according to Table 7. Thus, i1 can be identified as a negative index. In regard to index i13, the value of fi13 is suggested as the range of [1.1, 1.15]. Because all values of index i13 are less than 1.1 (Table 8), it can be regarded a positive index. Subsequently, Eqs. (5)-(6) are used to perform the calculation and clustering analysis, and the similarity matrix D(0) is constructed (Eq. (32)).
 (32)
(32)
The maximal similarity of the similarity matrix D(0) can be identified as MAX(d(Cx, Cy))=D(0)(1, 2)=D(0)(2, 1) according to Eq. (32). The assessed samples M1 and M2 that correspond to the first line and second series are merged into the new category M7, and Eq. (8) is used to calculate the cloud descriptors of the new category. The similarity matrix D(1) is calculated by Eqs. (5) and (6) (Eq. (33)).
 (33)
(33)
The maximal similarity of the similarity matrix D(1) can be confirmed as MAX(d(Cx, Cy))=D(1)(1, 2)=D(1)(2, 1) according to Eq. (33), that is, the corresponding categories M3 and M7 can be merged into the new category M8. Similarly, the cloud descriptors of M8 are computed by Eq. (8), and the similarity matrix D(2) is calculated by Eqs. (5) and (6) (Eq. (34)).
 (34)
(34)
As shown in Eq. (34), the maximal similarity of the similarity matrix D(2) is MAX(d(Cx, Cy))= D(2)(2, 4)=D(2)(4, 2). Thus,M4 and M6 can be merged into the new category M9. Equations (8) and (5)-(6) are utilized to calculate the cloud descriptors of M9 and the similarity matrix D(3) (Eq. (35)), respectively.
 (35)
(35)
Equation (35) shows that the maximal similarity of the similarity matrix D(3) is MAX(d(Cx, Cy))=D(3)(1, 3)=D(3)(3, 1). Therefore, M5 and M8 are merged into the new category M10. Cloud descriptors of M10 and the similarity matrix D(4) (Eq. (36)) can be obtained by Eqs. (5), (6) and (8), respectively.
 (36)
(36)
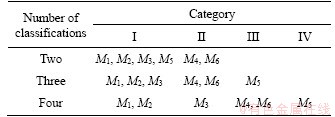
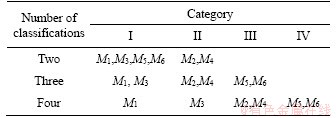
The clustering analysis results of the assessed samples can be performed based on these calculations. The clustering analysis results are classified as two categories (I & II), three categories (I & II & III) and four categories (I & II & III & IV). Detailed results are listed in Table 9.
Table 6 Calculation results of cloud descriptors
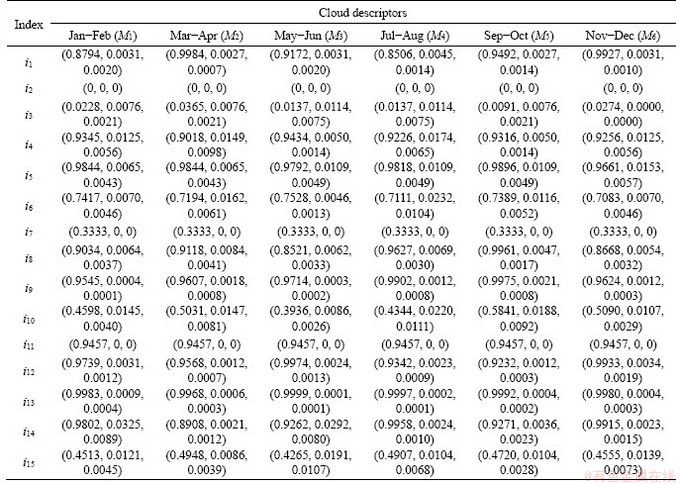
Table 7 Calculated values of index i1
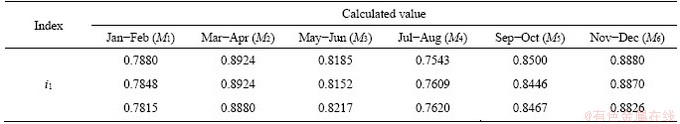
Table 8 Calculated values of index i13
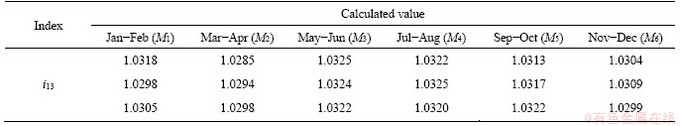
Table 9 Clustering analysis results
As shown in Table 10, the ventilation efficiency of the assessed underground copper mine for 6 different periods can be evaluated. The evaluation results will contribute to the more scientific and reasonable sorting of the ventilation efficiency. A valid assessment of the ventilation system can be achieved.
4.3 Verification of clustering analysis results
To verify the clustering analysis results, a forward cloud generator is utilized to generate normal clouds with respect to the assessed samples. The clustering analysis results will be verified by using the “3En rule” and analyzing the generated normal clouds. The ventilation efficiency of the assessed samples will be sorted in order of effectiveness. To ensure the applicability of the comparison, the index weights and cloud descriptors are employed from Tables 3 and 6, respectively. Normal clouds with respect to all assessed samples are generated by the forward cloud generator and Eq. (4). Similarly, indices i2-i7, i10-i13 and i15 are set as positive indices, while indices i1, i8-i9 and i14 are negative indices. Subsequently, the calculation results are shown in Table 10. The generated normal clouds are shown in Figure 5.
Table 10 Calculation results of normal clouds
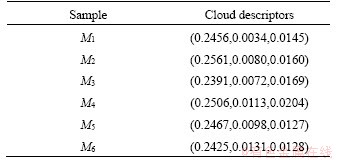
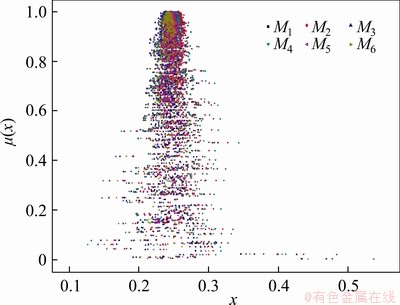
Figure 5 Generated normal clouds of assessed samples
A higher value of the positive index indicates a better evaluation result of the ventilation system. A lower value of the negative index also indicates a better evaluation result of the ventilation system. Therefore, the effectiveness of a ventilation system can be reflected by the calculated evaluation values. The larger the calculated evaluation value is, the higher the effectiveness of the ventilation system will be. As shown in Figure 5, the evaluation results with respect to each assessed sample are represented as normal clouds. However, visible differences cannot be identified. Therefore, the “3En rule” is employed to perform further analysis. The calculated ranges of the evaluation values of M1, M2, M3, M4, M5 and M6 are (0.2354, 0.2558), (0.2321, 0.2801), (0.2175, 0.2607), (0.2167, 0.2845), (0.2173, 0.2761) and (0.2032, 0.2818), respectively. These calculation results match the clustering analysis results. For example, the expectation value of M5 almost falls in between M4 and M6. However, the ranges of the evaluation values show that M4 is substantially closer to M6. Thus, M4 and M6 can be regarded as the same category, and the clustering analysis results show that M4 and M6 fall in the same category. Although the “3En rule” can help to classify the assessed samples, it has limitations in clustering analysis. For instance, the assessed samples can be classified by calculation of the evaluation value range; however, a more detailed classification cannot be obtained. As shown in Table 9, the assessed samples can be classified into three kinds of classifications, and each classification has a rational category that cannot be obtained only by the observation of normal clouds and the “3En rule”. In addition, it is necessary to verify the efficacy of CS based ED as it is a commonly used metric. Thus, Eq. (37) is introduced to make calculation of classical ED. In consideration of each index contains three sets of data. Average values of them should be used to calculate classical ED. Then classical ED values and corresponding similarity matrix  can be obtained (Eq. (38)).

 (37)
(37)
where TED denotes the classical ED; ai and bi denote average index value of the sample used to make clustering analysis.
 (38)
(38)
As it can be seen in Eq. (38), calculated results of classical ED are very different from values of CS based ED. It needs to be noted that the value of ED is distinctly within [-1, 1] as previously mentioned. Meanwhile, indices values used in Eq. (37) are within [0, 1] due to they have been normalized. Hence the value of classical ED is also distinctly within [-1, 1]. When the value of classical ED is closer to 0, the compared two samples are more similar. It is different from the definition of CS based ED (It has been mentioned previously that a higher similarity will be obtained when the value of CS based ED is near 1). Obviously, calculated classical values listed in Eq. (38) show that all classical EDs are close to 0. It can be inferred that all compared samples are relative more similar than that of results obtained by CMCA. This is because collected data related to each index are relatively close while each index only contains three sets of data. Therefore, classical ED cannot distinguish the difference of limited data. However, CM can use backward cloud generator to confirm the cloud descriptors based on the limited data. Then the randomness and fuzziness [35] of the limited data can be reflected according to cloud descriptors, and it will lead to a more reasonable clustering result. Because the evaluation of ventilation system is limited by actual conditions, collected data may not be massive. Hence the proposed CMCA will provide a more practical way to identify the difference of each assessed sample.
4.4 Comparison of CMCA with other clustering algorithms
In order to make further verification of the proposed CMCA, some newest clustering algorithms including set pair analysis (SPA) based clustering analysis [34, 44] and Chebyshev distance based clustering analysis [45] are introduced to make comparison. For the SPA based clustering analysis, normalized assessed data of each index in Table 5 are converted into the connection degree by Eq. (39) firstly [34]. Then similarity degrees of the connection degree for all samples are calculated, and clustering analysis can be made based on the calculation results of similarity degree. Similarity matrices  ,
,  and
and  are constructed and shown in Eqs. (40)-(42). Consequently, clustering analysis results are obtained and shown in Table 11.

 (39)
(39)
where μ denotes the connection degree; γ denotes the normalized assessed data related to each index; [α1, α2] denotes the value range of assessed data, owing to assessed data have been normalized, values of α1 and α2 are 0 and 1, respectively.
 (40)
(40)
 (41)
(41)
 (42)
(42)
Table 11 Clustering analysis results obtained by SPA based clustering analysis
With regard to the Chebyshev distance based clustering analysis, assessed data are also made normalized firstly. Then, Eq. (43) is employed to compute the Chebyshev distance of each assessed sample. Similarity matrices 
 and
and  can be obtained and shown as Eqs. (44)-(46), and clustering analysis results are confirmed and listed in Table 12.
 (43)
(43)
where dChebyshev(x,y) denotes the Chebyshev distance between sample x and y.
 (44)
(44)
 (45)
(45)
 (46)
(46)
Table 12 Clustering analysis results obtained by Chebyshev distance based clustering analysis
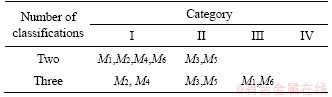
SPA based clustering analysis and CMCA both take advantage of the ED to measure the similarity of each assessed. The difference between these two methods focuses on the processing of assessed data. Assessed data are converted into connection degree to make clustering analysis. Meanwhile, assessed data are converted into cloud descriptors to make clustering analysis. Hence clustering analysis results obtained by above two methods are relatively similar. As it can be seen in Tables 9 and 11, assessed samples can be classified as four categories by both of two methods. In addition, sample M3 can be identified as a separate category. However, values shown in the similarity matrix obtained by SPA based clustering analysis are very close. It reflects that CM is more effective than SPA when dealing with the randomness and fuzziness of assessed data. For the Chebyshev distance based clustering analysis, assessed data are only made normalization. It is different from CMCA in the measurement of distance, i.e., Chebyshev distance. Obviously, clustering analysis results are totally different from the results obtained by CMCA. Moreover, assessed samples can just be classified as three categories. Although Chebyshev distance can confirm the maximum difference of each sample, it ignores the impact of data in all indices. As the evaluation of ventilation system of underground metal mine in alpine region has a large number of indices, each index and its corresponding assessed data need to be considered for the clustering analysis. Therefore, proposed CMCA is more able to meet the evaluation requirements.
4.5 Limitations and prospects
The approach proposed in this study can be utilized to process the ventilation data of a metal mine in the alpine region. In regard to the large amount of ventilation data, the CM-based clustering analysis can be used to convert and aggregate the data into cloud descriptors, and further evaluation of the assessed samples can be performed. The evaluation results show a distinct classification of the assessed samples. In contrast to the evaluation results that were obtained only using the CM, the proposed method can provide a more precise and detailed evaluation, that is, the ventilation effectiveness of the assessed sample is not only expressed by normal clouds and cloud descriptors but also analyzed based on the CS and ED. The classification of the ventilation effectiveness can be performed by clustering analysis. As shown in Table 9, the ventilation effectiveness of M4 and M6 can be regarded equivalent despite the variation in the number of classifications, and the ventilation effectiveness of M1, M2, M3 and M5 can be regarded as equivalent when the category is set to I and II. The evaluation results indicate the difference in ventilation effectiveness during the different periods and provide guidance for the management and maintenance of a ventilation system. However, the proposed CMCA cannot rank the ventilation effectiveness of the assessed samples. Thus, the evaluation results can reveal the clustering analysis results but cannot indicate the ranking of the assessed samples. Future work will focus on the algorithm of ranking the assessed samples to achieve a more comprehensive evaluation of the ventilation system. Continuous improvement of the evaluation index will be performed due to advancements in detection technology. The evaluation results can be more reasonable and valid, and the safe production of an underground metal mine in the alpine region of China will be promoted [46, 47].
5 Conclusions
The ventilation system in an underground metal mine is complex and technical. In this study, a novel method referred to as CMCA was proposed to perform an evaluation of the ventilation system of an underground metal mine in the alpine region. For the proposed method, the evaluation can be conducted without acquisition of any details of classification criteria. Collected data can be processed and converted into cloud descriptors by the CM. The CS based ED was proposed to conduct the clustering analysis of the assessed samples, and the clustering analysis of the assessed samples will lead to a scientific and reasonable evaluation result of the ventilation system.
A case study was conducted to verify the proposed method. With regard to the case study, ventilation data of the assessed underground metal mine in the alpine region were collected indifferent time periods. The evaluation results showed that the ventilation effectiveness during the different periods can be precisely classified. The CM was separately employed to perform an evaluation of the assessed samples. Through comparisons with the evaluation using only the CM, the validity of the proposed CMCA is verified. Differences of clustering analysis results between CS based ED and classical ED are analyzed and discussed. SPA based clustering analysis and Chebyshev distance based clustering analysis are employed to make comparison of proposed CMCA. Comparison results show that proposed CMCA is more able to meet the evaluation requirements with respect to the ventilation system of underground metal mine in alpine region.
Contributors
YAN Fang, HUANG Rui and GE Ji developed the overarching research goals. YAN Fang, LI Zi-jun and CAO Ri-hong provided the concept and edited the draft of manuscript. YAN Fang conducted the literature review and wrote the first draft of the manuscript. LI Zi-jun and XU Kai-li edited the draft of manuscript. DONG Long-jun and YAN Fang revised the manuscript.
Conflict of interest
YAN Fang, LI Zi-jun, DONG Long-jun, HUANG Rui, CAO Ri-hong, GE Ji and XU Kai-li declare that they have no conflict of interest.
References
[1] LI Z, SHAO S, SHI X P, SUN Y P, ZHANG X L. Structural transformation of manufacturing, natural resource dependence, and carbon emissions reduction: Evidence of a threshold from China [J]. J Clean Prod, 2019, 206: 920-927. DOI: 10.1016/j.jclepro.2018.09.241.
[2] YAO X W, ZHOU Z C, LI J S, ZHANG B H, ZHOU H D, XU K L. Experimental investigation of physicochemical and slagging characteristics of inorganic constituents in ash residues from gasification of different herbaceous biomass [J]. Energy, 2020, 198: 1-14. DOI: 10.1016/j.energy.2020. 117367.
[3] DONG L J, DENG S J, WANG F Y. Some developments and new insights for environmental sustainability and disaster control of tailings dam [J]. J Clean Prod, 2020, 269: 122270. DOI:10.1016/j.jclepro.2020.122270.
[4] QIAN D W, YAN C Z, XING Z P, XIU L N. Monitoring coal mine changes and their impact on landscape patterns in an alpine region: A case study of the Muli coal mine in the Qinghai-Tibet Plateau [J]. Environ Monit Assess, 2017, 189(11): 1-13. DOI: 10.1007/s10661-017-6284-9.
[5] WIDIATMOJO A, SASAKI K, SUGAI Y, SUZUKI Y, TANAKA H, UCHIDA K, MATSUMOTO H. Assessment of air dispersion characteristic in underground mine ventilation: Field measurement and numerical evaluation [J]. Process Saf Environ Protect, 2015, 93: 173-181. DOI: 10.1016/ j.psep.2014.04.001
[6] TANG Z X, YANG P. Research on oxygen-increasing ventilation in alpine region [C]// 3rd International Symposium on Modern Mining & Safety Technology. Fuxin, China, 2008.
[7] ZHANG Q, ZHOU G, QIAN X M, YUAN M Q, SUN Y L, WANG D. Diffuse pollution characteristics of respirable dust in fully-mechanized mining face under various velocities based on CFD investigation [J]. J Clean Prod, 2018, 184: 239-250. DOI:10.1016/j.jclepro.2018.02.230.
[8] DONG L J, SUN D Y, HAN G J, LI X B, HU Q C, SHU L. Velocity-free localization of autonomous driverless vehicles in underground intelligent mines [J]. IEEE Trans Veh Technol, 2020, 69(9): 9292-9303. DOI: 10.1109/ TVT.2020.2970842.
[9] DONG L J, HU Q C, TONG X J, LIU Y F. Velocity-free MS/AE source location method for Three-dimensional hole-containing structures [J]. Engineering, 2020, 6(7): 827-834. DOI:10.1016/j.eng.2019.12.016.
[10] NIE X X, WEI X B, LI X C, LU C W. Heat treatment and ventilation optimization in a deep mine [J]. Adv Civ Eng, 2018: 1-12. DOI:10.1155/2018/1529490.
[11] GHOSHDASTIDAR A J, HU Z Z, NAZARENKO Y, ARIYA P A. Exposure to nanoscale and microscale particulate air pollution prior to mining development near a northern indigenous community in Quebec, Canada [J]. Environ Sci Pollut Res, 2018: 25(9): 8976-8988. DOI: 10.1007/s11356-018- 1201-5.
[12] CAO R H, CAO P, LIN H. A kind of control technology for squeezing failure in deep roadways: A case study [J]. Geomat Nat Hazards Risk, 2017, 8(2): 1715-1729. DOI: 10.1080/ 19475705.2017.1385542.
[13] CHENG J W, YANG S Q. Data mining applications in evaluating mine ventilation system [J]. Safety Sci, 2017, 50(4): 918-922. DOI: 10.1016/j.ssci.2011.08.003.
[14] HUANG J X, LIU H Q, WANG H Q. Mine ventilation safety evaluation based on artificial neural network-fuzzy control theory [J]. Oxid Commun, 2016, 39(2A): 2026-2033.
[15] LEE D K. Optimal design of mine ventilation system using a ventilation improvement index [J]. J Min Sci, 2016, 52(4): 762-777. DOI: 10.1134/S1062739116041178.
[16] NEL A J H, VOSLOO J C, MATHEWS M J. Evaluating complex mine ventilation operational changes through simulations [J]. J Energy South Afr, 2018, 29(3): 22-32. DOI: 10.17159/2413-3051/2018/v29i3a4445.
[17] LIANG W Z, ZHAO G Y, LUO S Z. Selecting the optimal mine ventilation system via a decision making framework under hesitant [J]. Symmetry-Basel, 2018, 10(7): 283. DOI: 10.3390/sym10070283.
[18] ZHANG L M, WU X G, DING L Y, SKIBNIEWSKI M J. A novel model for risk assessment of adjacent buildings in tunneling environments [J]. Build Environ, 2013, 65: 185-194. DOI: 10.1016/j.buildenv.2013.04.008.
[19] LI Y X, QI L H, SONG Y S, HOU X H, LI H J. Quantitative characterization of carbon/carbon composites matrix texture based on image analysis using polarized light microscope [J]. Microsc Res Tech, 2015, 78(10): 908-917. DOI: 10.1002/jemt.22554.
[20] WANG D, LIU D F, DING H, SINGH V P, WANG Y K, ZENG X K, WU J C, WANG L C. A cloud model-based approach for water quality assessment [J]. Environ Res, 2016, 148: 24-35. DOI: 10.1016/j.envres.2016.03.005.
[21] LIU Z B, SHAO J F, XU W Y, XU F. Comprehensive stability evaluation of rock slope using the cloud model-based approach [J]. Rock Mech Rock Eng, 2014, 47(6): 2239-2252. DOI: 10.1007/s00603-013-0507-3.
[22] ZHANG W J, LIU S L, SUN B, LIU Y, PECHT M. A CM-based method for the analysis of accelerated life test data [J]. Microelectron Reliab, 2015, 55(1): 123-128. DOI: 10.1016/j.microrel.2014.10.006.
[23] YAN F, XU K L. A set pair analysis based layer of protection analysis and its application in quantitative risk assessment [J]. J Loss Prev Process Ind, 2018, 55: 313-319. DOI: 10.1016/j.jlp.2018.07.007.
[24] YAN F, XU K L. Methodology and case study of quantitative preliminary hazard analysis based on cloud model [J]. J Loss Prev Process Ind, 2109, 60: 116-124. DOI: 10.1016/ j.jlp.2019.04.013.
[25] XU Q W, XU K L, YAO X W. Safety assessment of petrochemical enterprise using the cloud model, PHA-LOPA and the bow-tie model [J]. R Soc Open Sci, 2018, 5(7): 2239-2252. DOI: 10.1098/rsos.180212.
[26] LI D Y, LIU C Y, GAN W Y. A new cognitive model: Cloud model [J]. Int J Intell Syst, 2019, 24(3): 357-375. DOI: 10.1002/int.20340.
[27] ZANG T L, WANG Y, HE Z Y, QIAN Q Q. Harmonic pollution level assessment in distribution system using extended cloud similarity measurement method [M]// Communications in Computer and Information Science. Singapore: Springer Singapore, 2017: 388-400. DOI: 10.1007/978-981-10-6388-6_32.
[28] XU Q W, XU K L. Quality evaluation of Chinese red wine based on cloud model [J]. J Food Biochem, 2019, 43(10): e12787. DOI: 10.1111/jfbc.12787.
[29] LU B B, CHARLTON M, BRUNSDON C, HARRIS P. The Minkowski approach for choosing the distance metric in geographically weighted regression [J]. Int J Geogr Inf Sci, 2016, 30(2): 351-368. DOI: 10.1080/13658816.2015. 1087001.
[30] XIAN S D, SUN W J, XU S H, GAO Y Y. Fuzzy linguistic induced OWA Minkowski distance operator and its application in group decision making [J]. Pattern Anal Appl, 2016, 19(2): 325-335. DOI: 10.1007/s10044-014-0397-3.
[31] KUMAR V, CARDIFF B, FLANAGAN M F. User-antenna selection for physical-layer network coding based on Euclidean distance [J]. IEEE Trans Commun, 2019, 67(5): 3363-3375. DOI: 10.1109/TCOMM.2019.2893642.
[32] MONTECHIESI L, COCCONCELLI M, RUBINI R. Artificial immune system via Euclidean distance minimization for anomaly detection in bearings [J]. Mech Syst Signal Proc, 2016, 76-77: 380-393. DOI: 10.1016/j.ymssp.2015.04.017.
[33] GOMEZ D, HERNANDEZ L A, YABOR L, BEEMSTER G T S, TEBBE C C, PAPENBROCK J, LORENZO J C. Euclidean distance can identify the mannitol level that produces the most remarkable integral effect on sugarcane micropropagation in temporary immersion bioreactors [J]. J Plant Res, 2018, 131(4): 719-724. DOI: 10.1007/s10265- 018-1028-7.
[34] YAN F, XU K L, LI D S, CUI Z K. A novel hazard assessment method for biomass gasification stations based on extended set pair analysis [J]. PLoS One, 2017, 12(9): e0185006. DOI: 10.1371/journal.pone.0185006.
[35] LI D Y, DU Y. Artificial intelligence with uncertainty [M]. Boca Raton: Chapman & Hall/CRC, 2017.
[36] WANG J Q, PENG J J, ZHANG H Y, LIU T, CHEN X H. An uncertain linguistic multi-criteria group decision-making method based on a cloud model [J]. Group Decis Negot, 2015, 24(1): 171-192. DOI: 10.1007/s10726-014-9385-7.
[37] WANG J Q, LU P, ZHANG H Y, CHEN X H. Method of multi-criteria group decision-making based on cloud aggregation operators with linguistic information [J]. Inf Sci, 2014, 274: 177-191. DOI: 10.1016/j.ins.2014.02.130.
[38] YAN F, JIN C, LI Z J, CAO R H, XU K L. Research and development of field theory-based three-dimensional risk assessment Part I: Optimization of risk reduction [J]. Saf Sci, 2019, 120: 312-322. DOI: 10.1016/j.ssci.2019.07.018.
[39] ZHANG J J, XU K L, RENIERS G, YOU G. Statistical analysis the characteristics of extraordinarily severe coal mine accidents (ESCMAs) in China from 1950 to 2018 [J]. Process Saf Environ Protect, 2020, 133: 332-340. DOI:10.1016/j.psep.2019.10.014.
[40] YANG P, LV W S. Research on ventilation and dust control technology of deep underground mine in alpine region [M]. Beijing: Metallurgical Industry Press, 2012. (in Chinese)
[41] GB 16423-2006. Safety regulations for metal and nonmetal mines [S]. (in Chinese)
[42] AQ 2013-2008. Ventilation technical standards for metal and nonmetal underground mines [S]. (in Chinese)
[43] GBZ/T 192.2-2007. Determination of dust in the air of workplace, Part 2: Respirable dust concentration [S]. (in Chinese)
[44] LI C H, SUN L, JIA J X, CAI Y P, WANG X. Risk assessment of water pollution sources based on an integrated k-means clustering and set pair analysis method in the region of Shiyan, China [J]. Sci Total Environ, 2016, 557: 307-316. DOI:10.1016/j.scitotenv.2016.03.069.
[45] RODRIGUES E O. Combining Minkowski and Chebyshev: New distance proposal and survey of distance metrics using k-nearest neighbours classifier [J]. Pattern Recognit Lett, 2018, 110: 66-71. DOI: 10.1016/j.patrec.2018.03.021.
[46] WANG B, WU C, KANG L G, RENIERS G, HUANG L. Work safety in China’s Thirteenth Five-Year plan period (2016-2020): Current status, new challenges and future tasks [J]. Saf Sci, 2018, 104: 164-178. DOI: 10.1016/j.ssci. 2018.01.012.
[47] GE J, XU K L, ZHENG X, YAO X W, XU Q W, ZHANG B H. The main challenges of safety science [J]. Saf Sci, 2019, 118: 119-125. DOI:10.1016/j.ssci.2019.05.006.
(Edited by HE Yun-bin)
中文导读
基于云聚类分析的高寒高海拔地区地下金属矿山通风系统评估
摘要:良好的通风系统对于高寒高海拔地下金属矿山意义重大,科学合理的评估可有效维护风机系统的性能。由于相关分类方法与标准的缺失,使得高寒高海拔地下金属矿山的风机系统评估难以进行,因此提出了一种名为云聚类分析的新评估方法。该方法首先采用云模型对风机系统待评估的数据进行前处理,并将它们转换为云描述符;然后,提出一种基于云相似度的欧氏距离并推导出其对应的算法,以此对各评估样本进行聚类分析;最后,根据聚类分析结果对评估样本进行科学分类,从而完成通风系统的评估。本文引入一个具体实例进行案例分析,分析结果显示云聚类分析法可以对风机效能进行有效分类,进而为通风系统的维护管理提供指导。此外,将单独采用云模型的评估结果与云聚类分析结果进行对比,验证云聚类分析的可用性与有效性。同时,对比分析传统欧式距离与基于云相似度的欧式距离,以及引入两种现有的聚类分析方法与本文所提方法进行比较研究,结果说明云聚类分析能够满足高海拔高寒地下金属矿山通风系统的评估需求。
关键词:通风系统;地下金属矿山;高寒高海拔;云模型;云相似度;欧氏距离
Foundation item: Project(2018YFC0808404) supported by National Key Research and Development Program of China
Received date: 2020-04-02; Accepted date: 2021-02-02
Corresponding author: LI Zi-jun, PhD, Professor; Tel: +86-731-88876524; E-mail: zijunli@csu.edu.cn; ORCID: https://orcid.org/ 0000-0002-5490-5943

