Face stability analysis for a longitudinally inclined tunnel in anisotropic cohesive soils
��Դ�ڿ������ϴ�ѧѧ��(Ӣ�İ�)2019���7��
�������ߣ�Ǯ�� ���� ���
����ҳ�룺1780 - 1793
Key words��limit analysis; tunnel face; cohesive soils; inclination angle; anisotropy
Abstract: A stability analysis approach of tunnel face considering a longitudinally inclined tunnel angle and anisotropic purely cohesive soils based on a continuous velocity field (CVF) is investigated in this study. Based on the kinematic approach of limit analysis and the discretization technique, an improved three-dimensional CVF model for longitudinally inclined tunnels driven by pressurized shields is proposed. With the proposed model, the critical support pressure acted on tunnel face is determined by the work-balance equation. A serial of finite element numerical models are conducted to validate the proposed model. Finally, the effects of tunnel inclination angles, several dimensionless parameters as well as soil anisotropy on the critical support pressure are investigated. The numerical results show that the effects of the soil anisotropy and the tunnel inclination angle on tunnel faces should be considered in the actual design of tunneling engineering.
Cite this article as: HUANG Qi, ZOU Jin-feng, QIAN Ze-hang. Face stability analysis for a longitudinally inclined tunnel in anisotropic cohesive soils [J]. Journal of Central South University, 2019, 26(7): 1780-1793. DOI: https://doi.org/10.1007/s11771-019-4133-4.

J. Cent. South Univ. (2019) 26: 1780-1793
DOI: https://doi.org/10.1007/s11771-019-4133-4

HUANG Qi(����), ZOU Jin-feng(���), QIAN Ze-hang(Ǯ��)
School of Civil Engineering, Central South University, Changsha 410075, China
 Central South University Press and Springer-Verlag GmbH Germany, part of Springer Nature 2019
Abstract: A stability analysis approach of tunnel face considering a longitudinally inclined tunnel angle and anisotropic purely cohesive soils based on a continuous velocity field (CVF) is investigated in this study. Based on the kinematic approach of limit analysis and the discretization technique, an improved three-dimensional CVF model for longitudinally inclined tunnels driven by pressurized shields is proposed. With the proposed model, the critical support pressure acted on tunnel face is determined by the work-balance equation. A serial of finite element numerical models are conducted to validate the proposed model. Finally, the effects of tunnel inclination angles, several dimensionless parameters as well as soil anisotropy on the critical support pressure are investigated. The numerical results show that the effects of the soil anisotropy and the tunnel inclination angle on tunnel faces should be considered in the actual design of tunneling engineering.
Key words: limit analysis; tunnel face; cohesive soils; inclination angle; anisotropy
Cite this article as: HUANG Qi, ZOU Jin-feng, QIAN Ze-hang. Face stability analysis for a longitudinally inclined tunnel in anisotropic cohesive soils [J]. Journal of Central South University, 2019, 26(7): 1780-1793. DOI: https://doi.org/10.1007/s11771-019-4133-4.
1 Introduction
Stability analysis for tunnel face and surrounding rock is more important during tunnel excavating and reinforcement designing [1-7]. This work only focuses on the stability analysis of tunnel face in low-permeability soils. When tunnels are excavated in low-permeability soils, one of the key issues requiring consideration is the short-term face stability. In such condition, if the soils tend to exhibit purely cohesive shear resistance (��=0), then they can be approximately regarded as the purely cohesive soils. Study of the face stability of tunnels driven by pressurized shields in purely cohesive soils has been investigated by many researchers using various methods, including experimental approaches, analytical solution, numerical approach and limit analysis method [8-10]. Recently, the upper bound limit analysis theorem is more popular because the rigorous upper bound of the limit state load of a system can be obtained by this approach and requires little time [11].
Based on the kinematical approach of limit analysis, numerous rigid block failure mechanisms [12, 13] are developed. To evaluate the critical support pressures of tunnel faces in purely cohesive soils, the fastest and straightforward way would be to assign a null to frictional angle in these existing failure mechanisms. However, neither the failure contours nor the results obtained from these mechanisms are well in agreement with the true situation. According to the results of centrifuge testing for collapse characteristics of tunnel faces in undrained clays [12-14], there is no obvious shear band within the soil masses. Namely, once a collapse occurs in purely cohesive soils, soil mass will move to tunnel face with a ��flow�� instead of a rigid movement.
Based on the phenomenon reported by SCHOFIELD [14], KLAR et al [8] and OSMAN et al [15] proposed the concept of continuous velocity fields based on elastic deformation fields to investigate the ground surface movement and the face stability number N in the tunnel excavation, respectively. However, because the velocity fields they chose were not perfectly adequate, the results obtained were not so satisfying. Besides, based on the results of deformation field in centrifuge tests and numerical analyses of undrained clays, MOLLON et al [16] emphasized the importance of the CVF concept and constructed two ingenious CVFs for collapse failure and blowout failure of tunnel faces. Compared with existing mechanisms proposed by other researchers, these velocity fields can provide better upper-bound solutions.
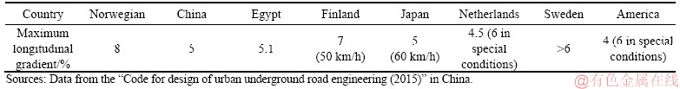
Although there are plenty of works that provide a reliable assessment of tunnel face stability, there is really little research about the stability of tunnel faces considering the effect of tunnel inclination angles. LING et al [17] pointed out that the determination of longitudinal gradients of tunnels is of great importance in the actual design phase. This importance is also paid attention to by the design standards of many countries as shown in Table 1. As shown in Table. 1, in China, the standard of the maximum longitudinal gradient in tunnels is 5%, but the maximum longitudinal gradient for the inclined shafts in tunnels can even reach up to 12.6%, such as the shafts in Guan-Jiao tunnel and Wu-Shao-Ling tunnel [18, 19]. Therefore, the effects of longitudinal gradients of tunnels on the stability of faces need to be studied.
In addition, the anisotropy of soils often exists in the practical geotechnical engineering such as slopes [20, 21] and foundations [22], and many works have been conducted by scholars. LEE et al [23] attributed the cause of anisotropy to the complex and anisotropic stress states of loading or unloading and AL-KARNI et al [20] attributed it to the cementation bonds [24]. As for the stability of tunnel faces, PAN et al [25] and LIANG et al [26] studied the anisotropy in frictional-cohesive soils, but few works have been done in purely cohesive soils. Thus, the effect of soil anisotropy on tunnel face stability in purely cohesive soils would be further addressed in this study.
To address the issue reported above, an improved advanced three-dimensional CVF considering inclined angles of tunnels and soil anisotropy is proposed in this work. By means of the work equation in upper bound theorem, the critical collapse and blowout support pressures can be determined. Then, to validate this limit analysis model, a serial of numerical models using ABAQUS are built for comparison. In the end, several parametric studies are conducted to investigate the effects of the longitudinal gradient and anisotropy on tunnel face stability in term of the critical collapse and blowout support pressures.
2 Upper bound limit analysis model
Limit analysis theorem is a more effective method for stability problems of geotechnical structures and widely used in geotechnical engineering [27-30]. Generally, the limit analysis theorem includes the upper bound and the lower bound theories. Lower bound theory involves a complex stress field, which is difficult to construct. By contrast, the upper bound theorem requires the so-called velocity field which is much simpler to be built and more practical than the stress field [31-33].
According to the upper bound theorem, when the velocity boundary condition is satisfied, the load derived by equating the external rate of work to the rate of energy dissipation in any kinematic admissible velocity field is no less than the actual critical load. For purely cohesive soils, satisfying the Tresca��s yield criterion, the work rate equation can be expressed as follows [11]:
 (1)
(1)
where Ti is the vector of surface traction acting on the boundary S; fi is the vector of body force acting on the volume V; vi is the velocity vector of the kinematically admissible velocity field;  is the maximal absolute value of the principal strain rate components; ��vi is the velocity jump across the discontinuity SD (there is no velocity discontinuity in the CVF).
Table 1 Summary of standards of maximum longitudinal gradients in different countries
In this section, an improved failure model will be established on the basis of the upper bound theorem. This model focuses on providing solutions (tunnel face pressures) for the face stability analysis of longitudinally inclined tunnels in anisotropic undrained clays.
2.1 Three-dimensional failure mechanism
As reported in Section 1, the CVFs proposed by MOLLON et al [16] can provide an excellent estimation of critical face pressures of tunnels driven in purely cohesive soils but only the horizontal tunnels are considered. Thus, the M2 velocity field (the maximum velocity locates at the lower 4/5 part of the tunnel face in the case of collapse and at the higher 4/5 part of the tunnel face in the case of blowout) with a toric envelope proposed by MOLLON et al [16] is adapted into an improved one to study the longitudinally inclined tunnel faces (the details can be seen in MOLLON et al [16] if the reader is interested in the M2 velocity field). Next, the details of this improved CVF would be demonstrated. As shown in Figure 1,to address this issue, an additional parameter, longitudinally inclined angle ��, is further introduced in this advanced CVF. This parameter implies that there is an angle �� between the tunnel face and the vertical direction. Besides, the buried depth and the tunnel diameter are denoted by C and D, respectively.
In Figure 1, the external envelope of the improved M2 velocity field is a torus which is composed of numerical radial planes ���� with various radiuses. The radiuses of the circles increase linearly from tunnel face to ground surface. A maximal velocity flow line �� is assumed so as to simulate the maximum radial velocity on each circle. This line is a circle whose radius is Rf=C/cos��+D/2+L1 about the origin O. The maximum velocity is located at the point of the invert and crown of the tunnel face for the case of collapse and blowout, respectively, so the L1 is a positive number in collapse condition and a negative one in blowout condition.
The key of the definition of the whole CVF is the determination of three velocity components of the CVF (i.e., v��, vr, v��). Thus, a curvilinear coordinate system with three dimensions (��, r, ��) is established here to describe these velocity components of this CVF. In Figure 1, the angle �� determines the location of Plane ���� and every point in Plane ���� can be described by the polar coordinates (r, ��) (Figure 2). As a result, each point in this mechanism can be solely determined by a three-dimensional coordinate (��, r, ��). Correspondingly, coordinate (v��, vr, v��) as below can describe the velocity vector of any point in this failure mechanism.
1) Orthoradial component v�� is regarded as a negligible value and assumed to be zero.
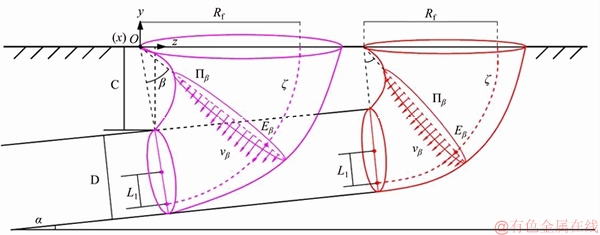
Figure 1 Layout of CVF for a longitudinally inclined tunnel
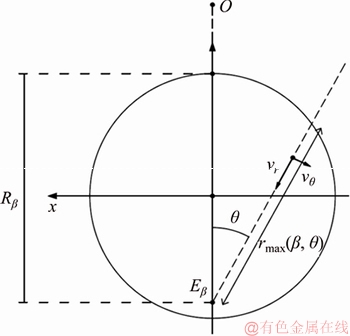
Figure 2 Layout of velocity field in radial plane ����
2) Axial component v�� is assumed to rotate around the X-axis. In the circular cross-sections ����, v�� is perpendicular to it and decreases in a radially parabolic way from points in the line �� to the edge of the envelope of the radial plane, as expressed in the first term of Eq. (2). Therefore, the value of v�� reaches a maximum in the point E�� and vanishes at the edge of the circular contour of the envelope.
3) Radial component vr is computed by the normality condition that there is no any change of volume when the plastic soil deformation occurs. This condition can be expressed by 
From the above, the velocity vector of any point in this mechanism can be determined by following equations,
 (2)
(2)
where �� varies from zero to ��/2-��.
Note that this proposed mechanism would be exactly degraded to the M2 CVF proposed by MOLLON et al [16] when the longitudinally inclined angle �� is set to zero. From Eq. (2), it can be found that the only unknown item of the velocity field is the radial velocity vr. This term would be calculated by a numerical discretization procedure, which is elaborated in the following section.
2.2 Anisotropy of soils
For the purpose of studying the anisotropy of purely cohesive soil by the proposed limit analysis model, in this section, the presentation of anisotropy will be determined. This is the preparation work for assigning the soil anisotropy to the proposed limit analysis model in the next step.
Because there is no friction angle in purely cohesive soils, the anisotropy only involves the variation of the cohesion strength cu, which means cu at a certain point has different values in different directions. Up to now, many types of research about anisotropy in regard to cohesion strength have been done [25]. A research conclusion generally acknowledged by investigators is that the soil anisotropy related to cohesion strength can be described approximately with the curve in Figure 3.
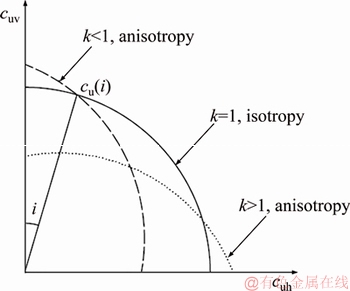
Figure 3 Variation of cohesion strength with direction
In Figure 3, the cu(i) means cohesion strength in the position where the angle between the major principal stress and the vertical direction is i. Its expression can be written as follows:
 (3)
(3)
where cuv is the vertical principal cohesion and cuh is the horizontal principal cohesion, respectively. Both of them can be determined by experimental methods.
In order to better estimate the degree of the anisotropy of soils intuitively, a factor k used to describe the anisotropy is defined by
 (4)
(4)
where different value of k represents soils with different characteristics; k=1 represents soils without anisotropy, k<1 represents clays with normal or mild overconsolidation, and k>1 represents clays with severe overconsolidation [25].
Substituting Eq. (4) into Eq. (3), the cohesion strength cu(i) is expressed as
 (5)
(5)
Applying the cohesion strength cu(i) into the proposed model, this indicates each point in the failure region should be assigned a particular cohesion strength, which depends on the inclination i. For undrained clays, the angle between the velocities and the directions of major principal stresses is assumed to be a constant ��/4 [4]. Hence, the anisotropic angle i can be computed as
 (6)
(6)
where f is the angle between the velocity vector and the vertical direction.
In order to calculate the value of f, the Cartesian coordinate of velocity vector need to be determined. In Figure 1, the whole mechanism can be expressed by a curvilinear coordinate system with three dimensions. The velocity of a point at any certain position can be described by coordinate (v��, vr, v��). If the curvilinear coordinate system is transformed into the Cartesian coordinate system, the velocity vector can be described as follows.
 (7)
(7)
Consequently, the angle f can be computed as
 (8)
(8)
With the simultaneous Eqs. (5)-(8), the cohesion strength cu(i) at any point in the proposed mechanism can be obtained. By this means, the anisotropy of soils can be perfectly involved in the proposed mechanism due to the discretization method.
2.3 Work rate equation
On the basis of upper bound theory, the work rate of external force should be equal to the work rate of internal energy dissipation as expressed by Eq. (1). For this proposed mechanism, each term in the Eq. (1) can be listed as: the work rates of the surface tractions include two sections, one of which is generated by the uniform pressure applied on the tunnel face (��t) and another is generated by possible surcharge loading applied on the ground surface (��s); the work rate of body force involves the soil unit weight ��; the energy dissipation rate only involves the deformation of the soil masses because the CVF does not have any velocity discontinuity.
Then, Eq. (1) can be expressed by
 (9)
(9)
where  is the work rate of the soil weight;
  is the work rate of the tunnel face pressure;
  is the work rate of the ground surface surcharge; and
  is the rate of energy dissipation.
Due to the quite complex calculation of the velocity, in order to compute each term in the Eq. (9), an explicit finite difference discretization method is employed in the Matlab environment. As shown in Figure 4, in order to make the code editing work easier, the mesh used for the discretization is a torus with a constant radius Rf. Thus, the torus is bigger than the failure mechanism and the whole failure mechanism is included in this torus. The torus is discretized in three directions ��, r and �� and the numbers of subdivisions in each direction are Nr, N��, and N��, respectively. In this way, an element of the discretized mesh can be described by the coordinate of the central point P(��, r, ��) and is bounded by six curved facets S1, S2, S3, 
 and
and 
With the method of discretization, each variable in the Eq. (9) can be calculated as follows.
1) Work rate generated by soil weight is expressed by
 (10)
(10)
2) Work rate generated by tunnel face pressure is expressed by
 (11)
(11)
3) Work rate generated by ground surface surcharge is expressed by
 (12)
(12)
4) Internal energy dissipation rate is expressed by
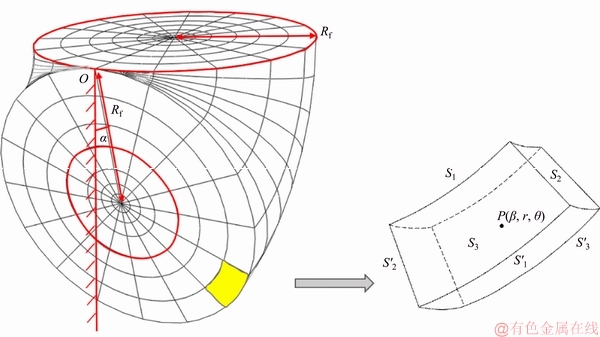
Figure 4 Discretized mesh used in procedure and detail of an element
 (13)
(13)
 (14)
(14)
where Nr, N�� and N�� are the subdivision numbers in the three dimensions ��, r and ��; �� is the soil unit weight; v is the velocity; V is the volume and S is the area; ��t is the pressure on the tunnel face, which will be denoted as ��c in the collapse condition and ��b in the blowout condition; ��s is the possible ground surface loading; cu(i) is the undrained cohesion related to the soil anisotropy;  is the maximal absolute value of the principal component of the plastic strain rate. Note that ��=0 in the Eq. (11) implies the tunnel face and ��=��/2-�� in the Eq. (12) implies the ground surface.
Substituting Eqs. (10)-(13) into Eq. (9), the limit tunnel face supporting pressure ��t can be determined as Eq. (14).
Noticing that the directions of the face pressure and the velocities are opposite in collapse condition and identical in blowout condition, the obtained critical collapse support pressure ��c is a rigorous lower bound of the exact limit and the calculated critical blowout support pressure ��b is a rigorous upper bound of the exact limit.
The calculation of the critical support pressures of collapse and blowout is conducted by a computer program coded in Matlab and each calculation process just takes dozens of seconds.
3 Validation
To validate the proposed model, a serial of numerical models are constructed for comparison. The numerical model is displayed in Figure 5. Due to the symmetry, only half of the tunnel is simulated in this study. Note that the numerical model only involves the isotropic undrained clay whose anisotropic factor k equals to 1. The model dimensions of the tunnel with a diameter D=10 m and a cover to depth ratio C/D ranging from 0.5 to 3.0 are 5C��4C��(C+15) in the transversal, longitudinal, and vertical directions, respectively. The tunnel is excavated at a longitudinally inclined angle �� ranging from -10�� to 10��. The elastic properties are set to E=240 MPa and v=0.49. The selected value of elastic modulus E is high because it can improve the computation speed without leading to significant influences on the critical support pressure [34]. About the plastic property, Mohr-Coulomb criterion with ��=0��, which is equivalent to the Tresca failure criterion, is adopted. In this model, when the excavation is conducted, the soil mass would be entirely removed and the lining would be installed instantly. Because this study only focuses on the determination of the collapse and blowout support pressures in the ultimate limit state, the cylindrical lining in this model is set as completely rigid and has fully fixed boundary constraints in all directions.
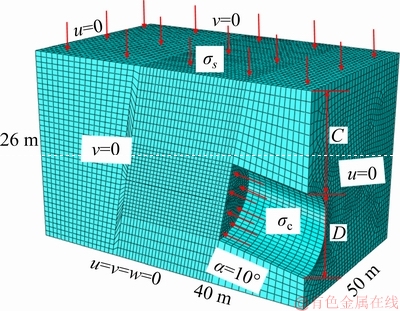
Figure 5 Numerical model for analysis of face collapse and blowout
When this numerical model is used to simulate the collapse failure, the pressure exerted on the tunnel face would be set to a relatively high value (would not lead to a blowout failure) at first. Then, the pressure begins to decrease gradually. Once the displacement of a serial of nodes whose deformations are the highest (IBRAHIM E et al [35] suggested that it is more appropriate to choose a few points within the collapsing body than a single control point at the tunnel face) increases sharply and the software solver fails to converge, the critical collapse support pressure is obtained. Similarly, when it is used to simulate the blowout failure, the pressure exerted on the tunnel face would begin with a relatively low one and increase gradually. Once the displacement of the characteristic nodes increases sharply, the critical blowout support pressure is obtained, which means that the model transfers from the serviceability limit state to the ultimate limit state.
To better illustrate this process, an example of tunnel with a D=10 m, a C=10 m and a 10�� longitudinal inclination is considered here. The original value of the supporting pressure is set to 150 kPa and the corresponding displacement of the characteristic node is small. Then in order to accelerate the computation speed, the supporting pressure is set to decrease with a relatively large decreasing increment, and when the supporting pressure is close to the critical collapse support pressure, the decreasing increment is limited to 0.1 kPa so as to guarantee the precision. As shown in Figure 6, the graph of the relationship between the supporting pressure and the displacement of the characteristic node (the node where the maximal displacement occurs is adopted hereinafter as a representative control node) in this process is plotted to determine the critical support pressure. It can be seen from this Figure that when the supporting pressure decreases from 137.5 kPa to 137.4 kPa, the displacement of the characteristic node drops sharply from 19.86 cm to 25.56 cm. This sharp drop means that the state of the soil ahead of the tunnel face changes from the serviceability limit state to the ultimate limit state (i.e., the soil failure, for which the software solver could not converge in the end). Therefore, the critical collapse support pressure 137.5 kPa is determined in this case.
Through this technique, the critical support pressures in different conditions can be obtained. Figures 7 and 8 present the comparison between the proposed approach and the numerical model in terms of the collapse and the blowout critical support pressures, respectively. The values of the used parameters are as follows: D=10 m, ��=-10�� and 10��, cu=20 kPa and 30 kPa. (If ��=0��, the proposed model would drop to the model for the longitudinally horizontal tunnel proposed by MOLLON et al [16]) From Figures 7 and 8, the proposed approach is in agreement with the numerical model on the whole. The results of collapse support pressure computed by the proposed approach are quite satisfying, especially when C/D is small. The results of blowout pressure computed by the proposed approach are a bit less good but the maximal difference between the proposed model and the numerical model is limited to 15.8%. All in all, the results curves obtained by the proposed mechanism have the same trend as that of the numerical model and the differences are within an acceptable level.
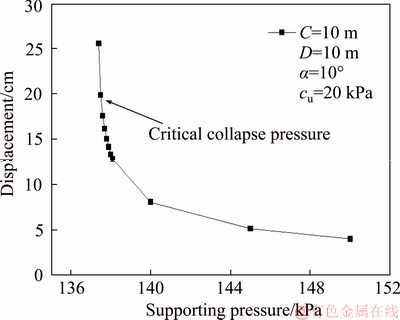
Figure 6 Curve of supporting pressure-displacement for control point of tunnel faces
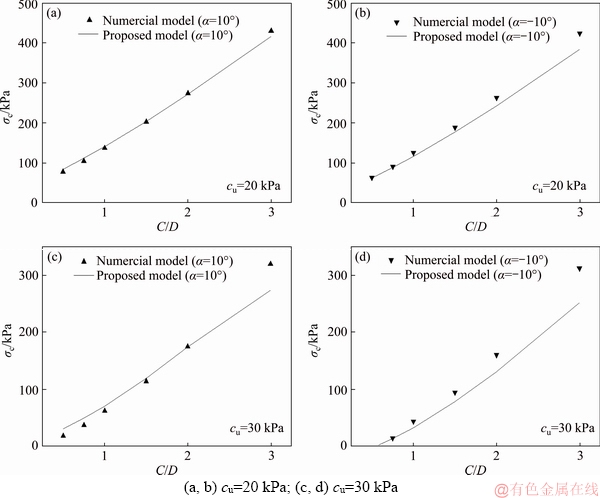
Figure 7 Comparison for critical collapse pressures:
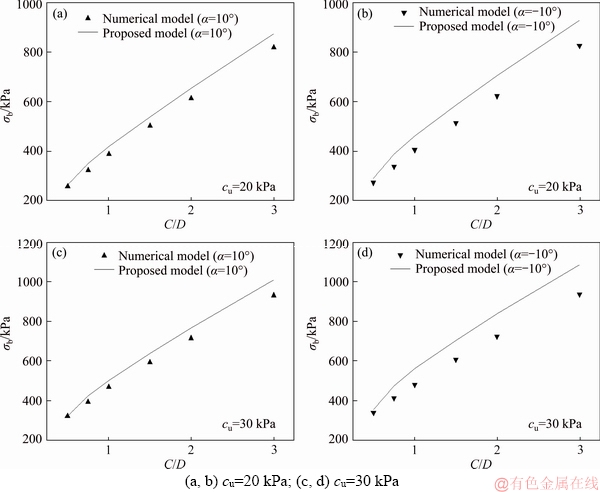
Figure 8 Comparison for critical blowout pressures:
Besides, according to the upper-bound theorem, the upper bound solution of the collapse support pressure should be lower than the exact one (here is the result obtained from the numerical simulation) [35].
However, as shown in Figure 7, there is an anomaly that the critical collapse support pressures achieved from numerical models are smaller than those obtained by the proposed mechanism when the values of C/D are very small. This anomaly can be attributed to the mesh density and fineness in the numerical model [35].
4 Numerical results
4.1 Effect of longitudinal gradient on face pressure
The influences of the tunnel inclination angle �� and several dimensionless parameters on the critical support pressure (e.g., dimensionless parameters C/D, ��D/cu, ��s/cu, and L/D on the dimensionless numbers ��c/cu and ��b/cu) are investigated here. The results are shown as follows.
4.1.1 Collapse support pressure ��c
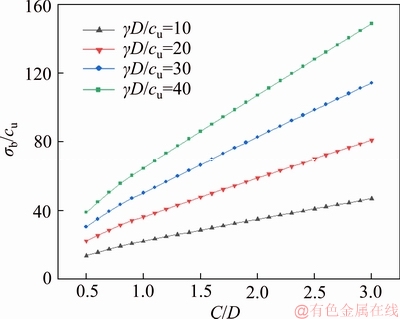
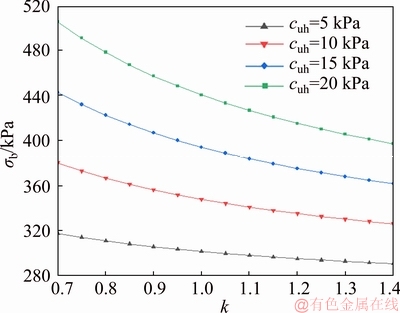
Figure 9 shows the ��c/cu against C/D for different dimensionless parameter ��D/cu corresponding to k=1, C/D=0.5-3.0, ��D/cu=10-40, ��s/cu= 0 and ��=10��.
As can be seen from Figure 9, ��c/cu increases linearly with C/D increasing, which is totally different from frictional-cohesive soils (c-��). Note that no obvious arching effect is found for purely cohesive soils in this study. This is because as the C/D increases, the improved failure mechanism continues to expand and always reaches the ground surface. In contrast, when considering the frictional-cohesive soils, with increasing of C/D from a small value, ��c/cu first increases and then reaches a certain constant because of the arching effect. When C/D is a relatively small value, the range of failure mechanism in frictional-cohesive soils reaches the ground. When C/D is bigger than a particular value, the failure mechanism is entirely buried underground. The arching effect makes the C/D no longer affect the critical support pressure anymore [13]. Figure 9 also demonstrates the influence of ��D/cu on ��c/cu. The ��c/cu increases nonlinearly with increasing ��D/cu.
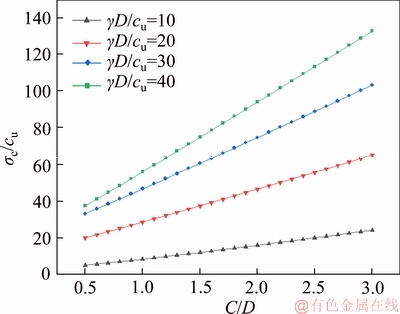
Figure 9 ��c/cu versus C/D for various ��D/cu
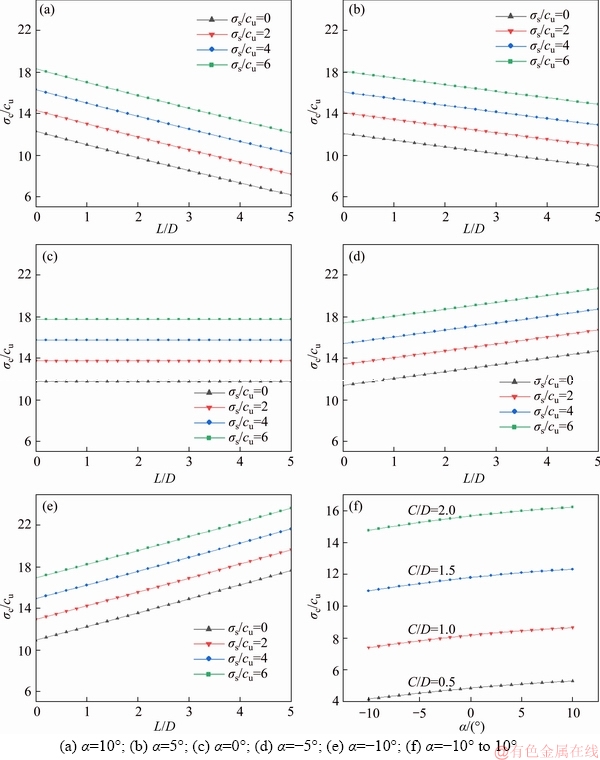
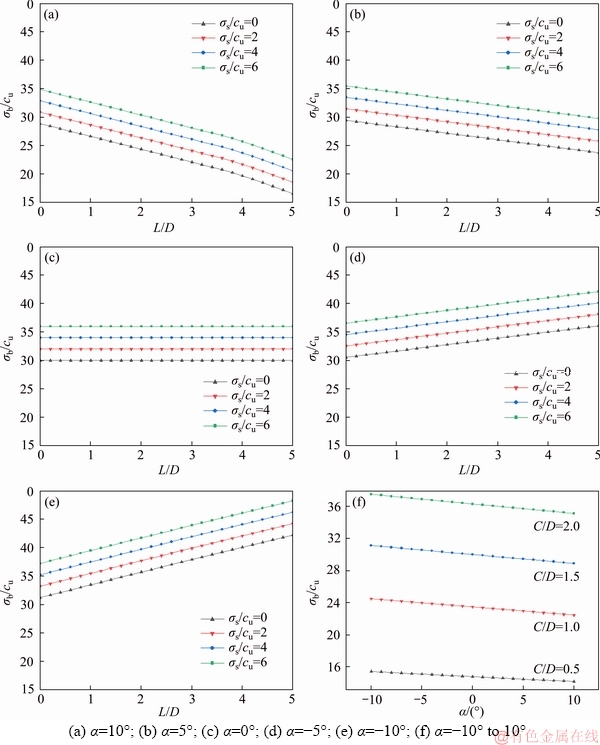
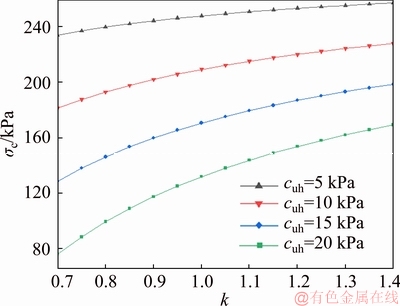
Figures 10(a) to (e) shows the ��c/cu against the L/D for various values of �� and ��s/cu corresponding to k=1, L/D=0-5, ��D/cu=10, ��s/cu=0-6, ��=-10��-10�� and C/D=1.5. Tunnel depth C is assigned as 15 m at the beginning of the excavation process and tunnelling length L varies from 0 m to 75 m. Based on this assumption, the tunnel face never reaches the ground surface even when ��=10�� and L=75 m because of Lsin��=13.02 m Figure 10 ��c/cu versus L/D for various ��: No matter what value the tunnel angle �� is, there is a rigorously linear correlation between ��c/cu and ��s/cu. The reason for this phenomenon is given as below. Once �� is determined, the failure region in this proposed model is determined subsequently. Namely, the failure area on the ground surface is determined and then the work rate of ground overload changes linearly with ��s (Eq. (12)), which leads to such a linear correlation between the ��c/cu and ��s/cu (Eq. (14)). Besides, Figure 10(f) shows that the ��c/cu increases with increasing of �� nonlinearly. 4.1.2 Blowout support pressure ��b Figure 11 shows the ��b/cu against C/D for various ��D/cu corresponding to k=1, C/D=0.5-3.0, ��D/cu=10-40, ��s/cu=0, and ��=10o. As shown in Figure 11, the ��b/cu almost varies linearly with C/D. In this proposed model, the blowout failure has the same failure region as the collapse failure. When C/D increases, the envelope of failure mechanism increases significantly and the ��b/cu increases subsequently. ��b/cu varies linearly with ��D/cu too. Figure 11 ��b/cu versus C/D for various ��D/cu Figures 12(a) to (e) shows the ��b/cu against the L/D for various values of �� and ��s/cu corresponding to k=1, L/D=0-5, ��D/cu=10, ��s/cu=0-6, ��=-10�� to 10�� and C/D=1.5. Figure 12(f) demonstrates the effects of �� on the critical blowout support pressure. According to Figures 12(a) to (e), with increasing of L/D, ��b/cu decreases linearly when �� is a positive number and increases linearly when �� is a negative number. When ��=10�� and L/D ranges between 0 and 5, the biggest difference of results is 42.6% which occurs in the case of ��s/cu=0. When ��=-10�� and L/D ranges between 0 and 5, the biggest difference of results is 35.3% which occurs in the case of ��s/cu=0. When ��=0�� (i.e. the longitudinally horizontal tunnel), the length L does not affect the results. Figure 12 ��b/cu versus L/D for various ��: It can be found from Figures 10(f) and 12(f) that in the case of a tunnel buried in a certain depth, when this tunnel is excavated upgrade, the critical collapse support pressure will be bigger than it in a horizontal tunnel; When this tunnel is excavated downgrade, the critical collapse support pressure will be smaller than it in a horizontal tunnel. 4.2 Effect of anisotropy on face pressure 4.2.1 Collapse support pressure Figure 13 shows the collapse support pressure ��c versus the cohesion anisotropic factor k for various horizontal principal cohesion strength cuh. In this work, the ranges of k are from 0.7 to 1.4 for the case of D=10 m, C/D=1, ��=18 kN/m3, cuh=5 kPa-20 kPa, ��=0. Figure 13 Collapse support pressure ��c versus cohesion anisotropic factor k for various cohesion strength cuh As seen in Figure 13, it is obvious that the anisotropy has significant influences on the critical collapse support pressures. The collapse support pressure increases with the increasing of anisotropic factors k. When the value of cohesion strength cuh is relatively small, the collapse support pressure increases slightly. When the value of cohesion strength cuh is large, the collapse support pressure increases quite rapidly. In the condition of cuh=5 kPa, the difference of ��c is 6.0% when k varies from 0.7 to 1.0 and 3.8% when k varies from 1.0 to 1.4. In the condition of cuh=20 kPa, the difference of ��c is 73.6% when k varies from 0.7 to 1.0 and 28.3% when k varies from 1.0 to 1.4. As shown in Figure 13, in actual tunnel excavation, if the anisotropy is not considered, the collapse support pressure is overestimated when k<1 and underestimated when k>1. Note that overestimation will result in extra cost and underestimation will increase the risk of collapse, especially when the value of cuh is large. Both of the cases should be avoided. Hence, attention should be paid to the anisotropy in practical engineering projects. 4.2.2 Blowout support pressure Figure 14 shows the blowout support pressure ��b versus the cohesion anisotropic factor k for various horizontal principal cohesion strength cuh. In this work, the ranges of k are from 0.7 to 1.4. The other parameters are as follows: D=10 m, C/D=1, ��=18 kN/m3, cuh=5 kPa-20 kPa, ��=0. Figure 14 Blowout blowout pressure ��b versus the cohesion anisotropic factor k for various cohesion strength cuh As seen in Figure 14, it is obvious that the anisotropy has significant influences on the critical blowout support pressures too. The blowout support pressure decreases with the increasing of anisotropic factors k. When the value of cohesion strength cuh is relatively small, the blowout support pressure decreases slightly. When the value of cohesion strength cuh is large, the blowout support pressure decreases rapidly. In the condition of cuh= 5 kPa, the difference of ��b is 5.1% when k varies from 0.7 to 1.0 and 3.6% when k varies from 1.0 to 1.4. In the condition of cuh=20 kPa, the difference of ��b is 12.8% when k varies from 0.7 to 1.0 and 9.8% when k varies from 1.0 to 1.4. As shown in Figure 14, in actual tunnel excavation, if the anisotropy is not considered, the blowout support pressure is underestimated when k<1 and overestimated when k>1. Overestimation may result in the occurrence of a blowout. 5 Conclusions Based on the upper bound limit analysis theory, an improved three-dimensional CVF is proposed to investigate the tunnel face stability of a longitudinally inclined tunnel in anisotropic purely cohesive soils. Compared with existing analytical methods, the proposed mechanism has three main advantages as follows: 1) Because of the discretization technique, it can be extended to investigate soils with the spatially various properties such as nonhomogeneity or anisotropy. 2) It is really time-saving and each calculation process only costs dozens of seconds. Thus, it can be expediently applied in practice and provide rapid evaluation of the critical pressures in both collapse and blowout conditions. 3) The proposed model can be extended to do the reliability analysis of tunnel face stability by incorporating the Monte-Carlo Simulations directly because of its time-saving. By means of the proposed mechanism, the numerical results obtained show that the longitudinal inclination and the soil anisotropy should be taken into account in actual tunneling engineering. References [1] WANG Hui, ZHENG Peng-qiang, ZHAO Wen-juan, TIAN Hong-ming. Application of a combined supporting technology with U-shaped steel support and anchor-grouting to surrounding soft rock reinforcement in roadway [J]. Journal of Central South University, 2018, 25(5): 1240-1250. [2] YANG Zi-han, ZHANG Rui, XU Jing-shu, YANG Xiao-li. Energy analysis of rock plug thickness in karst tunnels based on non-associated flow rule and nonlinear failure criterion [J]. Journal of Central South University, 2017, 24(12): 2940-2950. [3] ZOU Jin-feng, QIAN Ze-hang, XIANG Xin-hai, CHEN Guang-hui. Face stability of a tunnel excavated in saturated nonhomogeneous soils [J]. Tunnelling and Underground Space Technology, 2019, 83(1): 1-17. [4] ZOU Jin-feng, ZHANG Peng-hao. Analytical model of fully grouted bolts in pull-out tests and in situ rock masses [J]. International Journal of Rock Mechanics and Mining Sciences, 2019, 113(1): 278-294. [5] YANG Xiao-li, LIU Zeng-an. Reliability analysis of three- dimensional rock slope [J]. Geomechanics and Engineering, 2018, 15(6): 1183-1191. [6] WANG Ling, ZOU Jin-feng, SHENG Yu-ming. An improved stress and strain-increment-approaches for circular tunnel in strain-softening surrounding rock considering the seepage force [J]. Advances in Materials Science and Engineering. 2019. [7] ZOU Jin-feng, WANG Feng, WEI An. A semi-analytical solution for shallow tunnels with radius-iterative-approach in semi-infinite space [J]. Applied Mathematical Modelling, 2019, 73: 285-302. [8] KLAR A, OSMAN A S, BOLTON M D. 2D and 3D upper bound solutions for tunnel excavation using ��elastic�� flow fields [J]. International Journal for Numerical and Analytical Methods in Geomechanics, 2007, 31(12): 1367-1374. [9] PAN Qiu-jing, DIAS D. Upper-bound analysis on the face stability of a non-circular tunnel [J]. Tunnelling and Underground Space Technology, 2017, 62: 96-102. [10] ZHANG Fei, GAO Yu-feng, WU Yong-xin, WANG Zheng-xing. Face stability analysis of large-diameter slurry shield-driven tunnels with linearly increasing undrained strength [J]. Tunnelling and Underground Space Technology, 2018, 78: 178-187. [11] CHEN W F. Limit analysis and soil plasticity [M]. Amsterdam: Elsevier, 1975. [12] CHEN Guang-hui, ZOU Jin-feng, QIAN Ze-hang. An improved collapse analysis mechanism for the face stability of shield tunnel in layered soils [J]. Geomechanics and Engineering, 2019, 17(1): 97-107. [13] ZOU Jin-feng, CHEN Guang-hui, QIAN Ze-hang. Tunnel face stability in cohesion-frictional soils considering the soil arching effect by improved failure models [J]. Computers & Geotechnics, 2019, 106(2): 1-17. [14] SCHOFIELD A N. Cambridge geotechnical centrifuge operations [J]. G��otechnique, 1980, 30(3): 227-268. [15] OSMAN A S, MAIR R J, BOLTON M D. On the kinematics of 2D tunnel collapse in undrained clay [J]. G��otechnique, 2006, 56(9): 585-595. [16] MOLLON G, DIAS D, SOUBRA A H. Continuous velocity fields for collapse and blowout of a pressurized tunnel face in purely cohesive soil [J]. International Journal for Numerical and Analytical Methods in Geomechanics, 2012, 37(13): 2061-2083. [17] LING Ding-xiang, GUO Li-ping, HE Yao. Influence of longitudinal slope on the lighting design of entrance section of urban underground tunnel [J]. Modern Transportation Technology, 2018, 15(6): 35-39. (in Chinese) [18] CHEN Guang-hui, ZOU Jin-feng, MIN Qi, GUO Wu-jun, ZHANG Tai-zhong. Face stability analysis of a shallowsquare tunnel in non-homogeneous soils [J]. Computers & Geotechnics, 2019, 114: 103-112. [19] ZOU Jin-feng, YANG Tao, WANG Ling, GUO Wu-jun, HUANG Fa-ling. A numerical stepwise approach for cavityexpansion problem in strain-softening rock or soil mass [J]. Geomechanics and Engineering, 2019, 18(3): 225-234. [20] AL-KARNI A A, AL-SHAMRANI M A. Study of the effect of soil anisotropy on slope stability using method of slices [J]. Computers & Geotechnics, 2000, 26(2): 83-103. [21] TOYOTA H, SUSAMI A, TAKADA S. Anisotropy of undrained shear strength induced by K0 consolidation and swelling in cohesive soils [J]. International Journal of Mechanics, 2014, 14(2):04014019. [22] REDDY A S, RAO K N. Bearing capacity of strip footing on anisotropic and nonhomogeneous clays [J]. Soils and Foundations, 1981, 21(1): 1-6. [23] LEE K M, ROWE R K. Effects of undrained strength anisotropy on surface subsidences induced by the construction of shallow tunnels [J]. Canadian Geotechnical Journal, 1989, 26(2): 279-291. [24] ZHOU Zhong, XING Kai, YANG Hao, WANG Hao. Experimental analysis of damage mechanism of soil-rock mixture after freeze-thaw cycles [J]. Journal of Central South University, 2019, 26(1): 13-24. [25] PAN Qiu-jing, DIAS D. Face stability analysis for a shield-driven tunnel in anisotropic and nonhomogeneous soils by the kinematical approach [J]. International Journal of Mechanics, 2015, 16(3): 04015076. [26] LIANG Qiao, YAO Cong, XU Jing-shu. Upper bound stability analysis of shield tunnel face in nonhomogeneous and anisotropic soils [J]. Indian Geotechnical Journal, 2017, 47(3): 338-348. [27] XU Jing-shu, YANG Xiao-li. Seismic stability of 3D soil slope reinforced by geosynthetic with nonlinear failure criterion [J]. Soil Dynamics and Earthquake Engineering, 2019, 118: 86-97. [28] LI Yong-xin, YANG Xiao-li. Soil-slope stability considering effect of soil-strength nonlinearity [J]. International Journal of Geomechanics, 2019, 19(3): 04018201. [29] LI Zheng-wei, YANG Xiao-li. Active earth thrust considering tension crack, pore-water pressure and soil nonlinearity [J]. KSCE Journal of Civil Engineering, 2019, 23(1): 56-62. [30] LUO W J, YANG Xiao-li. 3D stability of shallow cavity roof with arbitrary profile under influence of pore water pressure [J]. Geomechanics and Engineering, 2018, 16(6): 569-575. [31] RANJBAR KARKANAKI A, GANJIAN N, ASKARI F. Pseudo-static analysis of cantilever retaining walls using upper bound limit analysis approach [J]. Journal of Central South University, 2019, 26(1): 241-255. [32] ZOU Jin-feng, LIU Shi-xiong, LI Jin-bo, QIAN Ze-hang. Face stability analysis for a shield-driven tunnel with non-linear yield criterion [J]. Proceedings of the Institution of Civil Engineers - Geotechnical Engineering, 2019, 172(3): 243-254. DOI: https://doi.org/10.1680/jgeen.17.00222. [33] ZHAO Lian-heng, TAN Yi-gao, NIE Zhi-hong, YANG Xin-ping, HU Shi-hong. Variation analysis of ultimate pullout capacity of shallow horizontal strip anchor plate with 2-layer overlying soil based on nonlinear M-C failure criterion [J]. Journal of Central South University, 2018, 25(11): 2802-2818. [34] UKRITCHON B, YINGCHALOENKITKHAJORN K, KEAWSAWASVONG S. Three-dimensional undrained tunnel face stability in clay with a linearly increasing shear strength with depth [J]. Computers & Geotechnics, 2017, 88: 146-151. [35] IBRAHIM E, SOUBRA A H, MOLLON G, RAPHAEL W, DIAS D, REDA A. Three-dimensional face stability analysis of pressurized tunnels driven in a multilayered purely frictional medium [J]. Tunnelling and Underground Space Technology, 2015, 49: 18-34. (Edited by HE Yun-bin) ���ĵ��� �������Դ��������������б�����������ȶ��Է��� ժҪ�����������ٶȳ�(CVF)�������о���һ�ֿ�������������б�Ǻʹ�����������Ե������������ȶ��Է������������ȣ����Ľ�ϼ�����������ɢ�������������һ�־�ѹ�ܹ�ʩ���µ�������б�����Ľ���ά�����ٶȳ�ģ�͡�Ȼ���ڸ�ģ�ͣ������������������ϵ��ٽ�֧��ѹ������ͨ������ƽ�ⷽ�̼���ȷ����ͬʱ������һϵ������Ԫ��ֵģ������ά�����ٶȳ�ģ�ͽ��жԱȣ������֤�˸Ľ��������ٶȳ�ģ�͵���ȷ�ԡ�������о���������ǡ�һЩ�����ٲ����Լ�����������Զ��ٽ�֧��ѹ����Ӱ�졣������������������̵�ʵ������У�Ӧ��������������Ժ�������Ƕ������������Ӱ�졣 �ؼ��ʣ��������������������棻���������б�ǣ��������� Foundation item: Project(2017YFB1201204) supported by the National Key Research and Development Program of China Received date: 2019-02-25; Accepted date: 2019-03-18 Corresponding author: QIAN Ze-hang, PhD Candidate; Tel: +86-15200806569; E-mail: 15200806569@163.com; ORCID: 0000-0002- 5333-0113