
J. Cent. South Univ. (2019) 26: 1735-1746
DOI: https://doi.org/10.1007/s11771-019-4129-0

Tunnel face reliability analysis using active learning Kriging modelЁDCase of a two-layer soils
LI Tian-zheng(АоМмХэ)1, DIAS Daniel2
1. School of Civil Engineering, Central South University, Changsha 410075, China;
2. Antea Group, Antony, France
 Central South University Press and Springer-Verlag GmbH Germany, part of Springer Nature 2019
Abstract: This paper is devoted to the probabilistic stability analysis of a tunnel face excavated in a two-layer soil. The interface of the soil layers is assumed to be positioned above the tunnel roof. In the framework of limit analysis, a rotational failure mechanism is adopted to describe the face failure considering different shear strength parameters in the two layers. The surrogate Kriging model is introduced to replace the actual performance function to perform a Monte Carlo simulation. An active learning function is used to train the Kriging model which can ensure an efficient tunnel face failure probability prediction without loss of accuracy. The deterministic stability analysis is given to validate the proposed tunnel face failure model. Subsequently, the number of initial sampling points, the correlation coefficient, the distribution type and the coefficient of variability of random variables are discussed to show their influences on the failure probability. The proposed approach is an advisable alternative for the tunnel face stability assessment and can provide guidance for tunnel design.
Key words: reliability analysis; tunnel face; Kriging model; active learning function; failure probability
Cite this article as: LI Tian-zheng, DIAS Daniel. Tunnel face reliability analysis using active learning Kriging modelЁDCase of a two-layer soils [J]. Journal of Central South University, 2019, 26(7): 1735-1746. DOI: https://doi.org/10.1007/s11771-019-4129-0.
1 Introduction
Face stability is an important issue for tunnel constructions. As tunnels are underground excavations, the uncertainties of geo-materials and surroundings are complex which leads also to uncertainties on the tunnel face stability assessment. In the framework of the limit analysis, several failure models of tunnel face were introduced which can be roughly divided into two categories, namely the translational failure mechanism and rotational failure mechanism [1, 2]. LECA and DORMIEUX [3] investigated the critical face pressure by dividing the failure blocks ahead of tunnel face into one or two blocks. The blocks slide along the velocity discontinuities. MICHALOWSKI and DRESCHER [4] introduced a class of kinematically admissible rotational failure mechanism whose upper and lower boundaries were defined by log-spirals. Different from the former, the failure block was regarded as a whole one rotating around the center and the motion was defined by the parameter of angular velocity. MOLLON et al [5] proposed a new rotational failure mechanism based on the spatial discretization technique. As the failure block was generated point by point, t his approach was able to handle face stability problems in more complex conditions, such as spatially discretized pore water pressure applied to the tunnel face, depth-dependent shear strength parameters and so on. PAN and DIAS [6] extended this study to the face stability of a non-circle tunnel which further improved this kind of deterministic assessment model.
In order to evaluate the effect of uncertainties in engineering, the reliability analysis method was introduced to perform probabilistic tunnel face stability analysis. The Monte Carlo simulation is known as the most straightforward and robust approach for reliability analysis, but it becomes very expensive and time-consuming when a complex deterministic model or performance function are involved. The first-order and second-order reliability method (FORM/SORM) are usually used to achieve a more efficient computation instead of the direct Monte Carlo simulation. However, this kind of approach is not available for a system with an implicit limit state function. To solve this problem, the response surface method (RSM) is proposed by assuming a high-order polynomial function to fit the implicit limit state function. Wherein the quadratic response surface method (QRSM) is the most commonly used in literature [7-9], but can be inefficient when the performance function has third-order or higher order terms.
Recently, the machine learning has become an interesting issue in the field of geotechnical structural stability analysis. ECHARD et al [10] introduced an active learning reliability method combining Kriging and Monte Carlo method. The Kriging model is used as a surrogate model instead of the complex limit state function to perform the Monte Carlo simulation which greatly saves the computational time and costs. SHIHABUDHEEN et al [11] evaluated the geo-environmental hazard of landslide using the extreme learning machines (ELM). PAN and DIAS [12] presented an approach for reliability method combining adaptive support vector machine (SVM) and Monte Carlo method. Those methods give a new perspective to perform probabilistic tunnel face stability analyses.
In this paper, the face stability of a tunnel driven in a two-layer soils is investigated. The rotational failure mechanism is used to describe the face failure in the limit analysis framework. The cohesion c and internal friction angle ¦Х of soils are considered as random variables. The Kriging model is trained by an active learning function and then used to estimate the failure probability of the tunnel face.
2 Computational model of tunnel face failure
2.1 Problem statement
As shown in Figure 1, a tunnel with a diameter d and a buried-depth h is excavated in two-layer soil mass. The distance measured from the tunnel invert to the interface of the two layers is denoted as H0. The rotational failure mechanism is adopted in this paper to describe the tunnel face failure. O is the rotation center of the failure block and ¦Ш is the angular velocity. rA(OA), rB(OB), r2(OD'), r1(OC), rE(OE) are the rotation radii and ¦ИA, ¦ИB, ¦И2, ¦И1, ¦ИE are the corresponding rotation angles. ¦ТT is the uniform support pressure applied to the tunnel face. In order to consider the influence of the soils variability on the tunnel face stability, it is assumed that the soils shear strength parameters are normally distributed in the two layers. ¦Мc, ¦М¦Х (¦Мc', ¦М¦Х') refer to the mean values of c, ¦Х and covc, cov¦Х (covc', cov¦Х') represent the coefficients of variability [13-17]. Here it is assumed that H0>d, namely the interface of two layers is positioned above the tunnel roof.
2.2 Kinematical analysis
Based on the log-spiral failure mechanism, the upper and lower boundaries of the failure block for the lower layer, namely rAD', rBC can be written as
 (1)
(1)
where ¦И represents any rotation angle and
 (2)
(2)
According to the geometrical relationship, the angles of ¦И1 and ¦И2 can be obtained by the following equation.
 (3)
(3)
For the upper layer,
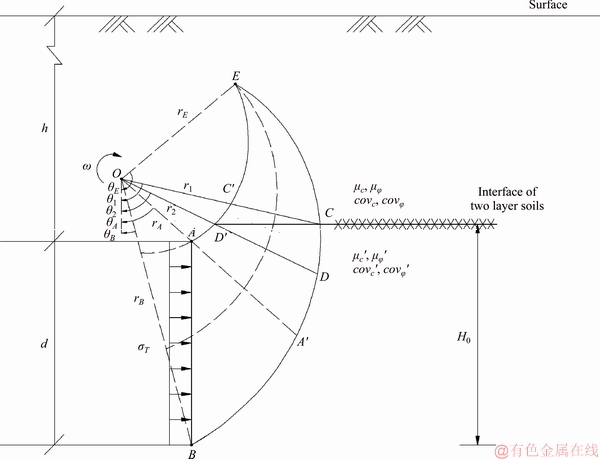
Figure 1 Rotational failure mechanism of tunnel face in two layer soils
 (4)
(4)
and
 (5)
(5)
The infinitesimal work rate done by gravity of soils dW can be presented as follows.
 (6)
(6)
where ¦Г is the unit weight of soils.
So the work rate done by gravity for the lower layer PW-L can be calculated as


 (7)
(7)
where f11(¦ИB, ¦И1), f12(¦ИB, ¦ИA), f13(¦ИA, ¦И2), f14(¦ИA, ¦ИB, ¦И1, ¦И2) can be seen in the Appendix.
Likewise, the work rate done by gravity for the upper layer PW-U is obtained.


 (8)
(8)
where f15(¦ИA, ¦ИB, ¦И1, ¦И2), f16(¦И1, ¦ИE), f17(¦И2, ¦ИE) are given in the Appendix.
It is assumed that a uniform support pressure is applied on tunnel face to retain its stability. So the work rate done by the support pressure P¦Т should be included into the energy equation.

 (9)
(9)
As the failure block is cut by the interface of the two layers, the internal energy dissipations Pd are divided into four part as follows.


 (10)
(10)
where f31(¦ИB, ¦И1), f32(¦И1, ¦ИE), f33(¦ИA, ¦И2), f34(¦И2, ¦ИE) are given in the Appendix.
Accordingly, the work rate equation is established by equating the internal energy dissipation to the external work rate, namely
 (11)
(11)
So the critical support pressure against tunnel face failure can be obtained by maximize ¦ТT under the objective function of Eq. (11), which can presented as
 (12)
(12)
In order to ensure the rationality of the failure mechanism, the following constraints must be satisfied.
 (13)
(13)
3 Reliability tunnel face analysis
3.1 Review of Kriging theory
The Kriging theory is based on the variogram theory analysis and can give an optimal linear unbiased estimation of the variables values in a finite region. It reflects the spatial correlations between the known points and the unknown points by assuming the distance or direction among them. The Kriging is an interpolation method where the interpolated values are modeled by a Gaussian process [18, 19].
It is assumed that a performance function of Y with m variables is estimated at n points which are denoted as Xi=(x1i, x2i, Ў, xmi) where i=1, 2, Ў, n. The corresponding responses are denoted as Yi=Y(Xi). So in the Kriging model, the performance function can be written in the form of a regression term and an error term as follows where the latter one is considered as a stochastic process.
 (14)
(14)
In Eq. (14), fk(Xi) is a first order or high order term, ¦Вk is the corresponding coefficient which should be determined by model training, k is the number of the terms and ¦Еj is a normally distributed error whose mean value is 0 and variance is ¦Т2.
Since the error is considered normally distributed, the correlation between those errors must be included into the stochastic process model. The point which is close to the unknown point is more informative than the one which is far away. In fact, the Kriging model does not assume that the errors are independent, but rather assume they are spatially correlated. So the distances among those points are taken into consideration to give a better estimation of the unknown points.
3.2 Active learning function
ECHARD et al [10] introduced an active learning function U which is defined as follows:
 (15)
(15)
where  is the estimation of Y(X) and
  is the corresponding standard deviation. It comes from the lower confidence bounding function for optimization [20].
The active learning function U(X) provides a principle to train the Kriging model, so a stopping criterion is required to stop the training process. In fact, U(X) can be interpreted as a reliability index reflecting the chance of one point to be mistakenly classified. So a minimum of U(X) should be found among the points to be estimated. The point which minimizes U(X) has the biggest chance to be mistakenly classified. Subsequently, the stopping criterion can be defined as min(U(X))ЎЭl. It can be seen in the previously published works that l=2 can guarantee a high accuracy of the estimation. In another way, U=2 means that the probability of making a mistake at this point is equal to ¦µ(-2)=0.023. So U=2 is also adopted in this paper as a stopping criterion for the probabilistic tunnel face stability analysis.
3.3 Probabilistic stability analysis model
Based on the Kriging model and the active learning function discussed above, the probabilistic stability analysis model is built as follows:
Stage 1: Determine the statistical parameters of the two-layer soils, namely ¦Мc, ¦М¦Х, covc, cov¦Х for the upper layer and ¦Мc', ¦М¦Х', covc', cov¦Х' for the lower layer. Based on those parameters, a Monte Carlo population S with a size NMC is generated where each individual consists of four random variables. Here it is assumed that all the variables are normally distributed.
Stage 2: The Latin hypercube sampling (LHS) is used to select the initial sampling points that are distributed in the space of random variables as uniformly as possible. ECHARD et al [10] suggested that a dozen of points are enough. In order to improve the prediction accuracy, more initial sampling points can be adopted according to the specified case. The initial sampling points are estimated by the optimization program which is coded according to the rotational failure mechanism mentioned above.
Stage 3: Train the Kriging model with the initial sampling points and predict the sign of each individual of S. The criterion function Sign(X) can be presented as
 (16)
(16)
where PRE is a known pressure applied to the tunnel face to maintain its stability and ¦ТT can be obtained by Eq. (12). A positive sign of Sign(X) means a safe tunnel face and a negative sign means the tunnel face failure.
Stage 4: The active learning function is used to determine whether the Kriging is qualified to estimate the tunnel face failure probability. The index U is calculated for each point. The point which corresponds to the minimum U is added to the training set one by one until the minimum U is bigger than 2.
Stage 5: The qualified Kriging model is used to estimate the tunnel face failure probability (pf). The coefficient of variability of pf is calculated using the following equation.
 (17)
(17)
Traditionally, cov(pf)ЎЬ0.05 indicates that the result is reliable, or the Monte Carlo population S must be enriched to get more trial points.
All the stages can be summarized in the flowchart as shown in Figure 2.
4 Results and discussion
4.1 Numerical results with deterministic model
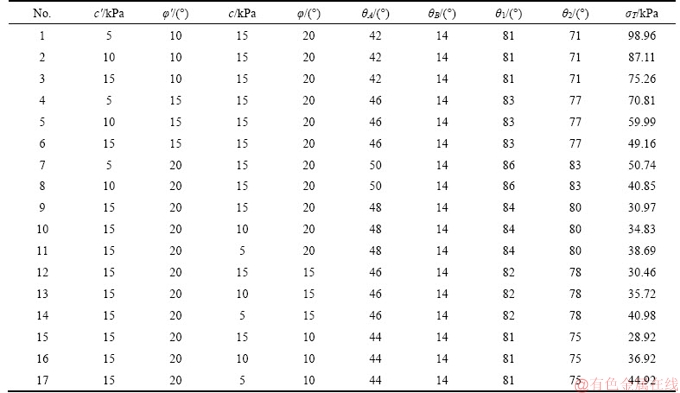
In this section, a deterministic tunnel face stability analysis is performed to validate the rotational failure mechanism in two-layer soils. The basic parameter settings are set as follows: h=30 m, d=10 m, H0=12 m, ¦Г=18 kN/m3. c', ¦Х', c, ¦Х are given in Table 1 as variables. ¦ИA, ¦ИB, ¦И1, ¦И2 and ¦ТT are computed as output results as shown in Table 1. As shown in Figure 3, the contours of the failure block were plotted by referring to the optimization results of cases 1, 3, 8, 10, 13 and 15 in Table 1. They permit to show the influence of variables on tunnel face failure.
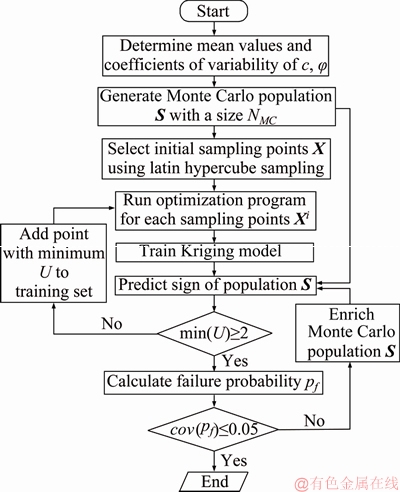
Figure 2 Flowchart for probabilistic stability analysis
The shear strength parameters for the lower layer soils vary from small to high values and those for the upper layer soils from high to small ones. It can be seen that the critical face pressure decreases obviously when c' and ¦Х' increase, while it increases slowly when c and ¦Х decrease. So it can be inferred that the soils right ahead the tunnel face have the main influence on its stability, and the soils positioned above the tunnel roof also have a lower influence on the tunnel face stability. As shown in Figure 3, the soft soils in the lower layer lead to a larger failure area along the horizontal direction and a higher failure block along the vertical direction. However, the failure area along the horizontal direction is restricted when the soils in the lower layer become harder (higher values of c and ¦Х) which can be seen from Figure 3(f). It should be noticed that the case with the minimum critical face pressure is number 15 instead of number 9 even though the shear strength parameters of number 9 are higher for both the lower and upper layer soils. It is mainly caused by the deformation of the upper layer soils. As it can be seen, a small value of ¦Х leads to a long and narrow failure block in the upper layer soils. It means that the work rate done by gravity decreases and the internal energy dissipation increases. Eventually, the critical face pressure becomes smaller than that for case 9. So it seems that the tunnel excavated in hard soils overlaid by soft soils is safer than the one purely in hard soils.
Table 1 Numerical results with deterministic model
4.2 Influence of initial sampling points
In this paper, the shear strength parameters for both layers are considered as random variables, which indicates that the input data for the probabilistic model are four dimensional vectors. The selection of the initial sampling points is an important step for improving the efficiency and accuracy of the Kriging model. So the LHS is used to select the initial sampling points which can ensure those points uniformly distribute in a specified zone. Moreover, the number of initial sampling points also needs to be discussed in detail. Even though ECHARD et al [10] suggested that a dozen of points are enough to give a high accuracy prediction, more initial sampling points are probably required when a complex system is under consideration. In the section, a case of ¦Мc=¦Мc'=15 kPa, ¦М¦Х=¦М¦Х'=20Ўг, covc=covc'=0.23, cov¦Х=cov¦Х'= 0.17 is studied using the proposed approach. The tunnel parameters are the same with those in Section 4.1. The correlation coefficient matrix for the four random variables is as follows:
 (18)
(18)
Figure 4 presents the evaluation of the normalized pf with different numbers of initial sampling points. It is obtained by normalizing the result given by the proposed approach with the Monte Carlo simulation. Figure 5 shows the number of calls to the performance function. It can be seen that when the number of initial sampling points is less than 12, the normalized pf deviates significantly from 1.0 and more calls to the performance function are required. Subsequently, the normalized pf gradually goes to 1 with the enrichment of the initial sampling points and the calls to the performance function stays around 40. So it is implied that too less initial sampling points will reduce the calculation efficiency and accuracy. 24 or more initial sampling points are necessary for a better estimation of the failure tunnel face probability.
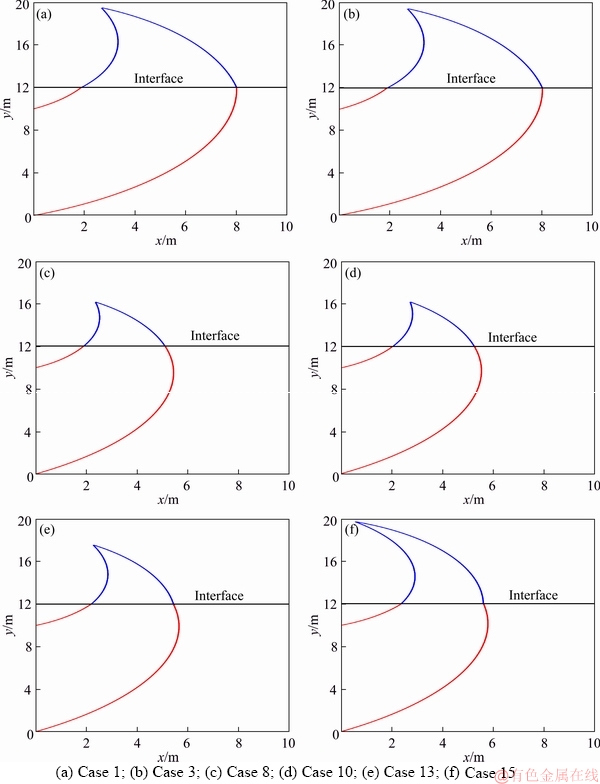
Figure 3 Contours of failure block ahead of tunnel face:
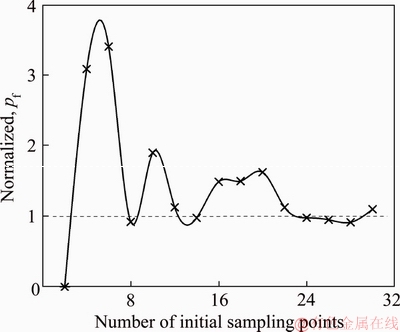
Figure 4 Evaluation of normalized pf
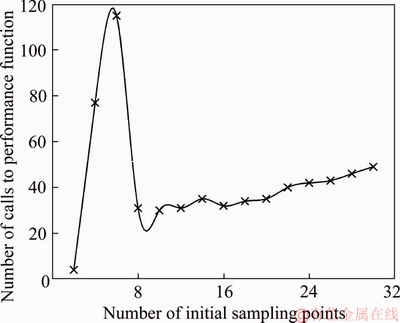
Figure 5 Number of calls to performance function
4.3 Influence of correlation coefficient
In a lot of geotechnical experiments, researchers found that c and ¦Х of soils were not completely independent, but showed a certain correlation. CHERUBINI [21] stated that there was a significant negative correlation between c and ¦Х and the correlation coefficient is in the range of -0.24 to -0.7 [22]. Previously published works showed that the negative correlation of shear strength parameters had a negligible effect on the tunnel face stability. In this study, the soils of upper and lower layers are considered independent, but for each layer, c and ¦Х are assumed to be negatively correlated which can be represented by the following correlation coefficient matrix CC.
 (19)
(19)
where 0ЎЬz1, z2ЎЬ-1.
In this section, four cases are investigated using the proposed approach while z1 and z2 range from -0.5 to 0 respectively, namely Case 1: ¦Мc'=15 kPa, ¦М¦Х'=20Ўг, ¦Мc=5 kPa, ¦М¦Х=10Ўг, Case 2: ¦Мc'=15 kPa, ¦М¦Х'=20Ўг, ¦Мc=5 kPa, ¦М¦Х=20Ўг, Case 3: ¦Мc'=5 kPa, ¦М¦Х'=10Ўг, ¦Мc=15 kPa, ¦М¦Х=20Ўг, Case 4: ¦Мc'=15 kPa, ¦М¦Х'=10Ўг, ¦Мc=15 kPa, ¦М¦Х=20Ўг. The support pressure applied to the tunnel face is set equal to 100 kPa. The rest of the parameters are the same as in Section 4.2. The calculated failure probabilities are given in Table 2.
It can be seen that the negative correlations between random variables lead to a lower tunnel face failure probability, which indicates that neglecting the correlation coefficient of c, ¦Х or c', ¦Х' will overestimate the failure probability. In addition, the correlation coefficient of c' and ¦Х' has a more significant influence on the tunnel face stability than the c, ¦Х ones.
As the cohesions and internal friction angles of the lower and upper layers are assumed to be independent random variables, so the distributions of random variables in the space of c, ¦Х (c', ¦Х') can be presented in Figure 6. Only the cases of ¦Мc=5 kPa, ¦М¦Х=10Ўг and ¦Мc=15 kPa, ¦М¦Х=20Ўг are given in those figures and the correlation coefficients of -0.1 and -0.5 are considered. It can be observed that when the correlation coefficient is negative and is decreasing, the sampling points tend to appear at the upper left corner or the lower right corner and get away from the original point. It can explain why the failure probability decreases when a negative correlation for the random variables is considered.
Table 2 Failure probability of tunnel face with negatively correlated random variables
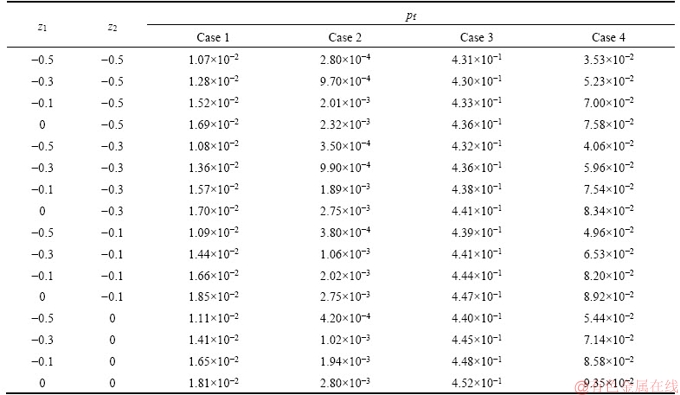
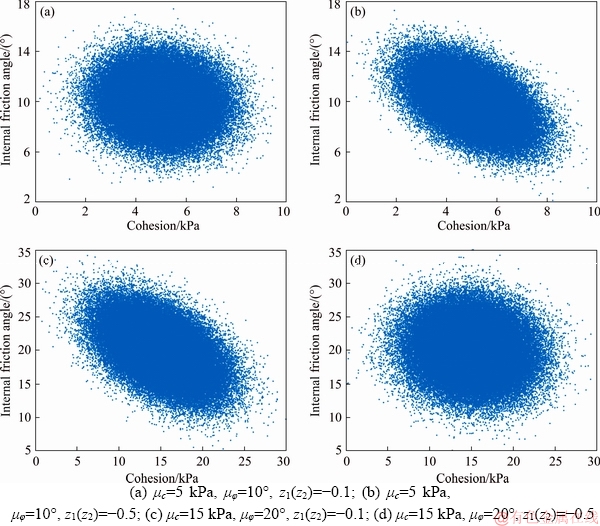
Figure 6 Distribution of random variables in space of c, ¦Х(c', ¦Х'):
4.4 Influence of distribution type
The variability of soils is usually very high in nature [23, 24]. When the correlation coefficient of c or ¦Х reaches 0.25 or more, negative values are probably generated in the random date during Monte Carlo simulation. These unreasonable data may cause errors in the failure probability estimation. In order to exclude the negative values, the lognormal distribution is often used to perform probabilistic analysis instead of normal distribution. Before this substitution, it is necessary to figure out the difference of results given by the normal distribution and the lognormal ones. In this section, z1, z2 are set to -0.3 to respect the negative correlation in soils and ¦Мc(¦Мc'), ¦М¦Х(¦М¦Х') are respectively set to 15 kPa and 20Ўг. The tunnel face failure probability is calculated when the support pressure applied on tunnel face ranges from 30 kPa to 90 kPa.
Figure 7 presents the probability density functions (PDF) of random variables. It can be seen that the peak of the lognormal distribution curve is higher and appears earlier than the normal distribution curve one. There is a higher chance for the normal distribution to generate a sampling point with small values (smaller than 10kPa for cohesion and 15Ўг for internal friction angle).
Figure 8 presents the failure probability when the support pressure varies from 30 kPa to 90 kPa. The normal distribution and lognormal distribution are investigated. As shown in Figure 8, the failure probability estimated by the lognormal distribution is smaller than the normal distribution one. The difference between them becomes more obvious as the support pressure increase. So it can be concluded that the failure probability can be underestimated if normally distributed random variables are assumed to be lognormally distributed.
4.5 Influence of coefficient of variability
Figure 9 presents the tunnel face failure probability with the support pressure variation. The parameter settings of Section 4.4 are adopted here and the variations of covc', cov¦Х', covc, cov¦Х are taken into consideration. In the lower layer, the variation of covc' has a low influence on the tunnel face failure probability while the variation of cov¦Х' has a significant influence. Similarly, with the distribution type influence, the variation of covc' or cov¦Х' influence is more prominent when the support pressure is bigger. For the upper layer, the coefficient of variability variation has a small influence on the failure probability. This phenomenon is in agreement with the deterministic stability analysis which shows that the tunnel face stability is mainly linked to the soil properties of the lower layer.
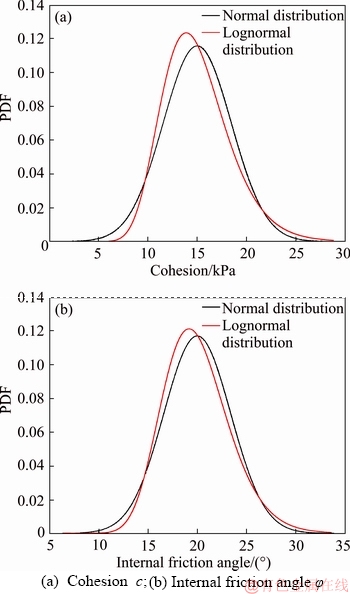
Figure 7 PDFs of random variables:
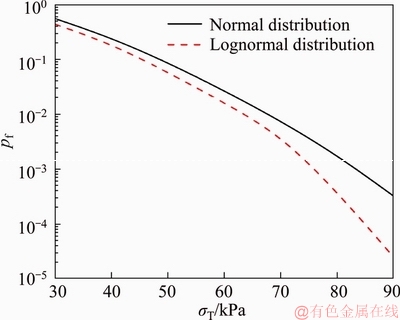
Figure 8 Failure probability of tunnel face versus support pressure with different distribution types
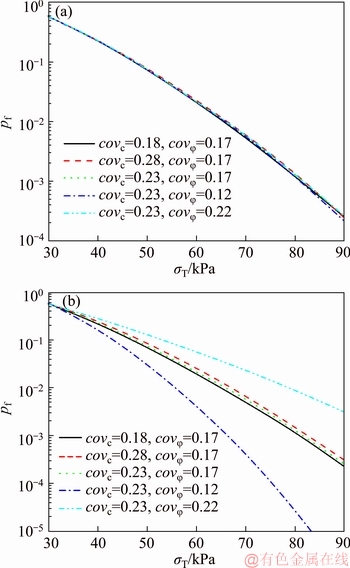
Figure 9 Tunnel face failure probability versus support pressure for different coefficient of variability
5 Conclusions
This paper presents a probabilistic approach of the tunnel face stability excavated in two-layer soils. The rotational failure mechanism is adopted to describe the failure mechanism. An active learning Kriging model is used as a surrogate model to perform Monte Carlo simulations. It greatly improves the calculation efficiency without sacrifice of the calculation accuracy. The following conclusions can be obtained.
The tunnel face stability is more affected by the lower soil layer than by the upper one. Hard soils as lower layers are beneficial to the tunnel face stability while the soft soils in the upper layer are favorable. It is because the soft soils in the upper layer lead to a long and narrow failure block where the work rate done by gravity is lower than the internal energy dissipation.
The number of initial sampling points should be adjusted according to the specified case. In this study, 24 or more initial sampling points are necessary for a better estimation of the tunnel face failure probability.
Negative correlations between random variables lead to a lower tunnel face failure probability. It can be explained by the fact that the sampling points tend to get away from the failure zone with consideration of the negative correlations. The correlation coefficient of random variables in the lower layer has a more significant influence on the tunnel face failure than the upper layer one.
With a higher support pressure, the distribution type and coefficient of variability influence are more significant. The coefficient of variability of the lower layer has more influence on the failure probability which highlights the dominant role of the lower layer soils.
References
[1] ZHANG Dao-bing, LIU Zhi-zhen, ZHANG Jia-hua. A new failure mechanism for deep cavity and upper bound solution of supporting pressure [J]. Journal of Central South University, 2017, 24(9): 2082-2091.
[2] ASGHAR R, LOHRASB F, MOHAMMAD D. Squeezing rock conditions at phyllite-slate zone in Golab water conveyance tunnel, Iran: A case study [J]. Journal of Central South University, 2017, 24(10): 2475-2485.
[3] LECA E , DORMIEUX L . Upper and lower bound solutions for the face stability of shallow circular tunnels in frictional material [J]. GЁ¦otechnique, 1990, 40(4): 581-606.
[4] MICHALOWSKI R L, DRESCHER A. Three-dimensional stability of slopes and excavations [J]. GЁ¦otechnique, 2009, 59(10): 839-850.
[5] MOLLON G, DIAS D, SOUBRA A H. Rotational failure mechanisms for the face stability analysis of tunnels driven by a pressurized shield [J]. International Journal for Numerical and Analytical Methods in Geomechanics, 2011, 35(12): 1363-1388.
[6] PAN Q, DIAS D. Upper-bound analysis on the face stability of a non-circular tunnel [J]. Tunnelling and Underground Space Technology, 2017, 62: 96-102.
[7] LI T Z, YANG X L. Probabilistic stability analysis of subway tunnels combining multiple failure mechanisms and response surface method [J]. International Journal of Geomechanics, 2018, 18(12): 04018167.
[8] YANG X, ZHANG S. Risk assessment model of tunnel water inrush based on improved attribute mathematical theory [J]. Journal of Central South University, 2018, 25(2): 379-391.
[9] QIN C B, CHIAN S C. Kinematic analysis of seismic slope stability with a discretisation technique and pseudo-dynamic approach: A new perspective [J]. Geotechnique, 2018, 68(6): 492-503.
[10] ECHARD B, GAYTON N, LEMAIRE M. AK-MCS: An active learning reliability method combining Kriging and Monte Carlo simulation [J]. Structural Safety, 2011, 33(2): 145-154.
[11] SHIHABUDHEEN K V, PILLAI G N, PEETHAMBARAN B. Prediction of landslide displacement with controlling factors using extreme learning adaptive neuro-fuzzy inference system (ELANFIS) [J]. Applied Soft Computing, 2017, 61: 892-904.
[12] PAN Q, DIAS D. An efficient reliability method combining adaptive support vector machine and Monte Carlo simulation [J]. Structural Safety, 2017, 67: 85-95.
[13] LI Y X, YANG X L. Soil-slope stability considering effect of soil-strength nonlinearity [J]. International Journal of Geomechanics, 2019, 19(3): 04018201.
[14] LI Z W, YANG X L. Kinematical analysis of active earth pressure considering tension crack, pore-water pressure and soil nonlinearity [J]. KSCE Journal of Civil Engineering, 2019, 23(1): 56-62.
[15] XU J S, YANG X L. Seismic stability of 3D soil slope reinforced by geosynthetic with nonlinear failure criterion [J]. Soil Dynamics and Earthquake Engineering, 2019, 118: 86-97.
[16] ZHANG J H, WANG W J, ZHANG D B, ZHANG B, MENG F. Safe range of retaining pressure for three- dimensional face of pressurized tunnels based on limit analysis and reliability method [J]. KSCE Journal of Civil Engineering, 2018, 22(11): 4645-4656.
[17] HUANG F, ZHAO L H, LING T H, YANG X L. Rock mass collapse mechanism of concealed karst cave beneath deep tunnel [J]. International Journal of Rock Mechanics and Mining Sciences, 2017, 91: 133-138.
[18] ZHANG J, HUANG H W, PHOON K K. Application of the Kriging-based response surface method to the system reliability of soil slopes [J]. Journal of Geotechnical and Geoenvironmental Engineering, 2012, 139(4): 651-655.
[19] QIN C B, CHIAN S C. Bearing capacity analysis of a saturated non-uniform soil slope with discretization-based kinematic analysis [J]. Computers and Geotechnics, 2018, 96: 246-257.
[20] LI Z W, YANG X L. Active earth pressure for soils with tension cracks under steady unsaturated flow conditions [J]. Canadian Geotechnical Journal, 2018, 55(12):1850-1859.
[21] CHERUBINI C. Reliability evaluation of shallow foundation bearing capacity on c'¦Х' soils [J]. Canadian Geotechnical Journal, 2000, 37(1): 264-269.
[22] WOLFF T F. Analysis and design of embankment dam slopes: A probabilistic approach [D]. West Lafayette: Purdue University, 1985.
[23] LI Y X, YANG X L. Three-dimensional seismic displacement analysis of rock slopes based on Hoek-Brown failure criterion [J]. KSCE Journal of Civil Engineering, 2018, 22(11): 4334-4344.
[24] XU J S, LI Y X, YANG X L. Seismic and static 3D stability of two-stage slope considering joined influences of nonlinearity and dilatancy [J]. KSCE Journal of Civil Engineering, 2018, 22(10): 3827-3836.
(Edited by HE Yun-bin)
ЦРОДµј¶Б
Цч¶ЇС§П°РНїЛАпЅрДЈРНФЪХЖЧУГжїЙїї¶И·ЦОцЦРµДУ¦УГЁDТФЛ«ІгНБЛнµАОЄАэ
ХЄТЄЈє±ѕОДЦјФЪСРѕїЛ«ІгНБИАЦРЛнµАїЄНЪК±ХЖЧУГжµДОИ¶ЁРФОКМвЎЈКЧПИЈ¬јЩЙиЛ«ІгНБИАµД·ЦЅзГжО»УЪЛнµА№°¶ҐЙП·ЅЈ¬ТФј«ПЮ·ЦОц·Ѕ·ЁОЄТАѕЭЈ¬ІЙУГРэЧЄЖЖ»µ»ъЦЖ№№ЅЁХЖЧУГжК§ОИДЈРНЈ¬Н¬К±Ј¬їјВЗБЛїЄНЪЅйЦКµДјфЗРЗї¶ИІОКэЛж»ъРФ¶ФХЖЧУГжОИ¶ЁРФµДУ°ПмЎЈІЙУГїЛАпЅрДЈРНґъМжЖдФКјµД№¦ДЬєЇКэЈ¬Ѕш¶шІЙУГГЙМШїЁВе·ЁјЖЛгХЖЧУГжµДЖЖ»µёЕВКЈ¬ґУ¶шґуґуМбёЯБЛјЖЛгР§ВКєНЅЪФјБЛјЖЛгіЙ±ѕЎЈ±ѕОДІЙУГЦч¶ЇС§П°єЇКэ¶ФїЛАпЅрДЈРНЅшРРСµБ·Ј¬ТтґЛЈ¬їЙТФИ·±ЈЖд¶ФХЖЧУГжЖЖ»µёЕВКµДФ¤ІвёЯР§¶шІ»К§ЧјИ·РФЎЈ±ѕОДКЧПИЅЁБўБЛЛнµАХЖЧУГжЖЖ»µДЈРНЈ¬НЁ№эјЖЛг·ЦОцЈ¬СйЦ¤БЛЛщМбіцДЈРНµДХэИ·РФЈ¬ЛжєуМЦВЫБЛЛж»ъ±дБїµДіхКјІЙСщµгКэЎўПа№ШПµКэЎў·ЦІјАаРНєН±дТмПµКэµИ¶ФЛнµАХЖЧУГжОИ¶ЁРФµДУ°ПмЎЈСРѕїЅб№ы±нГчёГ·Ѕ·ЁКЗТ»ЦЦёЯР§ѕ«И·µДїЙїї¶И·ЦОц·Ѕ·ЁЈ¬їЙТФОЄЛнµАЙијЖМṩһ¶ЁµДАнВЫЦёµјєНТАѕЭЎЈ
№ШјьґКЈєїЙїї¶И·ЦОцЈ»ЛнµАХЖЧУГжЈ»їЛАпЅрДЈРНЈ»Цч¶ЇС§П°єЇКэЈ»ЖЖ»µёЕВК
Foundation item: Projects supported by the China Scholarship Council
Received date: 2018-12-09; Accepted date: 2019-01-31
Corresponding author: LI Tian-zheng, PhD Candidate; Tel: +86-13875988038; E-mail: jacksonic@126.com; ORCID: 0000-0001- 8424-5299

