Calculation of Weight Gain of in-situ Oxide Film on Zirconium Hydride at 600 ��
Qi Shen Yan Guoqing Wang Zhihui Yuan Xiaoming Wang Lijun Zhang Jiandong
National Engineering Laboratory of Biohydrometallurgy,GRINM Group Corp.,Ltd.
GRINM Resources and Environment Tech.Co.,Ltd.
General Research Institute for Nonferrous Metal
State Key Laboratory of Advanced Metallurgy,University of Science and Technology Beijing
China Institute of Atomic Energy
Abstract��
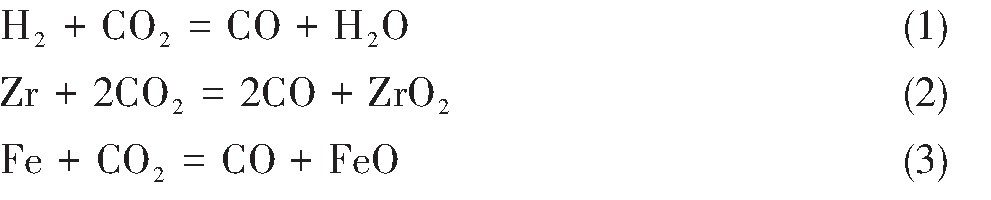
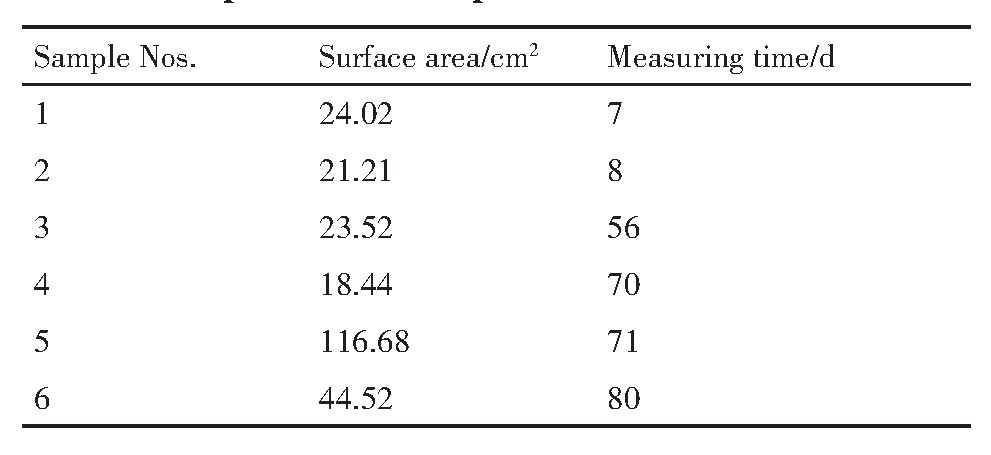
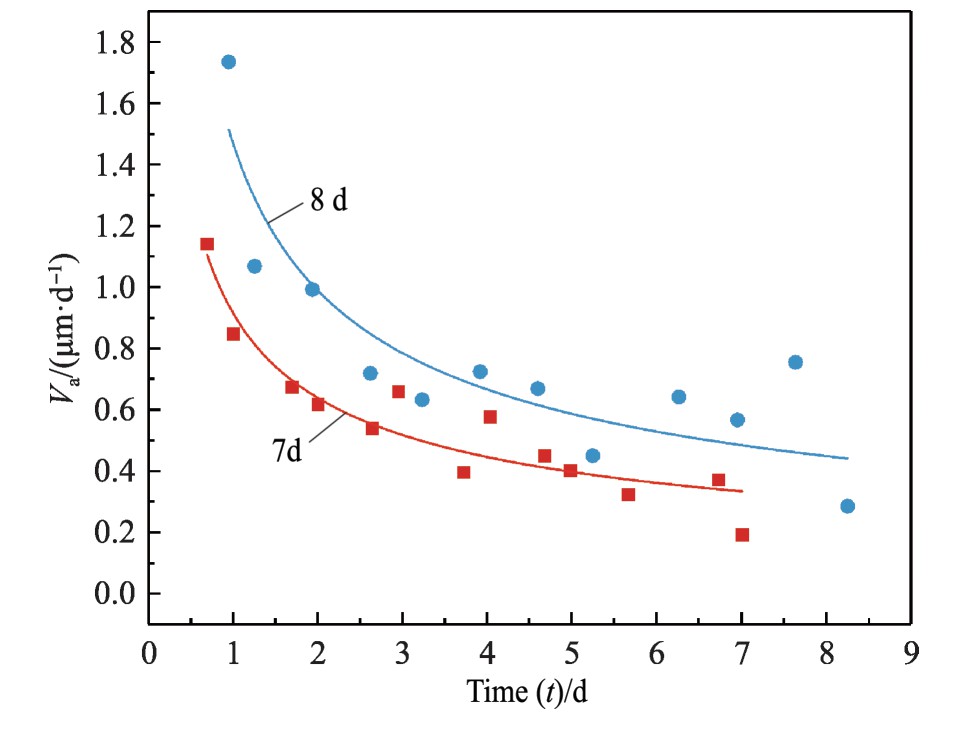
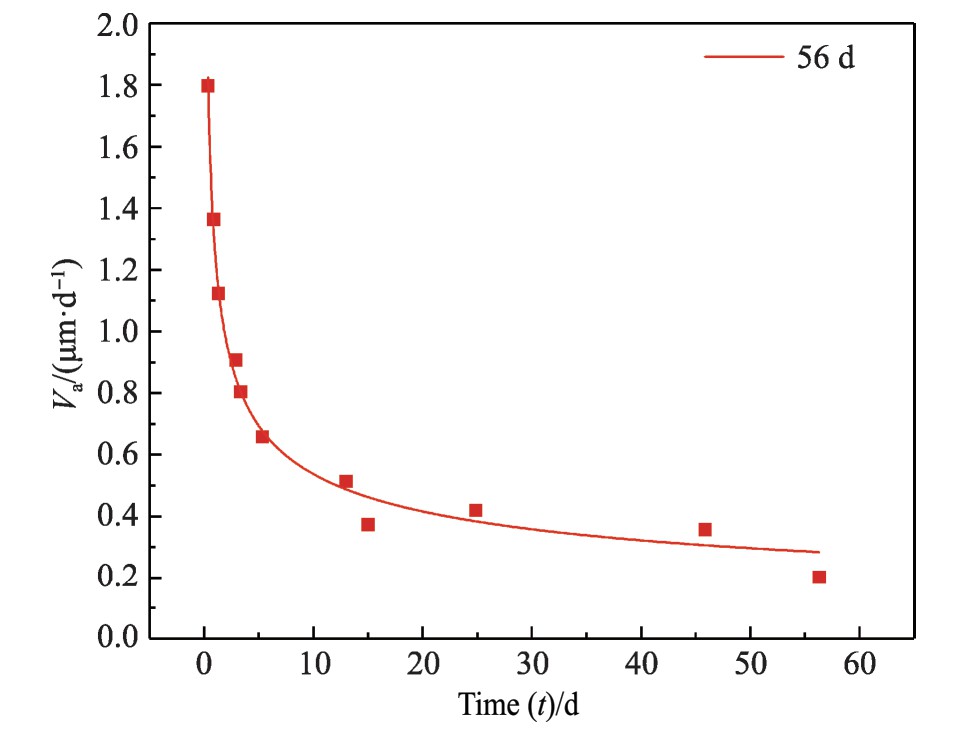
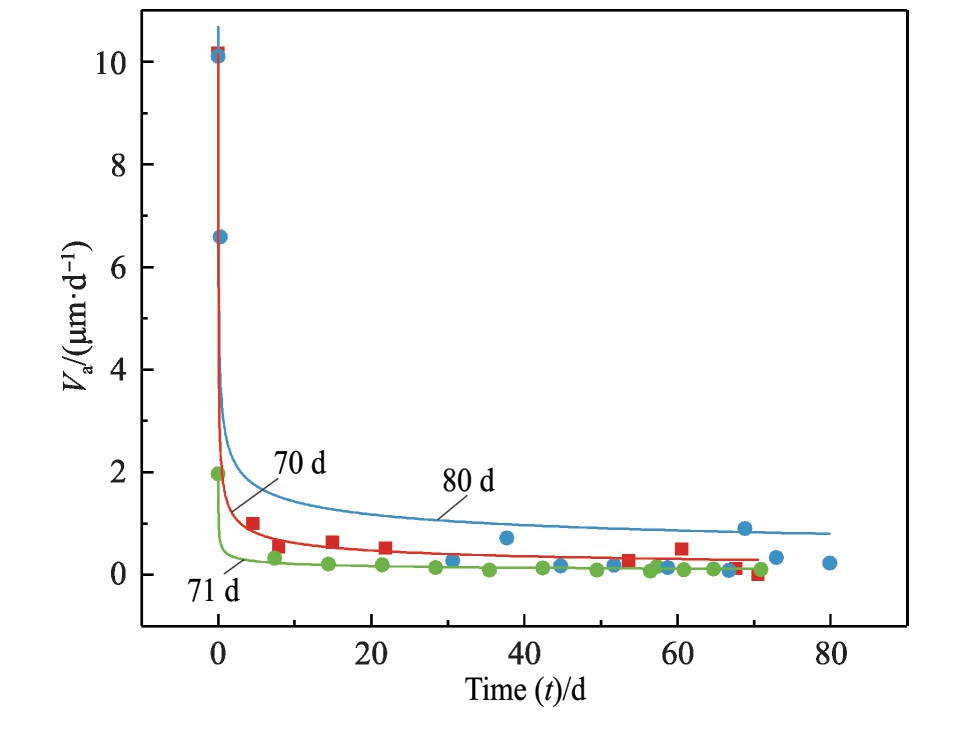
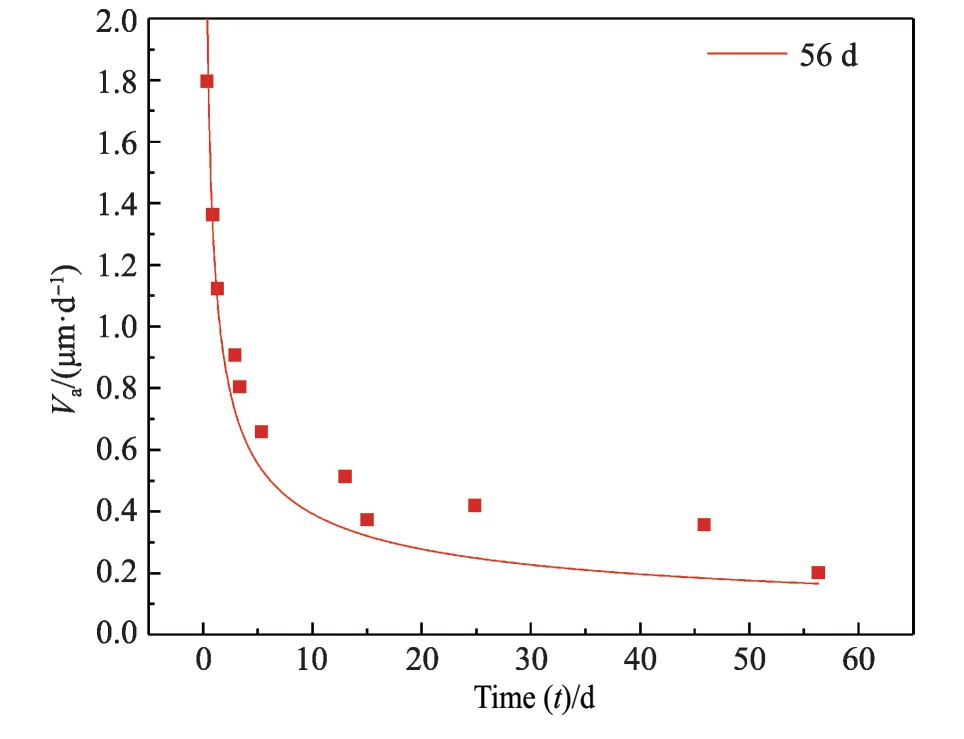
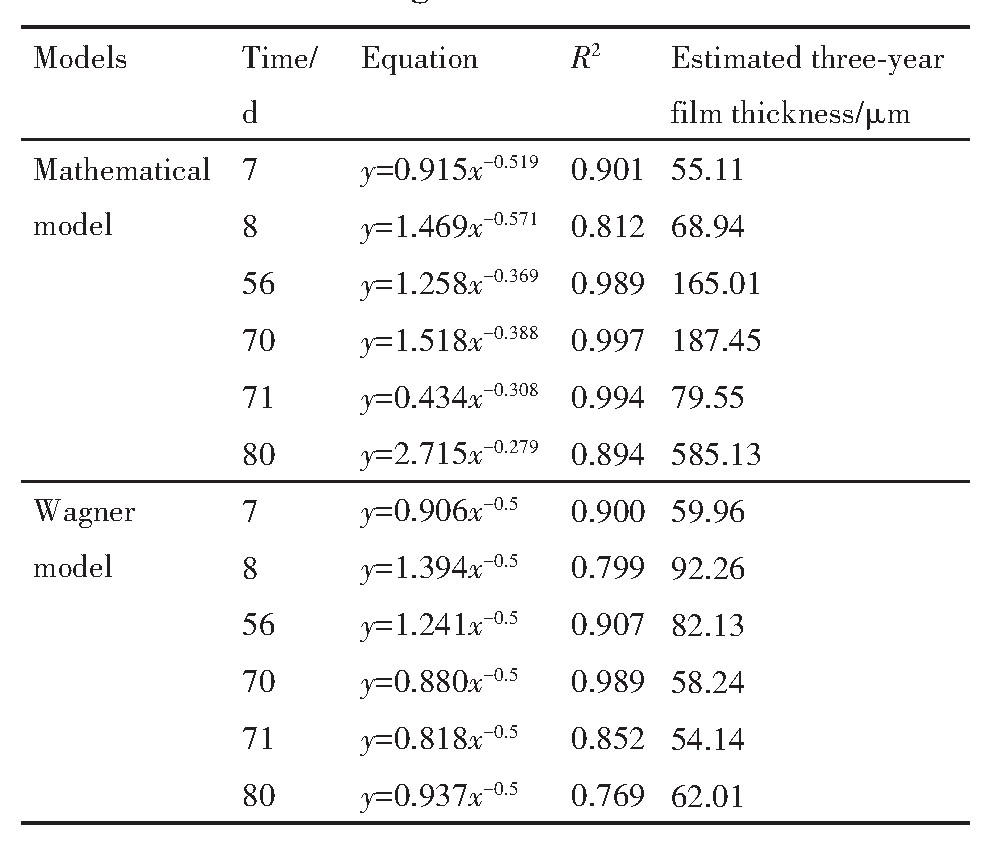
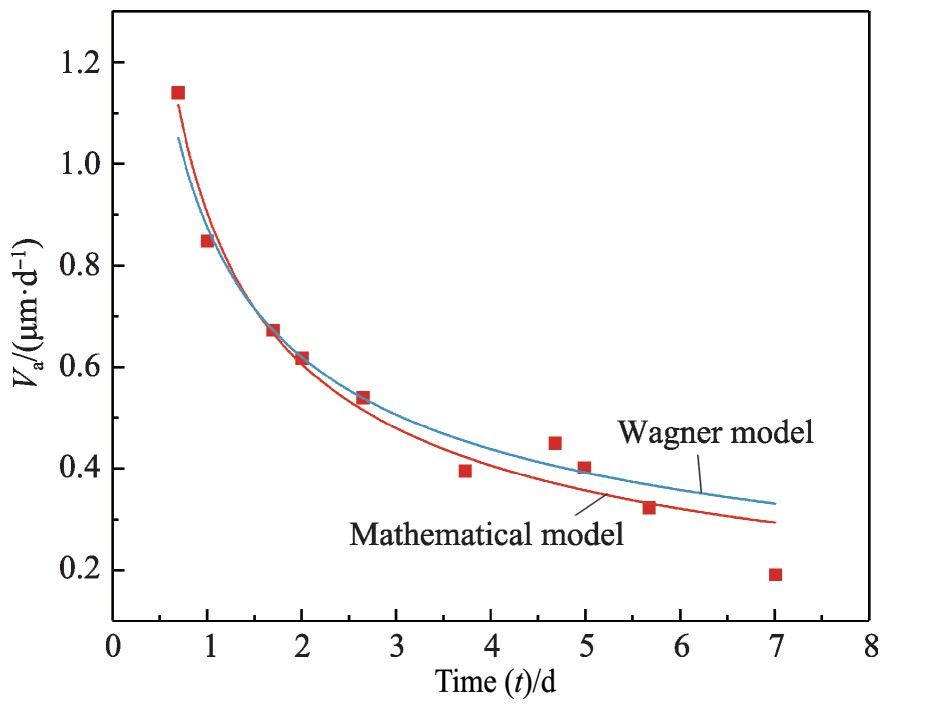
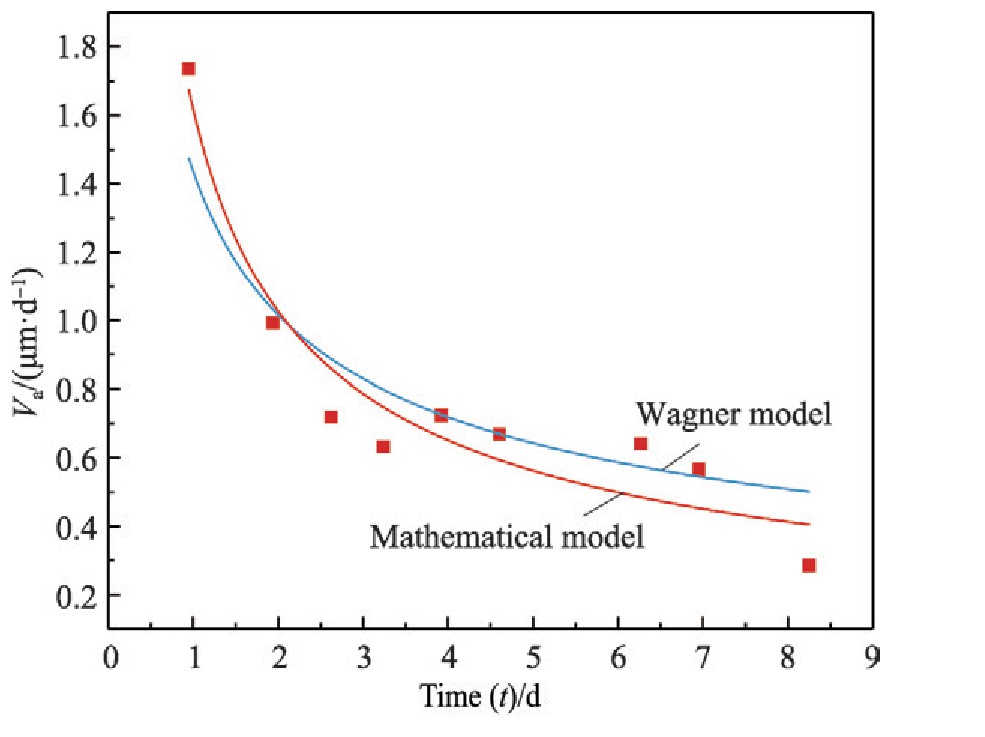
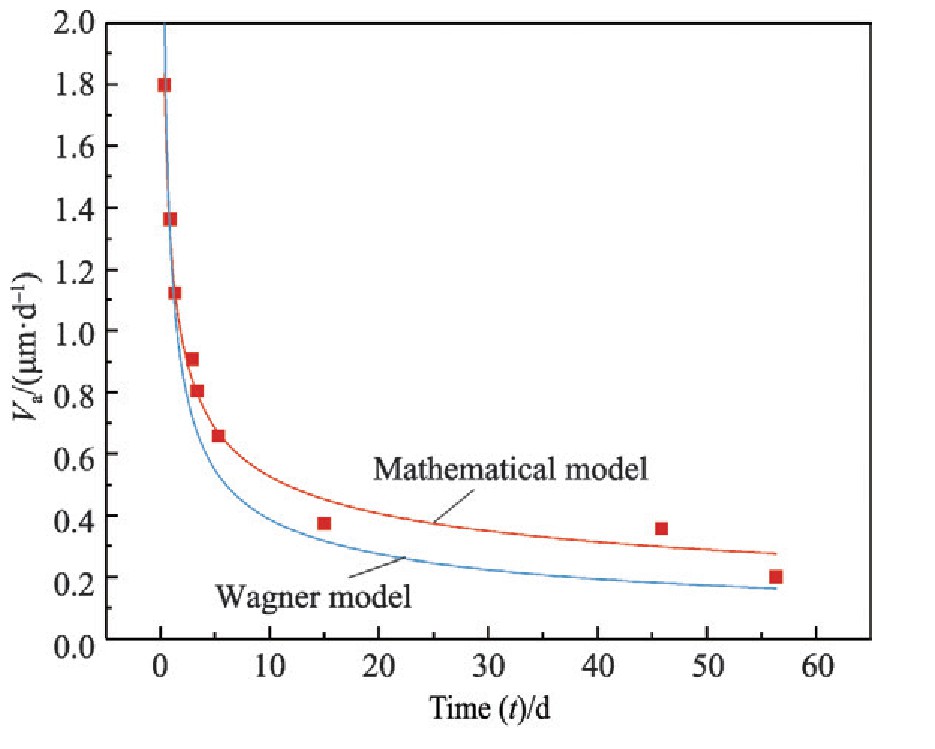
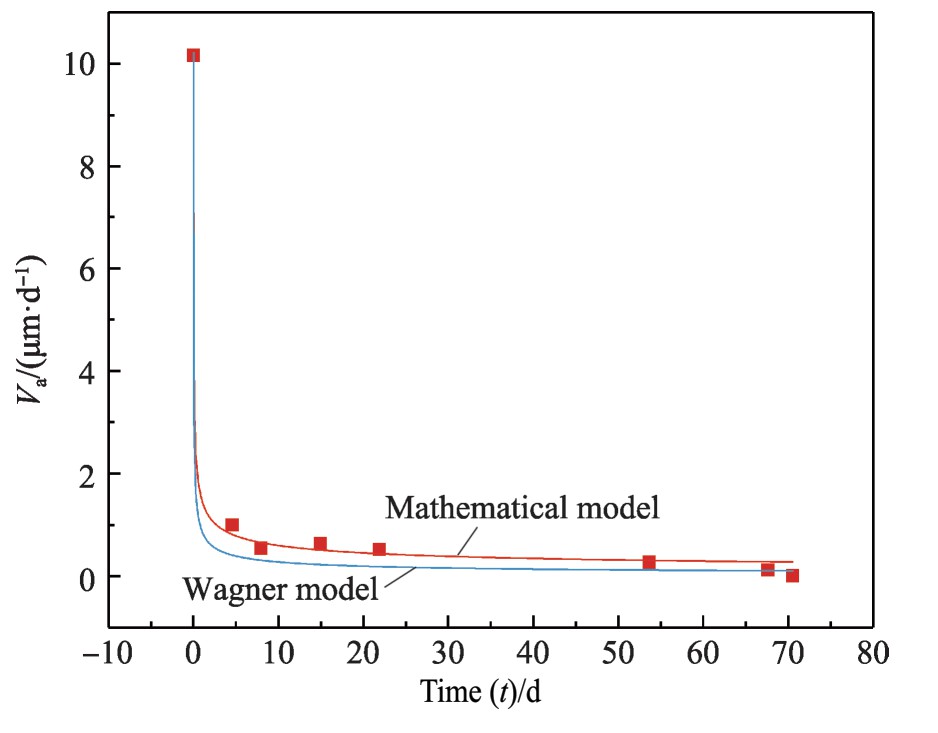
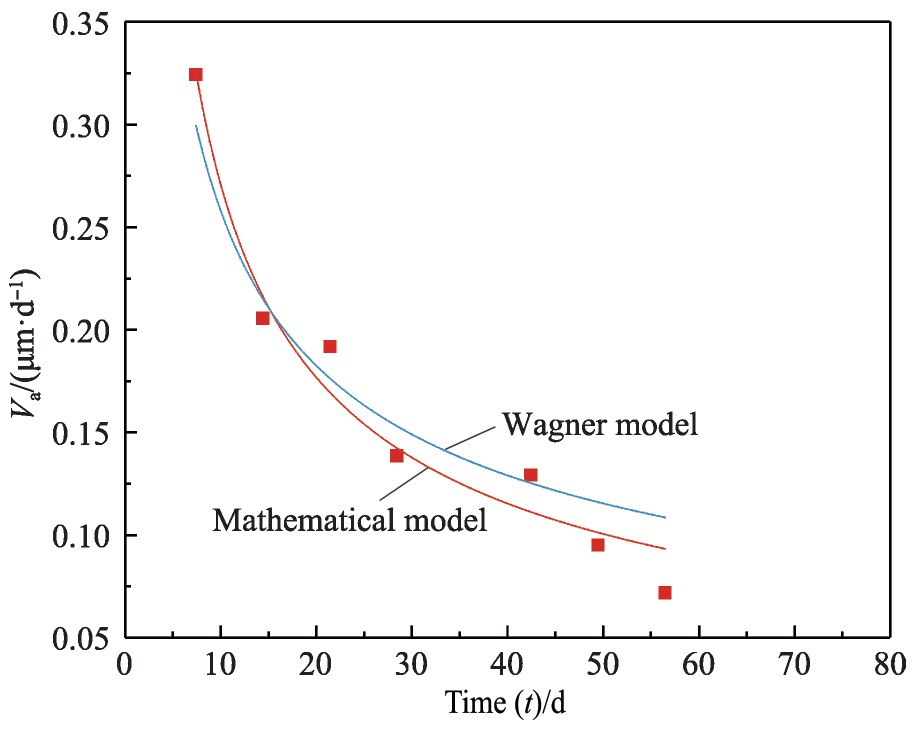
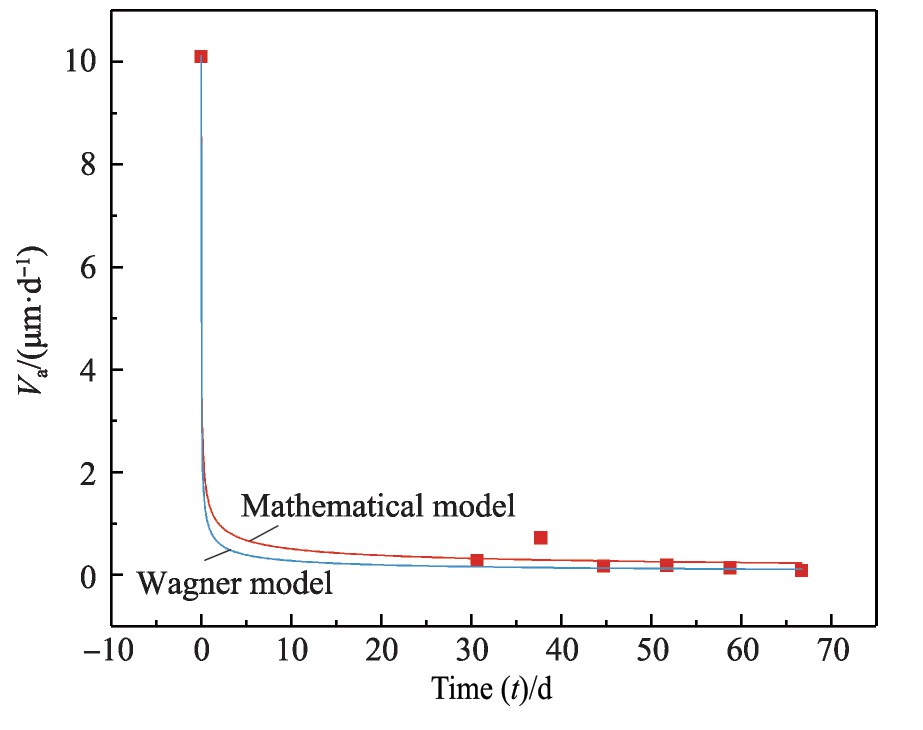
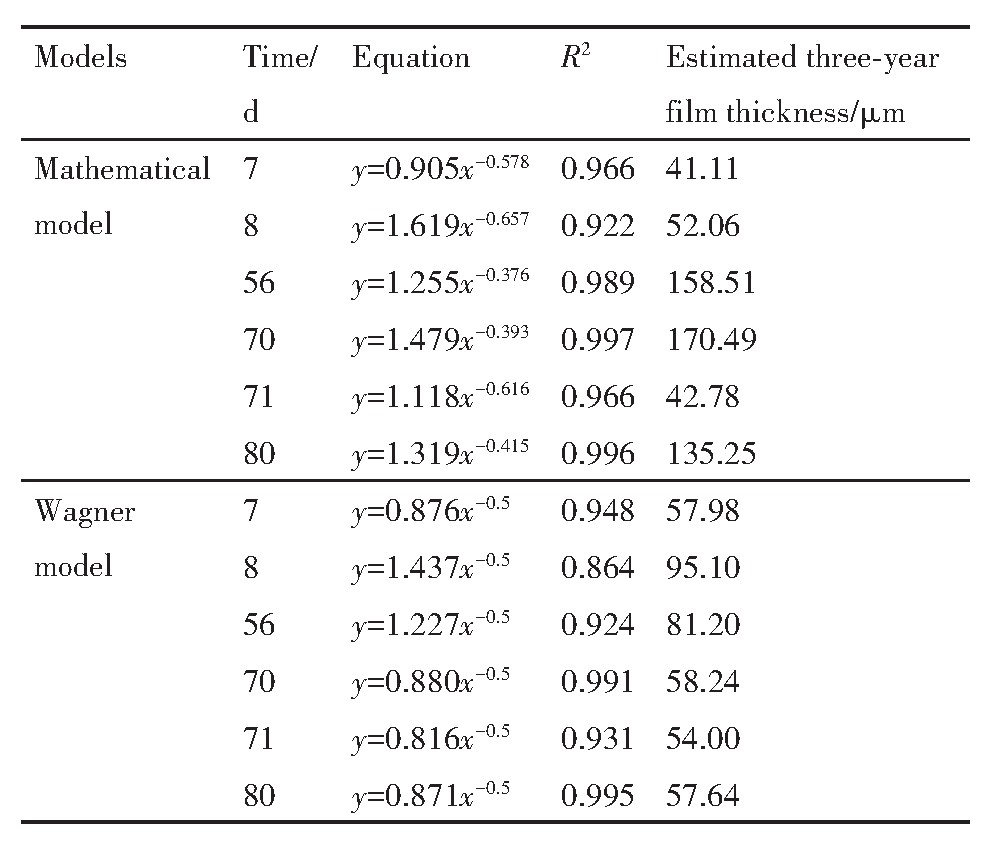
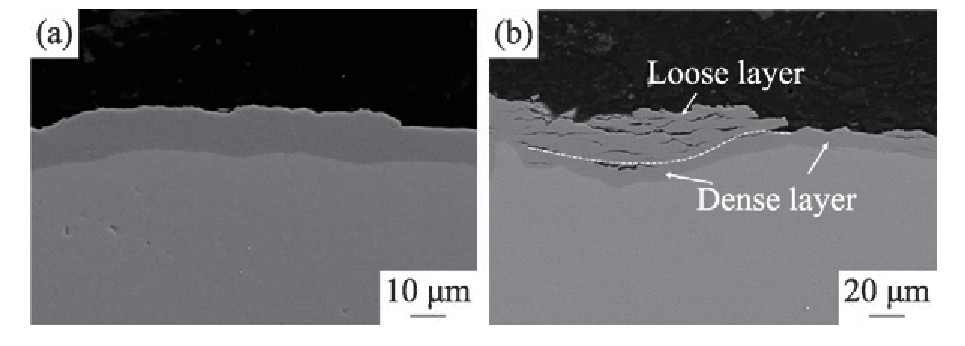
Zirconium hydride was a common moderator material for space nuclear reactor,which often worked at high temperature.Due to the inherent properties of metal hydride,zirconium hydride would decompose at a certain speed and release hydrogen,which would lead to the decrease of hydrogen content and the decrease of material life. In order to avoid hydrogen loss and prolong material life,surface coating was often prepared to prevent hydrogen loss. Zirconia film was growing in high temperature carbon dioxide atmosphere,but the research on the film growth under some specific conditions was not comprehensive. In this paper,the growth of in-situ oxidation film on zirconium hydride in CO2+He atmosphere at 600 �� was studied and the prediction model of film growth was discussed to master the growth rule of the surface layer of zirconium hydride and the maximum thickness that could be reached after long period examination. Six groups of experiments were designed,which lasted for 7,8,56,70,71 and 80 days respectively. The experimental groups with 71 and 80 days had heat shock points. The sampling frequency of the 7-and 8-days groups was once a day,which was higher than that of the other four groups(once every seven days). In order to ensure the experimental accuracy,four bottles of standard gases with different contents of H2 and CO were selected to prepare the standard curve. The content of H2 was 0.01%,0.05%,0.1% and 0.3% respectively. The content of CO was 0.1%,0.5%,1% and 3% respectively. It could be seen from the experimental results that the data stability of low sampling frequency group(56 days group,70 days group,71 days group,80 days group)was better,while the data stability of high sampling frequency group(7 days,8 days)was worse. After thermal shock,the growth rate of the film would rise suddenly,and then continued to decline. In order to better predict the maximum thickness of the film after long period examination,two prediction models,mathematical optimal solution model and Wagner model,were proposed. The mathematical model and Wagner model were used to fit the film growth rate(Va)and time(t),and then the fitting formula was integrated to predict the maximum thickness of the film under long period. The predicted results of mathematical model were 55.11��585.13 ��m and the predicted results of the Wagner model were 54��92.26 ��m. Obviously,the fitting result of the mathematical model was much larger than the actual value,and the fluctuation range was too large. But it could not be ruled out the influence factors caused by the interference points(thermal shock point,variable period detection point)of the experimental design. After removing the designed fluctuation points in the experiment,the data were optimized,and then the optimized data were fitted again. After optimization,the predicted results of mathematical model were 41.11��170.49 ��m and the predicted results of the Wagner model were 54��92.26 ��m. It could be seen that Wagner model was more stable in predicting the film thickness. In addition,the morphology of the film before and after the experiment was observed by scanning electron microscope(SEM). Before the examination,the surface film layer was dense and continuous,and the film thickness was 10��20 ��m. After experiment,the surface film layer became loose and cracks and pores appeared.And the surface of the film became uneven,some areas of the surface loose layer had fallen off,exposing the dense layer combined with the substrate;and some areas of the surface layer still remained loose. The thickness of the film was 50��60 ��m. This was also confirmed by the fitting results of Wagner model,which further proved the accuracy of Wagner model. The main interference factor affecting the film growth rate was thermal shock,and the fitting results showed that Wagner model had better anti-interference performance.From the results of six groups of experiments,Wagner model predicted that the film thickness in three years would be between 54.00 and 95.10 ��m. The above results could be used as a reference for the prediction of the growth of the in-situ oxide film on the surface of zirconium hydride in practical application. It could also provide a reference model for the growth of oxide film on metal surface.
Keyword��
zirconium hydride;in-situ oxide film;weight gain simulation of oxidation;
�⻯ﯵķ����¶�Ϊ600�棬����Ϊ100 k Pa��CO2��He�Ļ��������50%��������������ڸ������£��⻯ﯵı���Ĥ���Ի��Ի����ٶȳ���������Ĥ������������⻯ﯱ��������������������⣬��һ�����ŷ���ʱ����ӳ����⻯ﯻ��彫���٣��Ӷ��������������ܣ������⻯ﯱ�������������ķ�Ӧ���ڵ�CO2�����յ�������ϵͳʧЧ������о��⻯��������ڹ��������µ��������ʲ���������ɣ���������ϵͳ����ƾ��нϴ�IJο����塣��������ϱ������
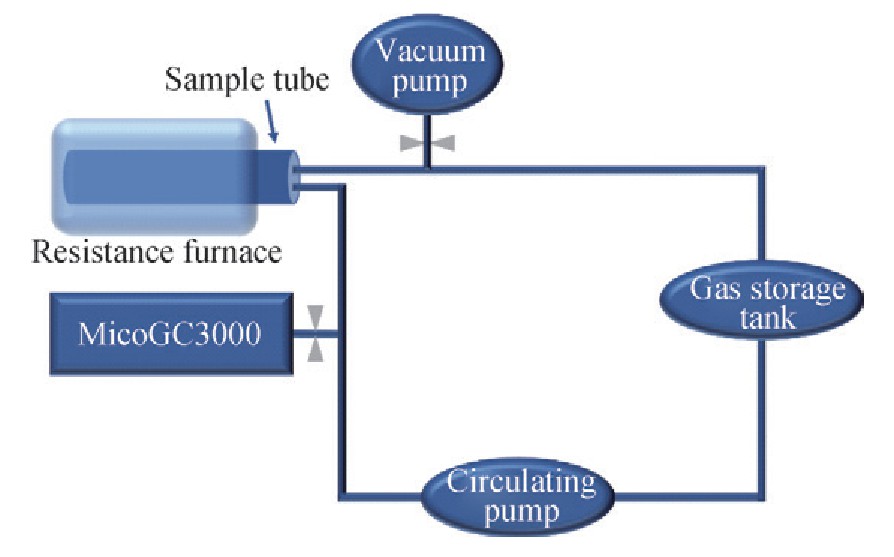
[18]������ͬ��Ŀǰ���⻯��������ع����о��ķ�����Ҫ�г��ط���������Ĥ���Ȳ������ȣ���������Ҫ�����ڽ���Ʒ�Ӹ���¯��ȡ����������Ʒԭ�����գ����Ի�÷���ʵ�ʵ����ݺ��ɡ�������ɫ�����������ڲ�������Ʒ�������գ����Զ���Ʒ����ԭλ��⡣
��Ʒװ¯������ϵ�г��벻ͬѹ����CO2��He�����Ϊ1��1�Ļ���������ϵ������б궨���궨���������û������ϴ¯���Σ�Ȼ���ѹ��300 k Pa����Ʒ����600����¼��ȡ�ÿ��һ��ʱ��������ɫ����һ����ϵ������ɷֲ��ԡ�����ǰ�ڶ�ʵ���̽�������֪��ϵCOŨ�Ȳ�����3%����ѡȡCO�����ֱ�Ϊ0.1%,1%,3%��3ƿ�����Ʊ������ߡ�
ͼ1 �⻯����ܿ���װ��
Fig.1 Performance evaluation device of zirconium hydride