2195��﮺Ͻ���ѧ���ܼ���֯���ȼ�ѹ���������ι��̵������
��Դ�ڿ����й���ɫ����ѧ��(Ӣ�İ�)2020���4��
�������ߣ������� ��� ���� �ƽ��� �Ƴ� ���Ӣ ֣����
����ҳ�룺835 - 849
�ؼ��ʣ���﮺Ͻ���������ѹ��֯���������ࣻǿ��
Key words��Al-Li alloy; cold-rolling; extrusion; texture; precipitate; strength
ժ Ҫ�����ü�ѹ���������������Ʊ�2195��﮺Ͻ��ģ��о����ܴ�����ѹ��ļ����������֯���Լ�T8ʱЧ��������༰����ǿ�ȡ������������ѹ��T8ʱЧʱT1(Al2CuLi)��ֲ������ȶ��������ڽ϶̡���ѹ����ܴ�����δ�����ٽᾧ������֯��Brass��S���������55.28%��������������ܴ������������ٽᾧ����S����֯����ʧ�����ڹ���̬��ѹ��Brass��S֯�������ߣ���Schmid���Ӵ�Ч����ϵ�����٣����������ǿ�Ȳ����������ڹ���̬�����壬������ǿ�������Խϸߡ����⣬��Ԥ���κ��ʱЧ�����У���Щ����֯���ٽ�T1�������Ȼ������������Ӷ�����ʱЧ̬��ѹ������ǿ�ȼ�����ǿ�Ⱦ�����ʱЧ����������塣
Abstract: 2195 Al-Li alloy was deformed through extrusion followed by cold-rolling. The textures of the extruded plate and cold-rolled sheet after solutionization were investigated. The longitudinal strength and precipitates after T8 aging were measured and observed, respectively. Compared to those in the sheet, T1(Al2CuLi) precipitates in the extruded plate after T8 aging are non-uniform, and their incubation time is shorter. The extruded plate after solutionization is not recrystallized and contains 55.28% deformation textures of Brass and S. In the cold-rolled sheet after solutionization, massive recrystallization occurs and S component disappears. Due to the higher fraction of Brass and S textures with higher Schmid factor and lower equivalent sliding system number, the extruded plate possesses an yield strength not higher or even lower, but a tensile strength higher, than the cold-rolled sheet after solutionization. In addition, during the aging after pre-stretch, these textures promote T1 precipitation on preferred sliding planes of cold-rolled sheet and cause its higher yield strength and tensile strength after T8 aging.
Trans. Nonferrous Met. Soc. China 30(2020) 835-849
Yun-long MA1,2,3, Jin-feng LI1,4, Run-zhe ZHANG1, Jian-guo TANG1, Cheng HUANG3, Hong-ying LI1, Zi-qiao ZHENG1
1. School of Materials Science and Engineering, Central South University, Changsha 410083, China;
2. Beijing Institute of Astronautical Systems Engineering, Beijing 100076, China;
3. Light Alloy Research Institute, Central South University, Changsha 410083, China;
4. Key Laboratory of Nonferrous Materials Science and Engineering of Ministry of Education, Central South University, Changsha 410083, China
Received 6 August 2019; accepted 3 March 2020
Abstract: 2195 Al-Li alloy was deformed through extrusion followed by cold-rolling. The textures of the extruded plate and cold-rolled sheet after solutionization were investigated. The longitudinal strength and precipitates after T8 aging were measured and observed, respectively. Compared to those in the sheet, T1(Al2CuLi) precipitates in the extruded plate after T8 aging are non-uniform, and their incubation time is shorter. The extruded plate after solutionization is not recrystallized and contains 55.28% deformation textures of Brass and S. In the cold-rolled sheet after solutionization, massive recrystallization occurs and S component disappears. Due to the higher fraction of Brass and S textures with higher Schmid factor and lower equivalent sliding system number, the extruded plate possesses an yield strength not higher or even lower, but a tensile strength higher, than the cold-rolled sheet after solutionization. In addition, during the aging after pre-stretch, these textures promote T1 precipitation on preferred sliding planes of cold-rolled sheet and cause its higher yield strength and tensile strength after T8 aging.
Key words: Al-Li alloy; cold-rolling; extrusion; texture; precipitate; strength
1 Introduction
Al-Li alloys have a combination of better fatigue performance, higher specific stiffness, higher strength and toughness than those of traditional Al alloys [1]. These advantages have led to the third generation Al-Li alloys being increasingly substituted for conventional 2xxx and 7xxx Al alloys in aerospace and spacecraft industries [1]. In the 1980s, POLMEA and CHESTE [2] found that as 0-2.5% Li was added to Al-4%Cu-0.3%Mg-0.4%Ag alloy, the 1.0% Li addition displayed the highest hardening effect. This discovery is attributed to the development of high strength Al-Li alloy containing 1% Li by adding small Mg and Ag. Since then, 2095, 2195, 2050 and 2198 Al-Cu-Li alloys containing micro- alloying elements of Mg and Ag were developed [3-5]. Among them, 2195 Al-Li alloy, one of the 3rd generation Al-Li alloys, has been successfully applied in the external tank of space shuttles.
Precipitation strengthening is the major strengthening mechanism for Al-Li alloys. Their main aging precipitates are T1(Al2CuLi), �ġ�(Al3Li) and �ȡ�(Al2Cu) phases [6,7], of which the precipitate types are dependent on the Cu and Li concentrations [8-10]. Micro-alloying elements play an important role in controlling grain structures and precipitate distribution. It has been reported that minor Zr and Mn were added for recrystallization controlment [11,12]. The addition of Mg, Ag and Zn can change the distribution of T1 precipitates. Among them, Ag or Zn element is usually added with the combination of Mg element. For example, the combination of Mg+Ag is added to 2195, 2050 and 2198 Al-Li alloys, which accelerates the aging response, increases T1 nucleation density and therefore enhances the strength [13-15]. Mg+Zn combination is added to 2099, 2199 and 2A97 Al-Li alloys, which played a role similar to Mg+Ag combination [16,17]. In addition, minor Zn addition is found to enhance the corrosion resistance of Al-Li alloys [18-20].
It is known that the grain structures (including textures) of Al alloy are highly dependent on the deformation process [21], which further impact their precipitates and mechanical properties [22,23]. Among Al-Li alloys, 2196 and 2099 Al-Li alloys with higher Li content are mainly used as extrusions, the products of 2195 and some other Al-Li alloys with lower Li content are mainly plates produced by rolling. Although the mechanical properties and microstructures of 2195 Al-Li alloy extrusions prepared through spray deposition were recently reported [24-27], its extrusions prepared through melting and casting still need further investigation. In this case, a 2195 Al-Li alloy extruded plate with 5 mm in thickness was fabricated, and its structures and mechanical properties after solutionization and T8 aging were investigated. Meanwhile, the extruded plate was further cold-rolled to a sheet with 2 mm in thickness, in order to change the grain structures and compare the structure and mechanical properties after solutionization and T8 aging.
2 Experimental
2.1 Materials and procedures
A 2195 Al-Li alloy round ingot with a diameter of 90 mm was prepared. Its Cu and Li contents are 4.1% and 0.9% (mass fraction), respectively. The alloy ingot was homogenized and then extruded to a plate with a width of 70 mm and a thickness of 5 mm. A part of the plate was further rolled to a sheet with 2 mm in thickness through cold rolling.
After solutionization at 505 ��C for 40 min, the materials were quenched in cold water. For simplification, the extruded plate with 5 mm in thickness was denoted as sample E, and that after solutionization was abbreviated as sample E+S. While the cold-rolled sheet with 2 mm in thickness was referred to as sample E+CR, and the sample E+CR+S represented the cold-rolled sheet after solutionization. The solutionized samples were then subjected to a T8 temper, which is aged at 148 ��C for different time after 3.8% pre-stretch. The schematic diagram of the material processing is shown in Fig. 1.
2.2 Tensile tests
After T8 temper, the tensile properties of the plate and the sheet were measured using an MTS 858 universal testing machine with a strain rate of 1.0��10-3 s-1 at ambient temperature, respectively. Test samples with a parallel section gauged 30 mm in length and 8 mm in width were cut from the sheet, while samples with a parallel section gauged 50 mm in length and 12.5 mm in width were cut from the extruded plate. Three tensile tests were carried out for each condition, the average strength and elongation were then calculated.
2.3 Structure observations
The samples for metallographical observations were mechanically grounded and polished, washed ultrasonically with ethanol, and then anodically treated at 24 V in a solution containing 1.1 g H3BO3, 95 mL H2O and 3 mL HF. The metallographical observations were performed with an optical microscopy (OM, Leica DMI300 M).
The textures of the samples were measured through a Brucker D8 Discovery X-ray diffracto- meter. Incomplete polar figures (IPFs) of {111}, {200} and {220} were detected, then the orientation distribution function (ODF) was calculated, and particle swarm optimization (PSO) was used for the quantitative analysis of the textures.
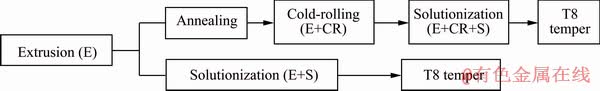
Fig. 1 Schematic diagram of material processing
Precipitates were observed through transmission electron microscopy (TEM). The TEM foils were parallel to the rolling plane and prepared by mechanical grinding and twin-jet electropolishing in a solution containing 30% nitric acid and 70% methanol (volume fraction) at -25 ��C with a voltage of 15-20 V. TEM observation was performed with a Tecnai G220 TEM operating at 200 kV through conventional bright-field (BF), dark-field (DF) imaging, and selected area electron diffraction (SAED).
3 Results
3.1 Tensile properties
Figure 2 shows the yield strength, tensile strength and elongation of the 2195 Al-Li alloy as a function of T8 aging time and representative engineering stress-strain curves. As shown in Figs. 2(a) and (b), after T8 aging, the extruded plate and cold-rolled sheet show a similar trend in the strength variation, both the yield strength and the tensile strength increase rapidly with the aging time. During the aging time of 40-150 h, there is little change in the yield strength and tensile strength.
It is noted that the yield strength and tensile strength of the T8-aged extrusions are higher than those of the T8-aged cold-rolled sheet during the aging period of 16-150 h. However, another phenomenon should be emphasized. The yield strength of the sample E+S is not higher, or even lower than that of the sample E+CR+S. Nevertheless, after T8 aging, the yield strength of the aged sample E+S becomes much higher than that of the aged sample E+CR+S. As shown in Fig. 2(a), the yield strength difference between the sample E+S and the sample E+CR+S is about -2 MPa, but the difference between the aged sample E+S and the aged sample E+CR+S after 38 h of T8 aging is about 62 MPa.
For the tensile strength, it is much different. The tensile strength of the sample E+S is obviously higher than that of the sample E+CR+S. As shown in Fig. 2(b), the tensile strength difference between the sample E+S and the sample E+CR+S is about 20-30 MPa.
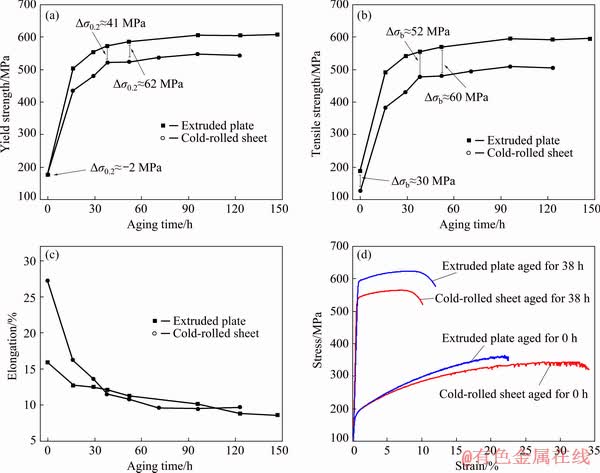
Fig. 2 Yield strength (a), tensile strength (b) and elongation (c) of 2195 Al-Li alloy as function of T8 aging time and representative engineering stress-strain curves (d)
With the aging time extension, the elongation decreases first and then keeps stable (Fig. 2(c)). The elongation of the aged extrusions is much lower than that of the aged cold-rolled sheet during the aging time of 0-30 h. After aging for time longer than 40 h, there is little difference. Figure 2(d) shows the representative stress-strain curves of the 2195 Al-Li alloy. It is clearly described that both the yield strength and tensile strength of the extruded plate after aging are much higher than those of the cold-rolled sheet after aging. Meanwhile, it also indicates that the yield strength of the sample E+S is not higher, but its tensile strength is obviously higher than that of the sample E+CR+S. In addition, the strain hardening rate of the sample E+S is larger than that of the sample E+CR+S. As a result, although its elongation is much lower than that of the sample E+CR+S, it has a higher tensile strength.
3.2 Grain structures
Figure 3 shows the longitudinal sectional optical images of the 2195 Al-Li alloy. Both the sample E (Fig. 3(a)) and sample E+CR (Fig. 3(b)) exhibit fiber-like grains with a great aspect ratio. In addition, shear bands exist in the sample E+CR. After solutionization, the sample E+S still shows fiber-like grains with a great aspect ratio, indicating non-recrystallization (Fig. 3(c)). Although many grains of the sample E+CR+S display elongated feature, their aspect ratio is greatly decreased. Meanwhile, there also exist some equiaxed grains (Fig. 3(d)). These indicate that massive recrystallization occurs in the sample E+CR+S. Furthermore, the shear bands disappear in the sample E+CR+S, which further demonstrates its massive recrystallization [28].
Figure 4 shows the ODFs of different samples. In the sample E, there exist obvious Brass, S and Cube textures (Fig. 4(a)). In the sample E+S, the texture types are not changed, the main texture types are still Brass, S and Cube textures (Fig. 4(c)).
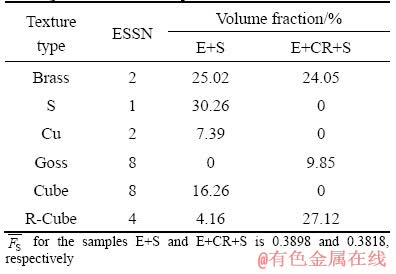
In the sample E+CR, there still exist Brass, S and Cube textures. Meanwhile, Goss texture is found (Fig. 4(b)). After solutionization, in the sample E+CR+S, S and Cube textures disappear, but Goss texture still exist. Meanwhile, R-Cube texture increases (Fig. 4(d)). According to the PSO method, the volume fractions of different textures in different samples are shown in Table 1.
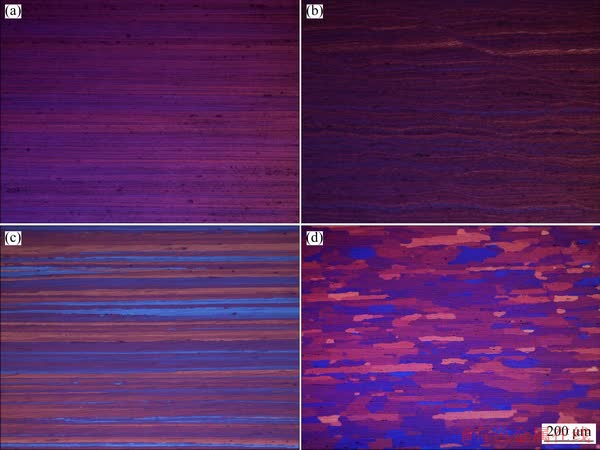
Fig. 3 Longitudinal sectional optical images of sample E (a), sample E+CR (b), sample E+S (c) and sample E+CR+S (d)
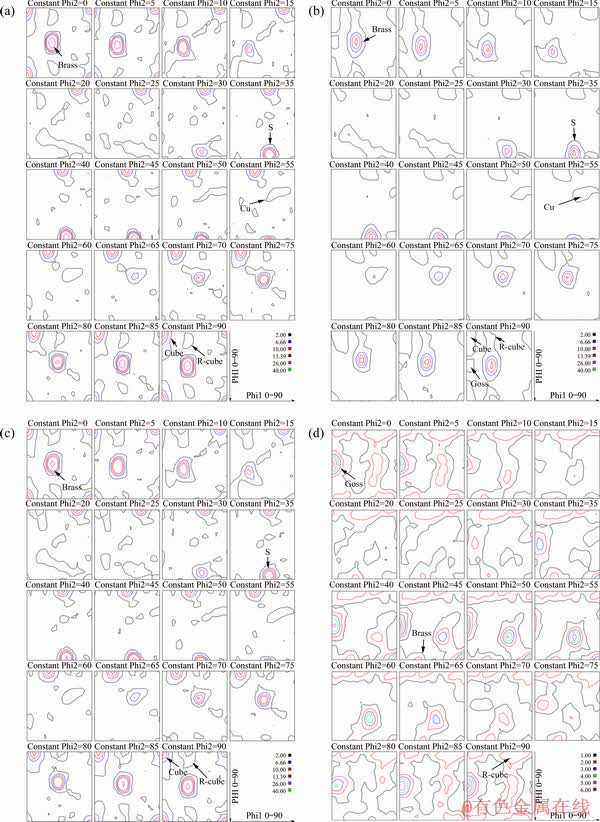
Fig. 4 ODFs of sample E (a), sample E+CR (b), sample E+S (c) and sample E+CR+S (d)
Table 1 Volume fraction of different textures in different samples (vol.%)
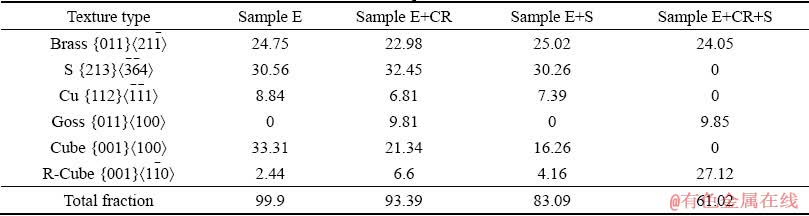
According to Table 1, in the samples E and E+ S, there is little alteration in the volume fraction of Brass, Cu, S and R-Cube textures, only the fraction of Cube texture is decreased from 33.3% to 16.3%. This further confirms non-recrystallization in the extruded plate after solutionization.
Compared to that in the sample E, in the sample E+CR, the Cube texture decreases, R-Cube texture increases, and Goss texture appears. After solutionization, in the sample E+CR+S, Brass and Goss textures are not changed, but the textures of S, Cu and Cube disappear. It is important that the volume fraction of R-Cube texture is much increased. These imply that massive recrystallization occurs.
3.3 Precipitate evolution
3.3.1 Extruded plate
Figure 5 shows the [112]Al and [100]Al SAED patterns and TEM images of the as-extruded 2195 Al-Li alloy plate after T8 aging at 148 ��C for 16 h. In the [112]Al SAED pattern, weak streaks passing through 1/3(220)Al and 2/3{220}Al (Fig. 5(a)) are observed, indicating a small number of T1 precipitates. Accordingly, fine T1 precipitates are observed in the DF image taken along the <112>Al direction (Figs. 5(c, d)). However, the T1 precipitates are non-uniform, and more T1 precipitates are distributed at the subgrain boundary (Figs. 5(c, d)). In the [100]Al SAED pattern, spots at {110}Al and {100}Al are observed. In addition, weak but continuous streaks passing through {200}Al spots are distinguished (Fig. 5(b)). Accordingly, �ġ� precipitates, GP zones and �ġ�/GP/�ġ� composite precipitates are observed in the DF and BF images taken along the <100>Al direction (Figs. 5(e, f)).
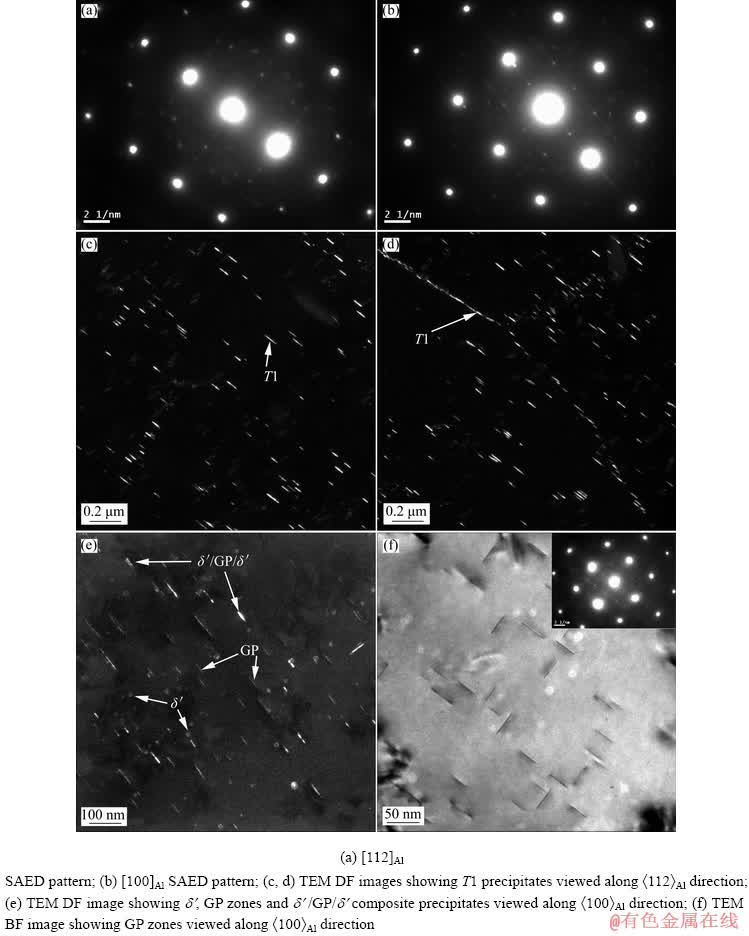
Fig. 5 SAED patterns and TEM images of as-extruded 2195 Al-Li alloy plate after aging at 148 ��C for 16 h
Figure 6 shows the [112]Al and [100]Al SAED patterns and TEM images of the as-extruded 2195 Al-Li alloy plate after T8 aging at 148 ��C for 38 h. In the [112]Al SAED pattern, strong streaks corresponding to T1 precipitates appear (Fig. 6(a)). Accordingly, many T1 precipitates are observed in the DF image taken along the <112>Al direction. However, although T1 precipitate size is increased, their distribution is still non-uniform (Figs. 6(c, d)). In the [100]Al SAED pattern, strong and continuous streaks passing through {200}Al, and discontinuous lines passing through {110}Al are observed (Fig. 6(b)). �ȡ� precipitates are therefore observed in the DF image taken along the <100>Al direction (Fig. 6(e)). However, in the BF image taken along the <100>Al direction, many GP zones are observed between the �ȡ� precipitates (Fig. 6(f)). Meanwhile, �ġ�/GP/�ġ� composite precipitates can be observed.
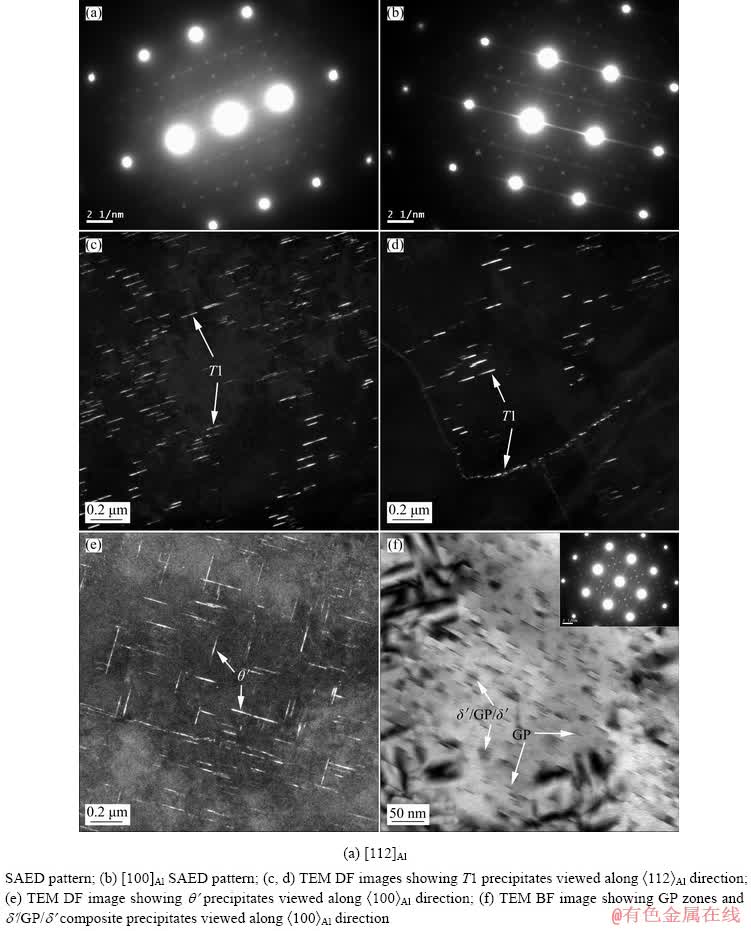
Fig. 6 SAED patterns and TEM images of as-extruded 2195 Al-Li alloy plate after aging at 148 ��C for 38 h
As the aging time is further extended to 96 h, the SAED patterns and TEM images are shown in Fig. 7. Clear streaks corresponding to T1 precipitates appear in the [112]Al SAED pattern (Fig. 7(a)), and bright spots of T1 precipitates also can be observed in the [100]Al SAED pattern (Fig. 7(b)). Accordingly, in the DF image taken along the <112>Al direction, more T1 precipitates with larger sizes are observed (Fig. 6(c)). It is also noted, the T1 precipitates are more uniform in the sample aged for 96 h than those in the sample aged for 38 h.
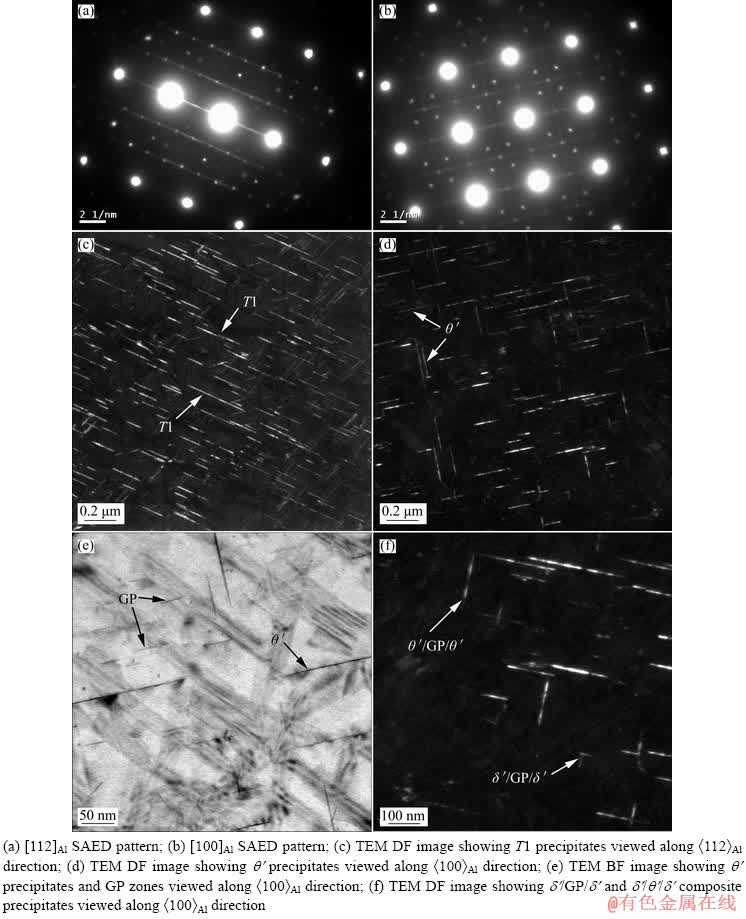
Fig. 7 SAED patterns and TEM images of as-extruded 2195 Al-Li alloy plate after T8 aging at 148 ��C for 96 h
In the [100]Al SAED pattern, streaks passing through {200}Al spots are continuous, but their intensity is greatly decreased. In addition, streaks passing through {110}Al spots are discontinuous. These indicate the existence of some �ȡ� precipitates and a certain fraction of GP zones with decreased amount. Furthermore, weak spots corresponding �ġ� precipitates still can be observed at {100}Al and {110}Al. Accordingly, A lot of �ȡ� precipitates are observed in the DF image taken along the <100>Al direction (Fig. 7(d)). In addition, much smaller number of GP zones, �ġ�/GP/�ġ� and �ġ�/�ȡ�/�ġ� composite precipitates are found in the BF and DF images viewed along the <100>Al direction (Figs. 7(e, f)).
3.3.2 Cold-rolled sheet
Figure 8 shows the SAED patterns and TEM images of the as-rolled 2195 Al-Li alloy sheet after T8 aging at 148 ��C for 16 h. In the [100]Al SAED pattern (Fig. 8(a)), in addition to the spots of the matrix, there appear strong and continuous streaks passing through {200}Al spots, which indicates the formation of a large number of GP zones. Accordingly, a lot of GP zones are observed in the BF image viewed along the <100>Al direction (Fig. 8(c)). Meanwhile, weak spots corresponding to �ġ� precipitates appear at {110}Al and {100}Al (Fig. 8(a)). Some fine �ġ� precipitates and �ġ�/GP/�ġ� composite precipitates are observed in the DF images viewed along the <100>Al direction (Figs. 8(d, e)). No streaks corresponding to T1 precipitates appear at 1/3(220)Al and 2/3{220}Al in the [112]Al SAED pattern (Fig. 8(b)), indicating that no T1 phases are precipitated.
As the aging time is extended to 38 h, the corresponding SAED patterns and TEM images are shown in Fig. 9. In the [112]Al SAED pattern (Fig. 9(a)), clear streaks passing through 1/3{220}Al and 2/3{220}Al spots are observed. Meanwhile, bright spots also appear at 1/3{220} and 2/3{220} in the [100]Al SAED pattern (Fig. 9(b)). These indicate that there exist a lot of T1 precipitates, concentrated and uniform T1 precipitates are therefore observed in the DF image viewed along the <112>Al direction (Fig. 9(c)). In addition, although continuous streaks passing through {200}Al spots are still observed, their intensity is obviously decreased (Fig. 9(b)), indicating that the fraction of GP zones is decreased. Meanwhile, spots at {100}Al and {110}Al still can be distinguished, and discontinuous streaks passing through {110}Al spots are observed in the [100]Al SAED pattern. Accordingly, �ȡ� precipitates, some �ġ�/GP/�ġ� and �ġ�/�ȡ�/�ġ� composite precipitates are observed (Figs. 9(d, e)).
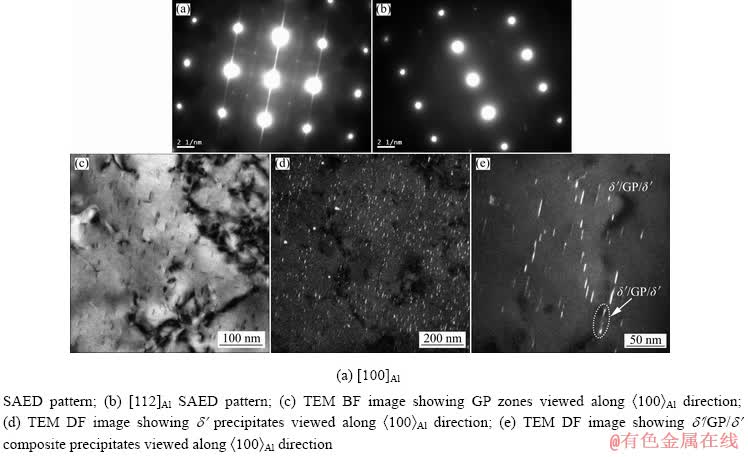
Fig. 8 SAED patterns and TEM images of as-rolled 2195 Al-Li alloy sheet after T8 aging at 148 ��C for 16 h
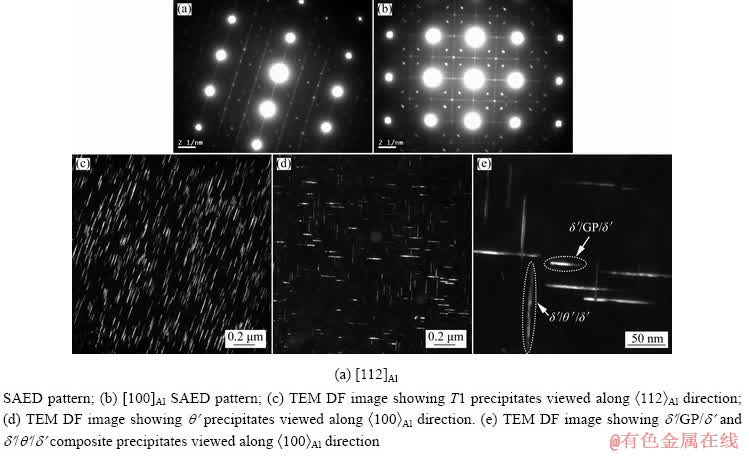
Fig. 9 SAED patterns and TEM images of as-rolled 2195 Al-Li alloy sheet after T8 aging at 148 ��C for 38 h
As the aging time is further extended to 96 h, the SAED patterns and TEM images are shown in Fig. 10. Clear streaks corresponding to T1 precipitates appear in the [112]Al SAED pattern (Fig. 10(a)), and a great number of T1 precipitates are therefore observed in the DF image taken along the <112>Al direction (Fig. 10(c)).
In the [100]Al SAED pattern (Fig. 10(b)), spots corresponding to �ȡ� precipitates are still observed, the intensity of the continuous streaks corresponding to GP zones is further weakened, and the spots corresponding to �ġ� precipitates are difficult to be distinguished. Many �ȡ� precipitates are observed in the DF image taken along the <100>Al direction (Fig. 10(d)). In addition, although the spots corresponding to �ġ� are difficult to be distinguished, a small number of �ġ�/GP/�ġ� and �ġ�/�ȡ�/�ġ� composite precipitates still can be found in the DF image viewed along the <100>Al direction (Fig. 10(e)).
3.3.3 Comparison of aging precipitation
According to the above TEM observations, there exist some differences for the extruded plate and cold-rolled sheet after T8 aging.
During the T8 aging process, the incubation period of T1 precipitation for the extruded plate is shorter than that for the cold-rolled sheet. In the extruded plate after 16 h of aging, fine T1 precipitates are observed (Fig. 5). However, in the cold-rolled sheet after the same time (16 h) of T8 aging, it is difficult to find T1 precipitates (Fig. 8).
T1 precipitates are distributed more uniformly in the cold-rolled sheet after T8 aging. As observed in the extruded plate after aging for 16 and 38 h, T1 precipitates are non-uniform (Figs. 5 and 6). Although no T1 precipitates are observed in the cold-rolled sheet after 16 h of aging (Fig. 8), they are distributed much uniformly after 38 h of T8 aging (Fig. 9). Meanwhile, it also seems that their density is much higher (Fig. 9(c)).
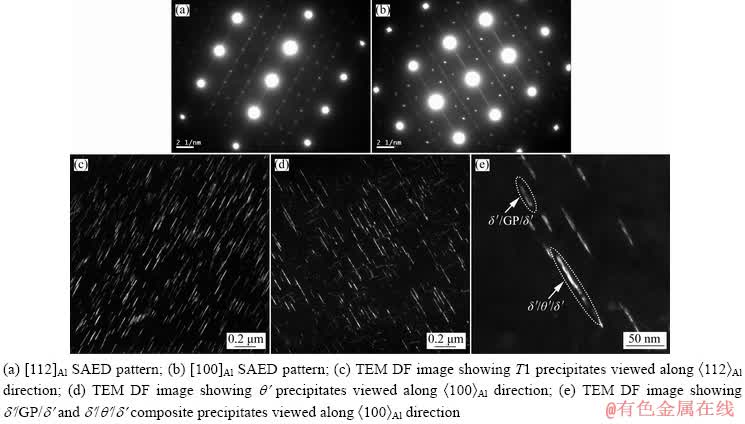
Fig. 10 SAED patterns and TEM images of as-rolled 2195 Al-Li alloy sheet after T8 aging at 148 ��C for 96 h
4 Discussion
4.1 Aging precipitate difference
The precipitates in the extruded plate and cold-rolled sheet after T8 aging are different, which is associated with the grain structures in the sample E+S and E+CR+S. The grains in the sample E+S display non-recrystallized fiber-like grains with high aspect ratio, while those in the sample E+CR+S present recrystallized grains with a lower aspect ratio. The sample E is extruded at a high temperature of 460 ��C, dynamic recovery and recrystallization occur during the extrusion process, and the final stored energy is lowered. However, in the sample E+CR, no dynamic recrystallization occurs due to the low temperature, and there exists high stored energy in the sample, which therefore causes massive recrystallization in the sample E+CR+S during the solutionization process. However, the low stored energy is not enough to cause recrystallization in the sample E+S during the solutionization.
The recrystallization difference impacts the dislocation density in the sample E+S and E+CR+S. Although the dislocation density in the sample E is lower than that in the sample E+CR, the dislocation density is much higher in the sample E+S, due to massive recrystallization in the sample E+CR+S.
This dislocation density difference contributes to the T1 precipitation difference. During solid state transformation, it is necessary to overcome the energy barrier for nucleation. For a given local super-saturation at a given site, the energy barrier is dependent on the misfit strain energy and interfacial energy. T1 precipitates are semi-coherent with Al matrix, which not only possesses interfacial energy but also a certain misfit strain energy. To overcome or minimize the resistance or energy barrier, T1 precipitates prefer to nucleate at the sites of dislocation, interface with low-angle grain boundary, stacking fault and vacancy cluster. Therefore, the dislocations in the solutionized alloy increase the nucleation rate of T1 precipitates [29].
Although 3.8% pre-stretch is applied, the total dislocation density will be higher after pre-stretch in the sample E+S, due to its much higher initial dislocation density. Therefore, T1 precipitation will be easier in the aged sample E+S, which is behaved as a shorter incubation time of T1 precipitates.
According to the TEM observations, it seems that the T1 precipitates in the sample E+CR+S after T8 aging for 38 h (Fig. 9) are more concentrated and uniform. However, there exist four T1 variants on different {111}Al planes. As viewed along the <112>Al direction, only one T1 variant can be observed. From the observations shown in Figs. 6 and 9, it is not sure that more T1 precipitates are formed in the aged sample E+CR+S than in the aged sample E+S.
KIM and LEE [30] observed the precipitates in 2090-T8E41 Al-Li alloy with a strong rolling texture of Brass {011}<211-> component by using TEM foils parallel to the rolling plane and perpendicular to the rolling plane, respectively. T1 precipitates in the foil perpendicular to the rolling plane were more uniformly distributed and their size and density were finer and larger respectively, than those in the foil parallel to the rolling plane, and this phenomenon was associated with Brass texture [30]. Prior to T8 aging, it was proposed that Brass texture existed, a pronounced {011}<211-> texture meant that two of the four possible {111}Al planes were oriented perpendicular to the rolling plane and the other two were inclined 35.3�� to the rolling plane. During the pre-stretch, plastic deformation was localized on different {111}Al plane because of different Schmid factor (FS). As shown in Table 2, two ��inclined�� {111} planes (inclined 35.3�� to the rolling plane) have the biggest FS of 0.41 and will experience the higher resolved shear stress during the pre-stretch. However, the other two ��edge-on�� {111}Al planes (perpendicular to the rolling plane) have small FS of 0.27 and 0, and will experience much smaller resolved shear stress during the pre-stretch. Therefore, more dislocations, i.e. more nucleation sites for T1 precipitates are introduced on these two ��inclined�� {111}Al planes by pre-stretch. Conversely, smaller T1 nucleation sites on the ��edge-on�� {111}Al planes are provided by the pre-stretch.
Strong S texture {213}<3-6-4> can cause a similar phenomenon. Its highest FS is 0.42, which has only one equivalent sliding system number (ESSN). Therefore, during the pre-stretch, more dislocations are introduced, and therefore more T1 precipitates nucleate on this {111}Al plane with the highest FS, and less T1 precipitates on the other {111}Al planes with lower FS. For the Cu texture, the highest FS is 0.27 with two ESSNs, which also cause non-uniform plastic deformation during the pre-stretch.
As for the Goss, Cube and R-Cube textures, their highest FS is 0.41, and ESSNs are 8, 8 and 4, respectively. This leads to more uniform plastic deformation on different {111}Al planes during the pre-stretch.
The total volume fraction of the textures in the sample E+S (83.09%) is larger than that in the sample E+CR+S (61.02%). However, it is more important that the total volume fraction of the textures with low ESSN (including Brass, S and Cu textures, 62.67%) in the sample E+S is much higher than that in the sample E+CR+S (24.05%). During the pre-stretch, the plastic deformation is more uniform in the sample E+CR+S than that in the sample E+S. This factor in turn leads to non-uniform distribution of T1 precipitates on different {111}Al planes in the aged sample E+S. Therefore, in the T8 aged sample E+S, T1 number density on some specific {111}Al planes is much higher than that on the other {111}Al planes. It is possible to observe lower density of T1 precipitates when TEM foil is parallel to the rolling plane. However, this does not mean that there are less T1 precipitates in the T8 aged sample E+S.
Table 2 Schmid factor (FS) of textures corresponding to {111}<110> sliding system in Al alloy
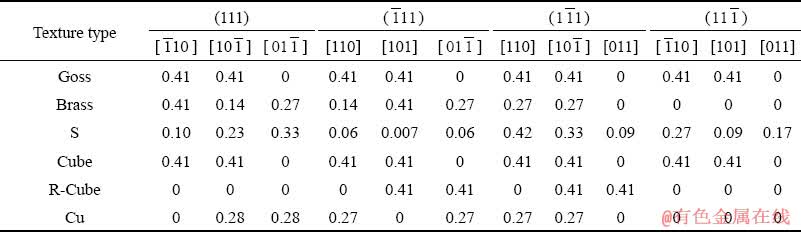
Table 3 ESSN and volume fractions of different textures and  for different samples
4.2 Strength difference
The yield strength of the sample E+S without aging is not higher, or even lower than that of the sample E+CR+S without aging. However, its tensile strength is much higher. It is interesting that both the yield strength and tensile strength of the sample E+S after T8 aging are obviously higher. This phenomenon is correlated with the texture difference and the resulting precipitation difference.
Table 3 lists the volume fractions of different textures and the total equivalent FS () for the sample E+S and E+CR+S. Considering the equivalent FS values of total textures [31] and the average FS (0.33) of FCC polycrystal, the is calculated according to the following equation.

where Fi means the fraction of different texture, i describes the texture type and n refers to the number of textures in the sample. FS0 and F0 represent the average FS and fraction of the rest polycrystal without texture, respectively.
It is found that the of the sample E+S is a little higher than that of the sample E+CR+S. Because no precipitate strengthening in the samples E+S and E+CR+S, higher means easier sliding of the dislocations, indicating lower yield strength. The higher of the sample E+S contributes to its strength not higher or even lower than that of the sample E+CR+S. However, higher total volume fraction of textures causes a greater geometric hardening (strain hardening) effect (Fig. 2(d)), which results in the higher tensile strength of the sample E+S [32].
After aging following the pre-stretch, T1 phases are precipitated on the {111}Al planes. As tensile experiments are performed, the dislocation sliding leading to plastic deformation occurs on one ��inclined�� {111}Al plane with higher FS in the Brass texture. In this case, the most effective barrier to the dislocation sliding will be the T1 precipitates lying on the other ��inclined�� {111}Al plane [30]. In the T8 aged sample E+S, because of its higher T1 density, it can be expected that the yield strength will be much higher due to the dislocation sliding barrier provided by T1 precipitates on the ��inclined�� {111}Al planes, in spite of lower T1 density on the ��edge-on�� {111}Al planes.
In the S texture, only one sliding system has a maximum FS of 0.42, which will accelerate the precipitation of T1 phases and increases their density on the corresponding {111}Al plane after aging following the pre-stretch. Because the dislocation sliding is hindered by the T1 precipitates on this sliding system with maximum FS, the yield strength is also highly improved.
According to the above analysis, the deformation textures of Brass and S do not show direct strengthening effect on the longitudinal yield strength of 2195 Al-Li alloy, which corresponds to the yield strength of the sample E+S not higher or even lower than that of the sample E+CR+S. However, these textures can increase the strain hardening rate (Fig. 2(d)), which therefore causes a higher tensile strength of the sample E+S. In addition, after T8 aging, these deformation textures cause the yield strength of the aged sample E+S much higher than that of the aged sample E+CR+S, by increasing T1 nucleation sites during pre-stretch and promoting T1 precipitation on specific {111}Al sliding plane (i.e. preferred sliding plane) with larger FS.
5 Conclusions
(1) The precipitates in the aged 2195 Al-Li alloy include T1 (Al2CuLi), �ȡ�(Al2Cu) and �ġ� (Al3Li) phases, GP zones and �ġ�/GP/�ġ� composite precipitates. However, compared to those in the cold-rolled sheet, T1 precipitates in the extruded plate after T8 aging are non-uniform and their incubation time is shorter.
(2) The extruded plate after solutionization is not recrystallized and has a total volume fraction 83.09% of textures, including 55.28% deformation textures of Brass and S. In the cold-rolled sheet after solutionization, massive recrystallization occurs, the total fraction of textures decreases to 61.02% and deformation texture S disappears.
(4) After solutionization, the extruded plate possesses a yield strength not higher or even lower, but a tensile strength higher, than the cold-rolled sheet, due to its higher fraction of Brass and S textures with higher maximum FS and low ESSN. However, after T8 aging, these textures increase T1 nucleation sites during the pre-stretch and therefore promote T1 precipitation on specific sliding planes (i.e. preferred sliding planes), which in turn causes a much higher yield strength of the extruded plate.
References
[1] RIOJA R J, LIU J. The evolution of Al-Li base products for aerospace and space applications [J]. Metallurgical and Materials Transactions A, 2012, 43: 3325-3337.
[2] POLMEAR I J, CHESTE R J. Abnormal hardening of an Al-Cu-Mg alloy containing silver and lithium [J]. Scripta Metallurgica, 1989, 23: 1213-1218.
[3] ALEXOPOULOS N D, MIGKLIS E, STYLIANOS A, MYRIOUNIS D. Fatigue behavior of the aeronautical Al-Li (2198) aluminum alloy under constant amplitude loading [J]. International Journal of Fatigue, 2013, 56: 95-105.
[4] TROEGER L P, WAGNER J A. Microstructure and mechanical property characterization of shear formed Al-Li alloy 2195 for launch vehicle applications [J]. Journal of Materials Processing and Manufacturing Science, 2001, 9(3): 205-222.
[5] LEE E W, KALU P N, BRANDAO L, ES-SAID O S, FOYOS J, GARMESTANI H. The effect of off-axis thermomechanical processing on the mechanical behavior of textured 2095 Al-Li alloy [J]. Materials Science and Engineering A, 1999, 265(1-2): 100-109.
[6] BETSOFEN S Y, ANTIPOV V V, GRUSHIN I A, KNYAZEV M I, KHOKHLATOVA L B, ALEKSEEV A A. Effect of the composition of Al-Li alloys on the quantitative relation between the �ġ�(Al3Li), S1(Al2MgLi), and T1(Al2CuLi) phases [J]. Russian Metallurgy, 2015(1): 51-58.
[7] GAO Z, CHEN J H, DUAN S Y, YANG X B, WU C L. Complex precipitation sequences of Al-Cu-Li-(Mg) alloys characterized in relation to thermal ageing processes [J]. Acta Metallurgica Sinica (English Letters), 2016, 29(1): 94-103.
[8] LI J F, LIU P L, CHEN Y L, ZHANG X H, ZHENG Z Q. Mechanical properties and microstructures of Mg, Ag and Zn multi-microalloyed Al-(3.2~3.8)Cu-(1.0~1.4)Li alloys [J]. Transactions of Nonferrous Metal Society of China, 2015, 25(7): 2103-2112.
[9] DECREUS B, DESCHAMPS A, GEUSER F D, DONNADIEU P, SIGLI C, WEYLAND M. The influence of Cu/Li ratio on precipitation in Al-Cu-Li-x alloys [J]. Acta Materialia, 2013, 61: 2207-2218.
[10] PENG Z W, LI J F, SANG F J, CHEN Y L, ZHANG X H, ZHENG Z Q, PAN Q L. Structures and tensile properties of Sc-containing 1445 Al-Li alloy sheet [J]. Journal of Alloys and Compounds, 2018, 747: 471-483.
[11] TSIVOULAS D, PRANGNELL P B. The effect of Mn and Zr dispersoid-forming additions on recrystallization resistance in Al-Cu-Li AA2198 sheet [J]. Acta Materialia, 2014, 77: 1-16.
[12] LEQUEU Ph, SMITH K P, DANIELOU A. Aluminum- copper-lithium alloy 2050 developed for medium to thick plate [J]. Journal of Materials Engineering and Performance, 2010, 19: 841-847.
[13] HUANG B P, ZHENG Z Q. Independent and combined roles of trace Mg and Ag additions in properties precipitation process and precipitation kinetics of Al-Cu-Li-(Mg)-(Ag) -Zr-Ti alloys [J]. Acta Materialia, 1998, 46: 4381-4393.
[14] MURAYAMA M, HONO K. Role of Ag and Mg on precipitation of T1 phase in an Al-Cu-Li-Mg-Ag alloy [J]. Scripta Materialia, 2001, 44: 701-706.
[15] HUANG B P, ZHENG Z Q. Effects of small additions Mg and Ag on precipitation process of Al-Cu-Li-(Mg)-(Ag) -Zr alloy [J]. Transactions of Nonferrous Metal Society of China, 1998, 8: 357-362.
[16] ZHU X H, ZHENG Z Q, ZHONG S, LI H Y. Effect of Mg and Zn elements on the mechanical properties and precipitates in 2099 alloy [C]// KUMAI S, UMEZAWA O, TAKAYAMA Y, TSUCHIDA T, SATO T. Proceedings of the 12th International Conference on Aluminum Alloys (ICAA12). Yokoha, Japan: The Japan Institute of Light Metals. 2010: 2375-2380.
[17] WEI Xiu-yu, ZHENG Zi-qiao, SHE Ling-juan, CHEN qiu-ni, LI Shi-chen. Microalloying roles of Mg and Zn additions in 2099 Al-Li Alloy [J]. Rare Metal Materials and Engineering, 2010, 39(9): 1583-1587. (in Chinese)
[18] LI J F, BIRBILIS N, LIU D Y, CHEN Y L, ZHANG X H, CAI C. Intergranular corrosion of Zn-free and Zn micro-alloyed Al-xCu-yLi alloys [J]. Corrosion Science, 2016, 105: 44-57.
[19] LIU D Y, LI J F, MA Y L, GUPTA R K, BIRBILIS N, ZHANG R.A closer look at the role of Zn in the microstructure and corrosion of an Al-Cu-Li alloy [J]. Corrosion Science, 2018, 45: 220-231.
[20] LI J F, XU L, CAI C, CHEN Y L, ZHANG X H, ZHENG Z Q. Mechanical property and intergranular corrosion sensitivity of Zn-free and Zn micro-alloyed Al-2.7Cu- 1.7Li-0.3Mg alloys [J]. Metallurgical and Materials Transaction A, 2014, 45(12): 5736-5748.
[21] DORIN T, DESCHAMPS A, GEUSER F D, ROBAUT F. Impact of grain microstructure on the heterogeneity of precipitation strengthening in an Al-Li-Cu alloy [J]. Materials Science and Engineering A, 2014, 627: 51-55.
[22] MA Y L, LI J F, SANG F J, LI H Y, ZHENG Z Q, HUANG C. Grain structure and tensile property variation of Al-Li alloy sheet caused by different cold rolling reduction [J]. Transactions of Nonferrous Metal Society of China, 2019, 29(8): 1569-1582.
[23] CHO K K, CHUNG Y H, LEE C W, KWUN S I, SHIN M C. Effects of grain shape and texture on the yield strength anisotropy of Al-Li alloy sheet [J]. Scripta Materialia, 1999, 40(6): 651-657.
[24] WANG Y X, ZHAO G Q, XU X, CHEN X X, ZHANG W D. Microstructures and mechanical properties of spray deposited 2195 Al-Cu-Li alloy through thermo-mechanical processing [J]. Materials Science and Engineering A, 2018, 727: 78-89.
[25] ZHANG Q Y, ZHANG C S, LIN J, ZHAO G Q, CHEN L, ZHANG H. Microstructure analysis and low-cycle fatigue behavior of spray-formed Al-Li alloy 2195 extruded plate [J]. Materials Science and Engineering A, 2019, 742: 773-787.
[26] XU X, ZHAO G Q, WANG Y X, CHEN X X, ZHANG C S. Microstructural evolution and its effect on mechanical properties of spray deposited 2195 alloy during porthole die extrusion process [J]. Vacuum, 2019, 167: 28-39.
[27] WANG Y X, ZHAO G Q, CHEN X X, XU X, CHEN L, ZHANG C S. Effect of inter-annealing between two stages of extrusion on the microstructure and mechanical property for spray deposited Al-Cu-Li alloy 2195 [J]. Journal of Materials Research and Technology, 2019, 8(5): 3891-3907.
[28] HUANG Hong-fei, JIANG Feng, LIU Xing-tao, ZHOU Jiang, ZHONG Mu-chun, WEI Li-li. Effects of Al3(Sc, Zr) particles and shear bands on recrystallization and fracture behaviors of Al-Mg-Sc-Zr alloy [J]. The Chinese Journal of Nonferrous Metals. 2015, 25(5): 1117-1127. (in Chinese)
[29] LI J F, YE Z H, LIU D Y, CHEN Y L, ZHANG X H, XU X Z, ZHENG Z Q. Influence of pre-deformation on aging precipitation behavior of three Al-Cu-Li alloys [J]. Acta Metallurgica Sinica (English Letters), 2017, 30(2): 133-145.
[30] KIM N J, LEE E W. Effect of T1 precipitate on the anisotropy of Al-Li alloy 2090 [J]. Acta Metallurgica et Materialia, 1993, 41(3): 941-948.
[31] XU Y Q, ZHAN L H, HUANG M H, LIN C H, WANG X. Anisotropy in creep-aging behavior of extruded Al-Cu-Mg alloy [J]. International Journal of Lightweight Materials and Manufacture, 2018, 1: 40-46.
[32] LOPES A B, BARLAT F, GRACIO J J, FERREIRA DUARTE J F, RAUCH E F. Effect of texture and microstructure on strain hardening anisotropy for aluminum deformed in uniaxial tension and simple shear [J]. International Journal of Plasticity, 2003, 19(1): 1-22.
������1,2,3�����1,4������1���ƽ���1���� ��3�����Ӣ1��֣����1
1. ���ϴ�ѧ ���Ͽ�ѧ�빤��ѧԺ����ɳ 410083��
2. �����ϵͳ�����о��������� 100076��
3. ���ϴ�ѧ ��Ͻ��о�Ժ����ɳ 410083��
4. ���ϴ�ѧ ��������ɫ���������빤���ص�ʵ���ң���ɳ 410083
ժ Ҫ�����ü�ѹ���������������Ʊ�2195��﮺Ͻ��ģ��о����ܴ�����ѹ��ļ����������֯���Լ�T8ʱЧ��������༰����ǿ�ȡ������������ѹ��T8ʱЧʱT1(Al2CuLi)��ֲ������ȶ��������ڽ϶̡���ѹ����ܴ�����δ�����ٽᾧ������֯��Brass��S���������55.28%��������������ܴ������������ٽᾧ����S����֯����ʧ�����ڹ���̬��ѹ��Brass��S֯�������ߣ���Schmid���Ӵ�Ч����ϵ�����٣����������ǿ�Ȳ����������ڹ���̬�����壬������ǿ�������Խϸߡ����⣬��Ԥ���κ��ʱЧ�����У���Щ����֯���ٽ�T1�������Ȼ������������Ӷ�����ʱЧ̬��ѹ������ǿ�ȼ�����ǿ�Ⱦ�����ʱЧ����������塣
�ؼ��ʣ���﮺Ͻ���������ѹ��֯���������ࣻǿ��
(Edited by Xiang-qun LI)
Foundation item: Project (2013AA032401) supported by the National High Technology Research and Development Program of China
Corresponding author: Jin-feng LI; Tel: +86-13278861206; E-mail: lijinfeng@csu.edu.cn
DOI: 10.1016/S1003-6326(20)65258-X

