
J. Cent. South Univ. (2018) 25: 2049-2057
DOI: https://doi.org/10.1007/s11771-018-3894-5

Determination of key parameters of Al–Li alloy adhesively bonded joints using cohesive zone model
YUAN Shun(袁顺), LI Yi-bo(李毅波), HUANG Ming-hui(黄明辉), LI Jian(李剑)
State Key Laboratory of High Performance Manufacturing, Central South University, Changsha 410083, China
 Central South University Press and Springer-Verlag GmbH Germany, part of Springer Nature 2018
Abstract: The key parameters of the adhesive layer of a reinforcing patch are of great significance and affect the ability to suppress crack propagation in an Al–Li alloy patch-reinforced structure. This paper proposes a method to determine the key parameters of the adhesive layer of adhesively bonded joints in the Al–Li alloy patch-reinforced structure. A zero-thickness cohesive zone model (CZM) was selected to simulate the adhesive layer’s fracture process, and an orthogonal simulation was designed to compare against the test results. A three-dimensional progressive damage model of an Al–Li alloy patch-reinforced structure with single-lap adhesively bonded joints was developed. The simulation’s results closely agree with the test results, demonstrating that this method of determining the key parameters is likely accurate. The results also verify the correctness of the cohesive strength and fracture energy, the two key parameters of the cohesive zone model. The model can accurately predict the strength and fracture process of adhesively bonded joints, and can be used in research to suppress crack propagation in Al–Li alloy patch-reinforced structures.
Key words: Al–Li alloy; cohesive zone model; adhesively bonded joints; fracture energy
Cite this article as: YUAN Shun, LI Yi-bo, HUANG Ming-hui, LI Jian. Determination of key parameters of Al–Li alloy adhesively bonded joints using cohesive zone model [J]. Journal of Central South University, 2018, 25(9): 2049–2057. DOI: https://doi.org/10.1007/s11771-018-3894-5.
1 Introduction
According to available statistics, more than 80% of aircraft fracture accidents is caused by fatigue cracks [1]. Thus, the suppression and elimination of fatigue cracks in aircraft integral panels have become an important goal of researchers. Currently, the patch-reinforced structure is used by many research institutions because of the good resulting effect, convenience and high reliability. Due to its high specific strength and ease of repair, adhesive bonding has become highly competitive among the traditional join techniques [2]. Therefore, it is of great significance to study the effects of patch-reinforced structure on the crack suppression of Al–Li alloy integral panel.
DUGDALE [3] first proposed the concept of cohesive zone model (CZM). BARENBLATT [4] proposed using CZM theory to study the problem of quasi-brittle material fracture. XU et al [5] used exponential CZM and analyzed the crack propagation process by inserting the cohesive element into the grid boundary. Based on the aforementioned work, NEEDLEMEN [6, 7] used the polynomial and exponential traction separation laws and further developed the CZM theory. TVERGAARD et al [8] used the CZM to study the initiation and expansion of a crack, and as such, there was a new development in CZM theory. The two key parameters for the CZM are cohesive strength and fracture energy [9], but before now there has been no effective way to determine them. This study proposes to do so. As the patch-reinforced structure of Al–Li alloy integral panel is mainly mode II fracture, a single-lap adhesively bonded joint is adopted to test adhesive properties. The bonding strength test and the double cantilever beam (DCB) test are used to calculate the cohesive strength and fracture energy. This study also establishes the finite element model of two test pieces of an Al–Li alloy with single-lap adhesively bonded joints with a cohesive element. Finally, an orthogonal simulation is designed for comparison against the physical test to verify the accuracy of both the parameters and the model.
2 Cohesive zone model
2.1 Mode of fracture failure
There are three modes of CZM fracture failure: Mode I (opening), Mode II (sliding), and Mode III (tearing). This paper aims to analyze the failure by fracture of the test single-lap adhesively bonded joints. The stress component on the adhesive layer is mainly shear stress, with normal stress being much less. Therefore, Mode II is the predominant fracture mode of the model in this paper. For convenience of analysis, the adhesive layer is considered to have a zero-thickness three- dimensional cohesive element [10].

Figure 1 Three modes of CZM fracture failure
2.2 Initial failure criterion and damage criterion
The secondary stress criterion is used to determine initial failure of the cohesive element [11, 12]. The secondary stress criterion is as follows:
 (1)
(1)
where σn is the normal stress, σs is shear stress in the first direction, σt is shear stress in the second direction, and fI, fII and fIII are the stress intensities in their respective directions. And these variables are related as follows:
 (2)
(2)
This is because under compressive load, the material will not be damaged. The CZM in this paper uses the Benzeggagh-Kenane criterion [13, 14] to determine the final fracture of the cohesive element, which is expressed as follows:
 (3)
(3)
where Gm,c (m=I, II, III) represents the critical fracture energy, m indicates the mode of CZM fracture failure, and η represents the exponent of the semi-empirical criteria applied to the crack initiation and expansion process. Generally, η=1–2.
2.3 Cohesive strength
In real-world physics, cohesive force is the interaction between atoms and molecules. In CZM theory, the crack tip process zone is assumed to be comprised of some tensile connections on the crack interface. When the stress reaches a certain value, the element begins to crack. The fracture failure occurs in the crack tip process zone, and its constitutive relation is represented by the traction–separation (T–S) law. The T–S law in Figure 2 characterizes the relationship between traction and displacement across cohesive surfaces [15]. The maximum stress in the T–S law is the cohesive strength, σc. The initial stiffness of the curve is controlled by the adhesive’s elastic modulus.

Figure 2 Relation ship of T–S law
The cohesive strength of the adhesive can be measured by the standard adhesive strength test:
 (4)
(4)
where Fmax is the load applied on the plate when the adhesive layer breaks, and A is the cross-sectional area of the Al–Li alloy plate. The cohesive strength of the FM94 adhesive used in this paper, as given by Eq. (4), is 30.12 MPa.
2.4 Fracture energy
The area under the T–S law curve is the cohesive fracture energy, Gc [16]. For mode Ⅱ fracture, the fracture energy can be measured by a double cantilever beam test [17–19].
According to the mechanics of fracture, the fracture energy can be expressed as:
 (5)
(5)
where U is the energy consumed by the process of crack propagation, A is the plate’s cross-sectional area, b is the width of specimen, and a is the crack length.
 (6)
(6)
Equation (5) can be rewritten as:
 (7)
(7)
where GIIC is the critical fracture energy of mode II fracture of the adhesive layer. Part of the external work is transformed into strain energy and the rest is consumed by crack propagation. Thus, fracture energy can be defined as:
 (8)
(8)
where W means the external work applied by the test machine and V is the specimen’s strain energy. According to mechanics of materials, the change for slope Φ with the influence of the applied bending moments is given by:
 (9)
(9)
where Φ is the angle of rotation, E is the elastic modulus of the specimen, M is the bending moment applied in test, and I is the section’s moment of inertia. Let us consider a beam with two applied bending moments M1 and M2 as shown in Figure 3. When the crack propagates from O to O′, then the changes in angles on two beams respectively are:
 (10)
(10)
 (11)
(11)
where
 (12)
(12)
 (13)
(13)
 (14)
(14)
 (15)
(15)
 (16)
(16)
 (17)
(17)
And
 (18)
(18)
 (19)
(19)
Thus we have:
 (20)
(20)
i.e.,
 (21)
(21)
For the beam with pure bending moments, the strain energy is given by
 (22)
(22)
Therefore, the change in the strain energy is
 (23)
(23)
i.e.,
 (24)
(24)
Finally, the fracture energy is defined by Eq. (8) as
 (25)
(25)
In this paper, the size and constraint conditions of the double cantilever specimen in mode II failure are shown in Figure 4. There has h1=h2=h, M1=M2=Pa/2 and the final result is
 (26)
(26)
Thus, the fracture energy can be determined by the test and Eq.(26) as GIIC=2.5 N/mm.

Figure 3 Cracked beam with bending moments
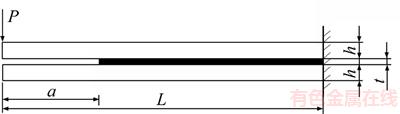
Figure 4 Double cantilever beam test
3 Finite element simulations
3.1 Finite element model
A three-dimensional model of the adhesively bonded joint is established by commercial finite element software ABAQUS to simulate the evolution of adhesive layer damage. In accordance with the standard test method to determine adhesive tensile shear strength (ASTM D1002), the size of the model and the test specimen are the same. Two Al–Li–S–4 plates were used in the test. The plate’s length L is 100 mm, the width b of the plate is 25 mm, the plate thickness is 2 mm, and the length of lap is 12.5 mm. In addition, the adhesive layer thickness in the experiment is 0.2 mm but is 0 mm in the model. The model and its constraint conditions are shown in Figure 5.
In the model, the adhesive layer adopts three- dimensional 8-node cohesive elements (COH3D8) and selects the bilinear traction-separation law. The plate uses three-dimensional stress elements (C3D8R). One end of the joint is fully constrained and the other is loaded by the axial tensile force. The two plate pieces and the adhesive layer are respectively divided into grids. All of the grids are hexahedral mesh and there are 35700 nodes and 28850 elements in total.
3.2 Material properties
The material parameters shown in Table 1 come from the performance manual provided by the manufacturer and related literatures [20, 21]. Some parameters of the finite element model involved in this work are selected for the reference.
3.3 Orthogonal simulation
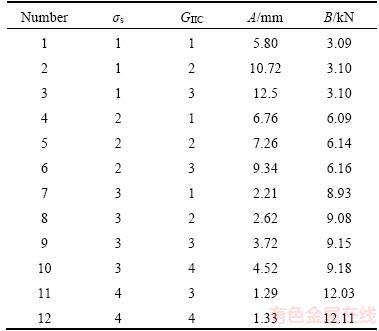
For verifying the correctness of the two key parameters obtained in this paper, an orthogonal simulation method is designed to be compared against the test results. There are two key factors: cohesive strength and fracture energy. Considering the parameters determined by the above method and the actual adhesive layer, cohesive strength and fracture energy were divided into four levels, respectively, which are 1, 2, 3, 4. The selected factor levels are shown in Table 2.
The orthogonal simulation table was established according to the constitutive relation and the traction-separation law of the adhesive layer material and the level table of orthogonal simulation factors. The results of orthogonal simulation are listed in Table 3, where A is the length the adhesive layer was torn when the joint is broken, and B is the applied load when the joint is broken.
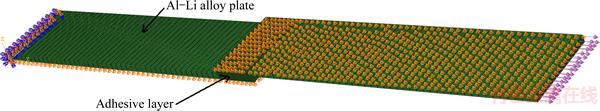
Figure 5 Finite element model and its constraint conditions
Table 1 Parameters of material

Table 2 Factor levels of orthogonal simulation

Table 3 Orthogonal simulation table and results
4 Analysis of test and simulation results
4.1 Test method
The test piece was composed of Al–Li–S–4 alloy. With reference to the standard tensile test (ASTM D1002) and the actual test conditions, the boundary conditions and geometric size of the specimen are shown in Figure 6. The adhesive used in the test is FM94K adhesive, produced by the Cytec Company. The adhesive layer is 0.2 mm thick and the end of the joint is secured during the loading process. The test was performed on an Instron3369 mechanical testing machine (Figure 7) at a tensile speed of 5 mm/min.
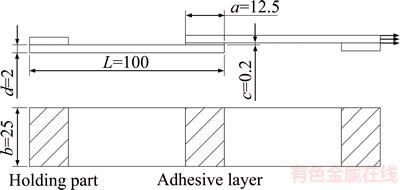
Figure 6 Geometric size of specimen (Unit: mm)
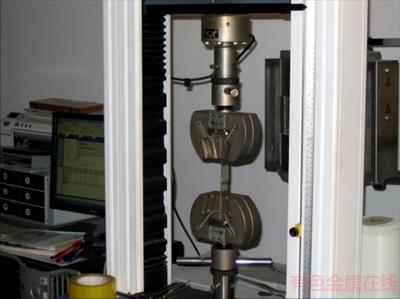
Figure 7 Instron3369 mechanical testing machine
4.2 Analysis of test and simulation results
Figure 8 shows the fracture process in the finite element simulation, where SDEG is the failure criterion of the cohesive element. When the SDEG value is greater than 0, the element begins to be damaged. While the value of SDEG reaches 1, the element is at the damage limit and the damaged element is deleted. From the simulation’s results, we can see that the damage of the adhesive layer begins at its edge. This is because when the two plates began to pull in opposite directions, the edge of the plate begins to break first due to stress concentration.
Thus the adhesive layer gradually broke from its edge towards the center and the layer’s shape changed to an ellipse. Similarly, the stress distribution of the adhesive layer is also elliptical as shown in Figure 9.
Figure 10 shows the model’s stress distribution of the plate after fracture failure of the adhesive layer. It can be seen that the adhesive layer’s edge suffers serious stress concentration where it is bonded with the plate. This is because the adhesive layer gradually breaks, beginning at its edge. As it breaks, the number of elements in contact with the plate becomes progressively fewer. Thus, the contact area among the edges of the plate suffers stress concentration.
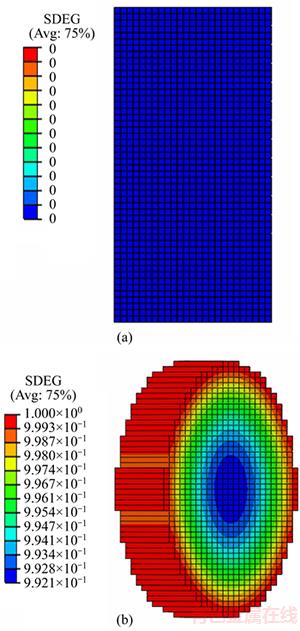
Figure 8 Fracture process of adhesive layer elements

Figure 9 Stress distribution of adhesive layer
The orthogonal simulation’s results are shown in Figure 11. The key quality of cohesive strength mainly affects the load required to separate the adhesive joint. As cohesive strength becomes higher, the interaction between the adhesive elements becomes stronger so that the adhesive layer has better toughness and needs more load to break. From Figure 11, we can see that cohesive strength is basically proportional to the fracture load.
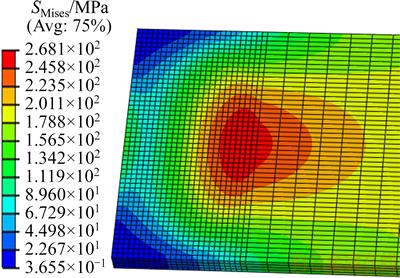
Figure 10 Stress distribution of plate
As shown in Figure 12, the key quality of fracture energy has little effect on fracture load. However, if the adhesive joint’s fracture energy becomes higher, the tearing length of the adhesive increases and it is better ability to suppress crack propagation. Thus, fracture energy is also an important influence parameter of the adhesive layer.
Figure 13 shows the results of 10 test groups. It can be seen from the figure that simulation results correlate well with the test results. In the fact that the material of the adhesive layer and the Al–Li alloy plate are not uniform and the mechanical test machine inevitably has some deviation, there is slight difference between the test results and the simulation result. Therefore, the curve is gentler than expected from the theoretical simulation results curve. It can be seen from Figure 14 that the test joint’s mean tearing displacement was 2.63 mm and its final fracture load was 9.42 kN. The results obtained by simulation using the key parameters determined in this paper are 2.6 mm and 9.08 kN, respectively. The simulation results are thus in good agreement with the experimental results. Therefore, the model and parameters determined in this paper can predict the strength and fracture load of Al–Li alloy adhesive joints.
5 Conclusions
According to the bonding strength test and DCB test, the key parameters of the adhesive layer are determined using basic knowledge of material mechanics and fracture mechanics. This paper introduces a finite element simulation of the fracture failure of a single-lap adhesive joint on an Al–Li alloy patch-reinforced structure, based on the cohesive zone model with the key parameters determined above. This paper also designed and simulated orthogonal simulation using commercial finite element software ABAQUS with the cohesive zone model.
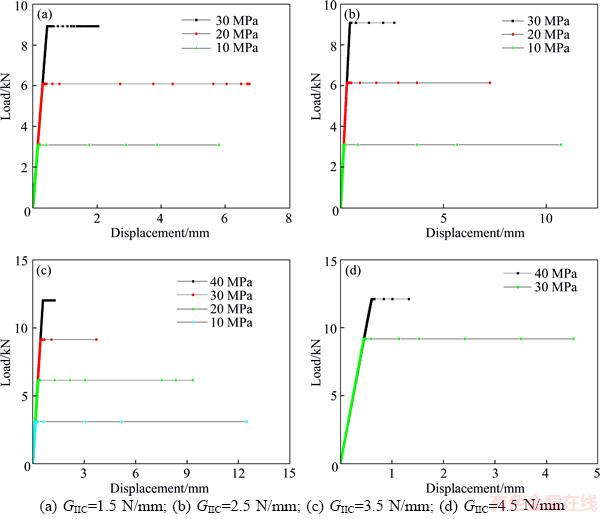
Figure 11 Results of orthogonal simulation:
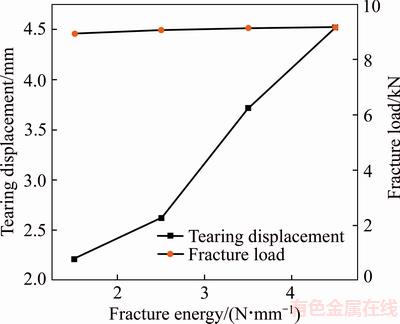
Figure 12 Results of different fracture energy

Figure 13 Load–displacement curve of tests
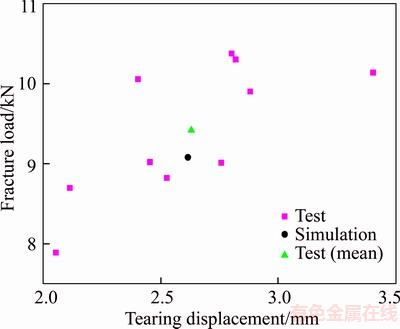
Figure 14 Comparison of results between tests and simulation
1) From the comparison of results, it can be seen that simulation results suit the test results well. Therefore, the method of determining adhesive effectiveness proposed above is likely quite accurate. This also means that the finite element model established by using the key parameters determined above can effectively predict the strength and fracture of single-lap adhesive joints on Al–Li alloy patch-reinforced structure.
2) It can be seen that, according to the orthogonal simulation analysis, one key parameter, cohesive strength, primarily affects the fracture load. The higher the adhesive strength, the greater load it needs to fracture. Meanwhile, fracture energy primarily affects the adhesive layer’s toughness. The higher the fracture energy of the adhesive, the lower the possibility of it being pulled off.
3) The cohesive zone model can accurately predict failure of single-lap adhesive joint of Al–Li alloy patch-reinforced structure. However, conditions initiating damage of the adhesive layer are not simulated with sufficient accuracy by the model. Therefore, the traction-separation law of the damage initiation process needs to be revised.
4) The finite simulation shows that the edge of the adhesive layer is first to be damaged. The center of the plate connected to the adhesive layer’s edge is likely to have stress concentration. Thus while bonding, the edge of the adhesive layer, which is mostly weak, needs to be strengthened to protect the plate from fracture failure.
References
[1] WANG Yu-da, LIANG Yong-sheng, WANG Hong-wei. Design of durability and damage tolerance of aircraft structures [J]. Aircraft Design, 2009, 29(1): 37–43. (in Chinese)
[2] LEE H K, PYO S H, KIM B R. On joint strengths, peel stresses and failure modes in adhesively bonded double-strap and supported single-lap GFRP joints [J]. Composite Structures, 2009, 87(1): 44–54.
[3] DUGDALE D S. Yielding of steel sheets containing slits [J]. Journal of the Mechanics & Physics of Solids, 1960, 8(2): 100–104.
[4] BARENBLATT G I. The mathematical theory of equilibrium cracks in brittle fracture [J]. Advances in Applied Mechanics, 1962, 7: 55–129.
[5] XU X P, NEEDLEMAN A. Numerical simulations of fast crack growth in brittle solids [J]. Journal of the Mechanics & Physics of Solids, 1994, 42: 1397–1434.
[6] NEEDLEMAN A. A continuum model for void nucleation by inclusion debonding [J]. Journal of Applied Mechanics, 1987, 54: 525–531.
[7] NEEDLEMAN A. An analysis of decohesion along an imperfect interface [J]. International Journal of Fracture, 1990, 42: 21–40.
[8] TVERGAARD V, HUTCHINSON J W. The relation between crack growth resistance and fracture process parameters in elastic-plastic solids [J]. Journal of the Mechanics & Physics of Solids, 1992, 40: 1377–1397.
[9] KATNAM K B, SARGENT J P. Characterization of moisture-dependent cohesive zone properties for adhesively bonded joints [J]. Engineering Fracture Mechanics, 2010, 77(16): 3105–3119.
[10] COELHO A M G, MOTTRAM J T, HARRIES K A. Finite element guidelines for simulation of fibre-tension dominated failures in composite materials validated by case studies [J]. Archives of Computational Methods in Engineering, 2016, 126(2): 299–313.
[11] BREWER J C, LAGACE P A. Quadratic stress criterion for initiation of delamination [J]. Journal of Composite Materials, 1988, 22(12): 1141–1155.
[12] MOHAMMADI S, OWEN D R J, PERIC D. A combined finite/discrete element algorithm for delamination analysis of composites [J]. Finite Elements in Analysis & Design, 1998, 28(4): 321–336.
[13] BENZEGGAGH M L, KENANE M. Measurement of mixed-mode delamination fracture toughness of unidirectional glass/epoxy composites with mixed-mode bending apparatus [J]. Composites Science & Technology, 1996, 56(4): 439–449.
[14] MOSLEMI M, AZAR M K. Delamination analysis of woven fabrication laminates using cohesive zone model [J]. Journal of Central South University, 2016, 23(1): 27–38.
[15] ALFANO M, FURGIUELE F. Cohesive zone modeling of mode I fracture in adhesive bonded joints [J]. Key Engineering Materials, 2007, 348–349: 13–16.
[16] YANG Zhen-hua, WANG Xian-you, SU Xu-ping. First- principles investigation of cohesive energy and electronic structure in vanadium phosphides [J]. Journal of Central South University, 2012, 19(7): 1796–1801.
[17] BLACKMAN B R K, KINLOCH A J, PARASCHI M. The determination of the mode II adhesive fracture resistance, G IIC, of structural adhesive joints: An effective crack length approach [J]. Engineering Fracture Mechanics, 2005, 72(6): 877–897.
[18] HASHEMI S, KINLOCH A J, WILLIAMS J G. The analysis of interlaminar fracture in uniaxial fibre-polymer composites [J]. Proceedings of the Royal Society A, 1990, 427(1872): 173–199.
[19] WILLIAMS J G. On the calculation of energy release rates for cracked laminates [J]. International Journal of Fracture, 1988, 36(2): 101–119.
[20] SUN Zhen-qi. Study on selective enhancement process and crack suppression mechanism of Al–Li alloy in aviation [D]. Central South University, 2013. (in Chinese)
[21] LIU Chang-fa. Analysis of adhesive process and joint strength of AL–Li alloy aviation plate [D]. Changsha: Central South University, 2012. (in Chinese)
(Edited by FANG Jing-hua)
中文导读
铝锂合金粘接接头CZM模型关键参数的确定
摘要:单搭接胶接接头胶层的关键参数对于铝锂合金补片增强结构抑制裂纹扩展的能力具有重要的意义和影响。针对铝锂合金补片增强结构胶接接头,本文根据材料力学与断裂力学的理论推导了确定单搭接胶接接头胶层的关键参数的方法,并采用0厚度的内聚力模型(CZM)对这种单搭接胶接接头的胶层损伤演化过程进行模拟,设计了正交仿真试验进行有限元仿真模拟与试验对比,建立了铝锂合金补片增强结构单搭接胶接接头三维渐进损伤模型。模拟结果与试验结果吻合较好,表明这种胶层参数确定方法的正确性,验证了本文确定的内聚强度和断裂能这两个关键参数的正确性,并且证明了此内聚力模型可以很好地预测铝锂合金补片增强结构胶接接头的强度以及断裂失效过程,为铝锂合金补片增强结构抑制裂纹扩展的研究提供基础。
关键词:铝锂合金;CZM内聚力模型;单搭接胶接接头;断裂能
Foundation item: Project(51575535) supported by the National Natural Science Foundation of China; Project(2015CX002) supported by the Innovation-driven Plan in Central South University, China; Project(zzyjkt2013-09B) supported by the Fund of the State Key Laboratory of High Performance Manufacturing, China; Project(2017zzts638) supported by the Fundamental Research Funds for the Central Universities, China; Project(2016RS2015) supported by the Scientific and Technological Leading Talent Projects of Hunan Province, China
Received date: 2017-04-11; Accepted date: 2017-09-26
Corresponding author: LI Yi-bo, PhD, Associate Professor; Tel: +86–731–88876164; Fax: +86–731–88876164; E-mail: yibo.li@ csu.edu.cn; ORCID: 0000-0002-2408-9148

