J. Cent. South Univ. Technol. (2011) 18: 550-557
DOI: 10.1007/s11771-011-0730-6
Membrane action in lateral restraint reinforced concrete slabs
WANG Gang(王刚)1, 2, WANG Qing-xiang(王清湘)1, 2, LI Zhong-jun(李中军)3
1. Dalian Construction Quality Supervision Station, Dalian 116012, China;
2. State Key Laboratory of Coastal and Offshore Engineering, Dalian University of Technology, Dalian 116024, China; 3. Design Institute of Civil Engineering and Architecture, Dalian University of Technology, Dalian 116025, China
? Central South University Press and Springer-Verlag Berlin Heidelberg 2011
Abstract: Based on the assumption of additional three-hinge arching action, an analytical method was proposed to predict the additional load of lateral restraint reinforced concrete (RC) slab under compressive membrane action (CMA), and its ultimate load could be obtained by adding pure bending load. The experiment of twelve one-way RC slabs supported by shear-walls was carried out, and the calculations of this proposed method provide good predictions for the experimental evidences. The influence of some design parameters on bearing capacity was also investigated. It is shown that the effect of vertical load on ending shear-wall on the ultimate load capacity can be generally neglected when the bending restraint is satisfied. The additional load capacity also decreases with the increase of the span-to-height ratio of central slab. When reducing the reinforcement area, the additional load capacity is increased, and this method can be used to save steel or enhance the ultimate load capacity of low steel ratio slab.
Key words: lateral restraint slab; compressive membrane action; ultimate load capacity; span-to-height ratio
1 Introduction
Johansen’s yielding line theory [1] was always considered as a classical upper-bound method to predict the ultimate load capacity of reinforced concrete (RC) slab. However, when the yielding line method was used to design the lateral restraint slabs, the actual load was much greater than its calculated value because of the compressive membrane action (CMA) [2].
Lots of works concerning testing research had been carried out, and many achievements were obtained. Based on the assumption that the value of middle deflection at ultimate load was 0.5 times thickness of slab, PARK and GAMBLE [3] proposed a calculating approach for ultimate load, which failed to provide good prediction for testing results of other researchers because the deflection at ultimate load was proven to depend on several parameters [4]. They also pointed out that the lateral restraint stiffness of horizontal support was very important to ultimate load. GUICE et al [5] designed a special experimental instrument with known lateral restraint stiffness and measurable ending rotation, and their specimens were partially restrained by the support with predetermined testing parameters. They pointed out that small rotational freedoms did not significantly affect the ultimate loads. Based on the rigid plastic model of reinforced concrete, EYRE and KEMP [6] reported a calculating theory of determining the additional load upon pure bending load. LAHLOUH and WALDRON [7] conducted a test concerning three one-way RC slabs supported by shear-walls with different thicknesses. They validated CMA in slab strips, and designed a layered non-linear finite-element model to predict the development of CMA originally, which acquired reasonable accuracy according to their testing results. Based on the theoretical conclusions concerning the membrane action in masonry walls, RANKIN and LONG [8] presented a new method, which accounted the ultimate load of lateral restraint slab to the sum of bending load and additional three-hinge arch load (additional load), and employed two intermediate variables to create the relationship between the load capacity of arch and middle deflection. In Ref.[9], the ultimate loads of the fiber reinforced plastics (FRP) reinforced concrete slabs were predicted by Rankin’s method, and the calculations provided good prediction to test results.
A calculating method for the prediction of ultimate load capacity was proposed in this work, based on the failure mode of RC slab in ultimate state of CMA and the assumptions concerning additional three-hinge arch. And an experiment of twelve one-way slabs supported by shear-walls was conducted to investigate the accuracy of the method and the influence on the bearing capacity of some parameter.
The investigation on the membrane action of RC slab has been conducted for many years, and it is exciting that some achievements have been widely accepted in lots of engineering codes [10-11]. This work aimed to give a quick and easy means of predicting the ultimate load for the engineers and conduct a series of experiments on the lateral restraint slab. It is hoped that it will be assistant to the further and more investigations of membrane action.
2 Proposed method
2.1 General description
As shown in Fig.1, in lateral restraint slab, the tensile strain of middle plane of slab is restricted by horizontal supports, the movement to concrete compressive edge of neutral axis is also restrained, and the height of concrete compressive zone is much larger than that without lateral restraint [12]. Then, there is an additional three-hinge arch between the two ending supports after cracking, which makes the ultimate load increase obviously. The analysis of this method can be developed by two stages as follows. The pure bending load is computed by the yielding line method. The ultimate load is obtained by superposing the bending load and the calculation of additional load.
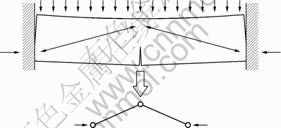
Fig.1 Compressive membrane action in reinforced concrete slab
The following basic assumptions are made:
1) Plane sections remain plane (Bernoulli);
2) The tensile strength of the concrete is neglected;
3) The bearing capacity of lateral restraint slab can be considered as the sum of bending load and additional load, and the height of concrete compressive zone is x=xb+xa, where xb is the height of concrete compressive zone corresponding to the bending action, and xa corresponds to the additional three-hinge arch;
4) The major cracks at the central and ending sections divide central slab into two parts at ultimate state, and every part keeps flat.
2.2 Bending load capacity
According to the yielding line theory, the failure pattern of fixing slab strips is shown in Fig.2. There are two negative yielding lines and one positive yielding line, generated along the major cracks at the principal moment sections. The yielding line method assumes that all reinforcement crossing yielding lines have yielded at the ultimate state, and the unit resistant moment (ms or mm) of yielding line can be calculated. The value of middle deflection is assumed as Δ [13], and the rotation along these cracks (yielding lines), θ=Δ/(l/2), is identified.
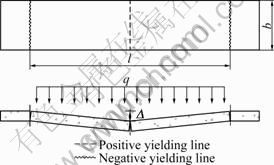
Fig.2 Yielding line model of slab strip
The slab strip between two yielding lines is considered to be flat, and the external work of vertical load, q, is equal to the internal work of resistant moments at yielding lines. The equation is given by
 (1)
(1)
By solving this equation, the ultimate bending load capacity, Pj, could be obtained:
 (2)
(2)
2.3 Additional load capacity
The deformation of half slab strip [14] at the ultimate state is shown in Fig.3. In order to describe the deformation relation of geometrical parameters clearly, the deflection has been amplified.
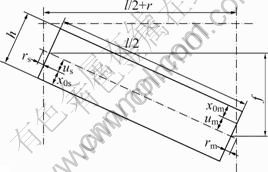
Fig.3 Geometrical relationship of parameters at ultimate state
The geometrical similarity of rm (the extension of mid-plane at center) and um (the distance between neutral axis and mid-plane) is rm/um=f/(l/2+r). By neglecting the micro-term, the relationship between rm and x0m (the distance from the neutral axis to the fiber of the maximum compressive strain) is given by
 (3)
(3)
In Fig.3, because the neural axis moves to the edge of concrete compressive zone with the development of cracks under the vertical load, the mid-plane of central slab strip should be extended with the extension of rs+rm. The lateral deformation is restricted by the horizontal support, and there is an outward lateral displacement of horizontal support, r=N/S, by the lateral restraint force N, where S is the combined in-plane stiffness of slab and the horizontal support. Therefore, the geometrical relationship of these parameters could be obtained:
 (4)
(4)
Neglecting the terms of high order, there is
 (5)
(5)
Using Eqs.(3) and (5), the lateral restraint force could be written as
 (6)
(6)
The calculation model of single-reinforcement section is shown in Fig.4.
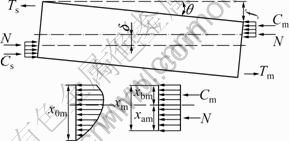
Fig.4 Simplified calculation model of CMA
According to equilibrium relation, the lateral restraint force, N, can be indicated as
 (7)
(7)
where xm=x0m?β (xm is the depth of equivalent rectangular concrete stress block). According to Eq.(7),
xs=xm-


and x0s in Eqs.(6) is replaced by x0m, then N can also be expressed as
 (8)
(8)
From Eqs.(7) and (8), if top steel is equal to bottom (As=
 the simplified relationship between x0m and f can be given as
 (9)
(9)
Since the actual rotation is small, cosθ=1.0; therefore, the height of additional three-hinge arch can be written as
 (10)
(10)
Using Eqs.(9) to replace x0m in Eqs.(7) and (10), the additional resistant moment is given as

 (11)
(11)
In Eq.(11), middle deflection f is the only independent variable. Solving differential equation, dMa/df=0, the middle deflection corresponding to the ultimate load can be given, then the peak moment Ma-max is obtained. So, the additional ultimate load capacity is Pa=k?Ma-max, where k is a computing constant.
Therefore, the ultimate load capacity of compressive membrane action is given as Pc=Pj+Pa.
2.4 Calculating procedure
According to the above presentation, the calculating procedure of this proposed method seems clear and straightforward; however, its calculation would be much complicated if the design parameters vary. The program method assisted by computers can be used to solve this question easily. Fig.5 shows the flow chart of a trial method.
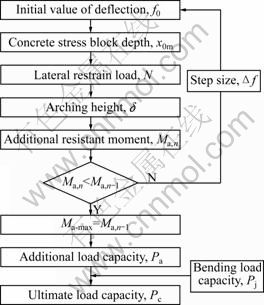
Fig.5 Flow chart of trial method
First, the initial deflection in mid-span is set as f0, and the corresponding additional resistant moment Ma,0 can be given. With a minor increment, ?f, of middle deflection, the additional moment Ma,1 corresponding to middle deflection (f0+Δf) is obtained. The loop won’t stop until Ma,n is less than Ma,n-1, and Ma,n-1 is the maximum of additional resistant moment, where n is a counter. However, it should be pointed out that the calculating result of trial method is approximate, and its computing precision can be modified by transforming the step size of middle deflection, ?f, so the calculating error will be reduced to be admissible for the application in actual engineering.
3 Testing details
3.1 Description of test specimens
An experiment of twelve RC slab strips supported by shear-walls was carried out to investigate their loading capacity. These specimens were designed to simulate the middle span of continuous slab in the shear-walls structure. At both ends of every specimen, a portion of adjacent span strip was reserved to offer lateral restraint. By accounting the restraint action of support in actual structure, the ratio of bending stiffness of shear-walls to flexural rigidity of central slab strip was adopted to be the equivalent value. For example, the geometrical parameters of original structure were as follows: wall-thickness of 200 mm, wall-height of 3 000 mm, slab-span of 3 600 mm and slab-thickness of 120 mm. The corresponding specimen had two 100 mm× 250 mm shear-walls and a 2 400 mm×120 mm slab strip. As shown in Fig.6, the bending stiffness ratio e= (EIwall?lslab)/(EIslab?lwall) of shear-wall and central slab strip was unchanged.
The details of reinforcement are also shown in Fig.6. In H9, 6.5 mm diameter steel was used for the minor reinforcement percentage, and its strength was a little higher than that of 8 mm diameter steel. There was no reinforcement at top of H11, which could be considered as a simple support slab with lateral restraint. The concrete of specimens was divided into two groups, and their concrete strength was a little different. The design parameters of specimens are listed in Table 1.
Because the geometrical size of these specimens was very different, the planks of the wooden mould were made to accommodate various types of central slab strips and ending shear-walls. The auxiliary specimens were cast in a standard mould made of steel.
3.2 Load and support system
As shown in Fig.7, four loading points on the specimens were used to simulate uniformly distributed load approximately. Central slab strip was divided into four areas equally, and a 200 mm×200 mm metal plate was placed at the center of every loading area. To provide equivalent load on both ending shear-walls, two synchronous hydraulic jacks were placed under the independent load frame.
A horizontal support composed of metal beams and metal poles was used to provide lateral restraint for specimens [15]. In order to eliminate the influence of friction between vertical support and specimen, four sliding plate hinges were set on top and bottom of ending shear-walls. A load sensor was placed between the horizontal support and specimen, connecting the metal beam through a spherical hinge. Two metal rods were previously embedded at the center of ending section, and they could transfer tensile force when the lateral load changed from compression to tension.
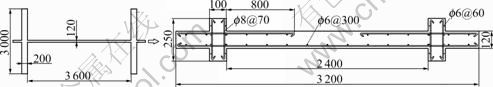
Fig.6 Simplified model of specimen (unit: mm)
Table 1 Details of specimens
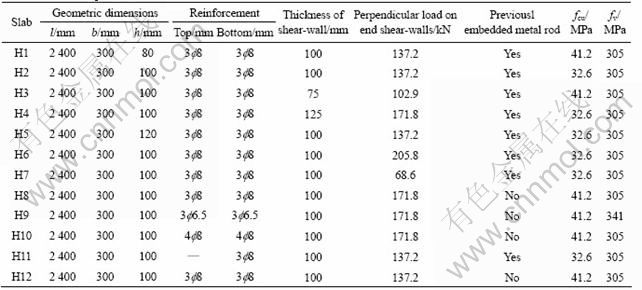
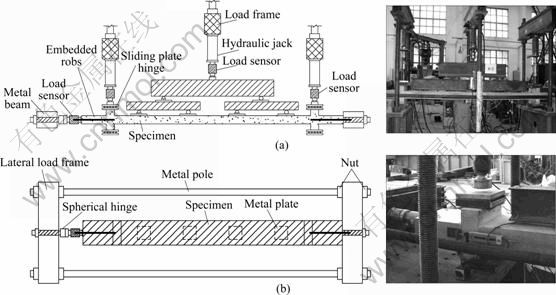
Fig.7 Load and support system: (a) Side view; (b) Top view
3.3 Testing apparatus and instrumentation
In this test, vertical displacement of slab strip was measured by two electric displacement transducers at the middle-span, as shown in Fig.8. There were also four electric displacement transducers placed horizontally at the ends of specimen, which were used to measure the axial extension. To monitor the rotation between the shear-wall and slab strip, four clip gauges were placed at both ends.
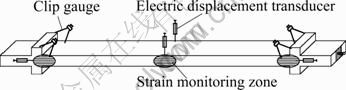
Fig.8 Measure point arrangement
The strain monitoring zones of concrete and steel were set at the center and both ends of slab strip. Five concrete strain gauges were pasted along the height of slab at every monitoring zone. The variation of micro strain was transferred to electric signals by measuring bridge, and a dynamic collecting system IMC (Integrated Measurement and Control) was used to collect these electric signals.
4 Testing results
The testing results are listed in Table 2. Restricted by the horizontal support with a lateral restraint stiffness of 16 700 N/mm, the ultimate loads of these specimens under CMA are averagely 38.3% higher than the calculations of yielding line method.
The comparison of test loads and calculations is presented in Fig.9. Because the lateral restraint has not been accounted, the error of the yielding line method is much greater than that of the proposed method and Rankin’s method. And it seems that the computing precision of the Rankin’s method is a little less than that of the proposed method.
4.1 Vertical load of ending shear-wall
Because less rotation of ending supports would be formed under the larger vertical load on the ending shear-walls, the bending restraint degree can be improved theoretically by increasing the vertical load. And according to the test results, though the vertical load on the shear-walls of H2 and H6 are twice even three times than that of H7, their enhancements of ultimate load are only 1.67% and 2.50%, respectively. Fig.10 shows the comparison of load-deflection curves of the three specimens. The shapes and inflexions of the three curves are very similar, and it is shown that the deformation behaviors of these specimens are not very different with the increase of ending load. However, the cracking pattern in the bottom of central slab is very diverse in the three specimens. As shown in Fig.11, there are 12 cracks in H7, 5 cracks in H2 and only 3 cracks in H6. It seems that the vertical load on the ending-wall affects the curvature of the central slab, and when the vertical load is larger, the bending of specimen is less.
It is concluded that if the vertical load satisfies the bending restraint, its influence on the ultimate load can be generally neglected, but the number of cracks at bottom rises with the increase of vertical load.
Table 2 Comparison of test results and calculations
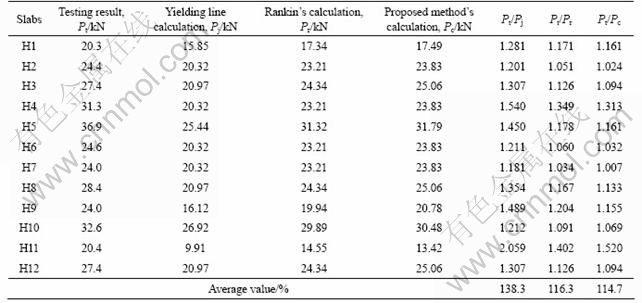
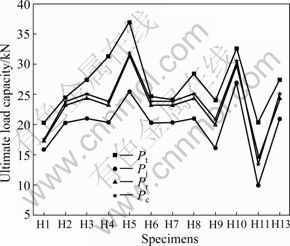
Fig.9 Comparison of ultimate load of testing results and calculations
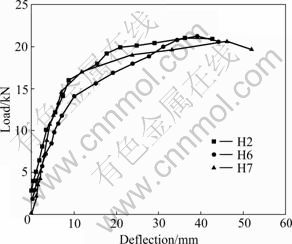
Fig.10 Load-deflection curves of specimens H2, H6 and H7
4.2 Span-to-height ratio
The general range of the span-to-height ratio of the slab in actual engineering is 15-40, and the values of H1, H12 and H5 are 30, 24 and 20, respectively. According to the test results, the bearing behavior of the specimen improves with the decrease of the span-to-height ratio of the slab, as shown in Fig.12. As known, the bending load of central slab with larger thickness can be enhanced because the effective height of section is increased.
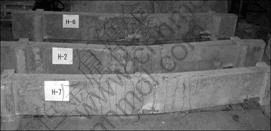
Fig.11 Cracking pattern in bottom of specimens
However, by further investigation, it is shown that the additional load capacity is also influenced. Fig.13 shows the curve calculated by the proposed method describing the relationship between the bearing capacity and span-to-height ratio, which indicates that the ratio of additional load to yielding line load decreases with the increase of span-to-height ratio. The test results of H1, H12 and H5 are also described in Fig.13, and it can be seen that the reduction of the additional load is larger than that of the bending load.
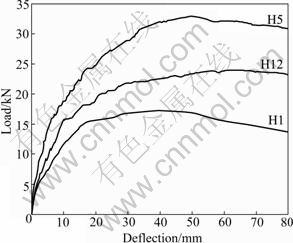
Fig.12 Load-deflection curve of specimens H1, H12 and H5
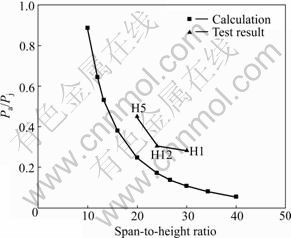
Fig.13 Relation between additional load capacity and span- to-height ratio
4.3 Steel percentage
GUICE and LAHLOUH have described a phenomenon that the ratio of Pt/Pj (ratio of the test load to the bending load calculated by yielding line method) decreases with enhancing the reinforcement percentage. Test results of this work are shown in Fig.14. It can be seen that the value of Pt/Pj of specimen H9 with the smallest steel percentage is greater than that of the other specimens.
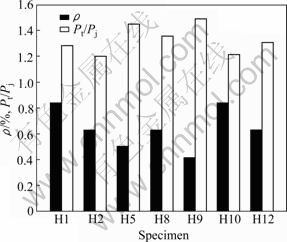
Fig.14 Influence on Pt/Pj of steel percentage
The value of Pt/Pj can be written as Pt/Pj=1+(Pt-Pj)/ Pj=1+Pa/Pj, which means that the ratio of additional load to bending load decreases with increasing the reinforcement percentage. The further investigation shows that additional load is also influenced by the reinforcement percentage. As shown in Table 3, the design parameters of the four specimens are basically equivalent except their steel percentage, their additional loads rise with the decrease of steel percentage, and the additional load of slab H10 with the most steel percentage is the least. The curve calculated by the proposed method describes the relation between the value of Pa/Pj and the steel percentage of central slab in Fig.15, and the test results of H8, H9, H10 and H12 show that the tendency of fitting curve is similar to that of calculations.
Table 3 Influence on additional load capacity of steel percentage
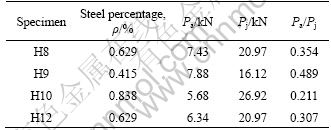
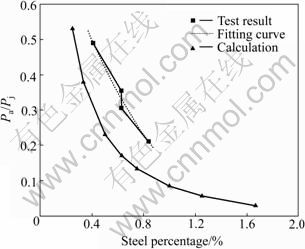
Fig.15 Relation between Pa/Pj and steel percentage
There are the equivalent relations, N=fcbx-fyAs and
N= in specimen under CMA.
If the reinforcement percentage increases or the height of concrete compressive zone increases, the lateral restraint force, N, will decrease, then the additional moment, Ma= N?δ, will also reduce. However, it is interesting that in low steel percentage slab under reliable lateral restraint condition, the proportion of additional load in ultimate load is greater than 50%, and if the reinforcement percentage is properly decreased, the additional load will increase, so its ultimate load capacity will not be weakened obviously, but even be enhanced to a certain extent.
5 Conclusions
1) The peak value of the additional load of lateral restraint slab can be predicted by the method proposed, and its ultimate load will be given by adding the bending load. The experiment of twelve one-way slabs supported by shear-walls is conducted, and this proposed method provides more consistent yet slightly conservative predictions to testing results compared with other methods.
2) According to the test results, the influence on the bearing capacity of vertical load of the slab on ending wall can be neglected if the bending restraint is satisfied. Both additional load and bending load are decreased by increasing the span-to-height ratio of the slab, and the reduction of the additional load is greater than that of the bending load. The additional load rises with the reduction of steel percentage, and this method can be used to save steel or enhance the ultimate load capacity of slab.
References
[1] SZILARD R. Theory and analysis of plates-classical and numerical methods [M]. Prentice-Hall, INC, 1974: 552-594.
[2] OUYANG Cheng-sheng. A plastic analysis of RC ring slabs under membrane action [J]. China Civil Engineering Journal, 1983, 16(8): 59-70. (in Chinese)
[3] PARK R, GAMBLE W L. Reinforced concrete slabs [M]. New York: John Wiley & Sons, 1980: 562-581.
[4] HUNG T Y, NAWY E G. Limit strength and serviceability factors in uniformly loaded isotropically reinforced two-way slabs [J]. Cracking, Deflection and Ultimate Load of Concrete Slab Systems, ACI, 1971, SP.30: 301-324.
[5] GUICE L K, SLAWSON T R, RHOMBERG E J. Membrane analysis of flat plate slabs [J]. Aci Structural Journal, 1989, 86(1): 83-92.
[6] EYRE J R, KEMP K O. A graphical solution for predicting the increase in strength of concrete slabs due to membrane action [J]. Magazine of Concrete Research, 1983, 35(3): 151-156.
[7] LAHLOUH E H, WALDRON P. Membrane action in one-way slab strips [J]. Proceedings of the Institution of Civil Engineers, Structures and Buildings. 1992, 94(4): 419-428.
[8] RANKIN G I B, LONG A E. Arching action strength enhancement in laterally-restrained slab strips [J]. Proceedings of the Institution of Civil Engineers, Structures and Buildings, 1997, 122(4): 461-467.
[9] TAYLOR S E, MULLIN B. Arching action in FRP reinforced concrete slabs [J]. Construction and Building Materials, 2006, 20(1/2): 71-81.
[10] COMIT? EUROP?EN DE NORMALISATION (CEN). Eurocode 2: Design of concrete structures-part 1: General rules and rules for buildings[S]. DD ENV 1992-01-01.
[11] Highways Agency. Use of compressive membrane action in bridge decks BD81/02 [S]. 2002.
[12] SHEN Ju-min, WANG Chuan-zhi, JIANG Jian-jing. Finite element method for reinforced structures and limit analysis of slabs and shells [M]. Beijing: Press of Tsinghua University, 1993: 396-410. (in Chinese)
[13] WANG Fang, YANG Zhi, HUANG Sai-chao. The limit analysis of irregular reinforced concrete slabs [J]. Journal of Central South University: Science and Technology, 2001, 32(6): 573-576. (in Chinese)
[14] MUTHU K U, AMARNATH K, IBRAHIM A. Load deflection behavior of partially restrained slab strips [J]. Engineering Structures, 2007, 29(5): 663-674.
[15] EYRE J R. Surround stiffness to membrane action in concrete slabs [J]. Magazine of Concrete Research, 2007, 59(2): 107-119.
(Edited by YANG Bing)
Foundation item: Project(PCSIRT0518) supported by the Program for Changjiang Scholars and Innovative Research Team in University of China
Received date: 2010-01-12; Accepted date: 2010-04-19
Corresponding author: WANG Qing-xiang, Professor, PhD; Tel: +86-411-84707885; E-mail: wangqx@dlut.edu.cn

