稀有金属 2007,(06),807-812 DOI:10.13373/j.cnki.cjrm.2007.06.010
Cu-In体系的热力学优化
黄松涛 储茂友 岳强 沈剑韵
北京有色金属研究总院矿物资源与冶金材料研究所,北京有色金属研究总院矿物资源与冶金材料研究所,北京有色金属研究总院矿物资源与冶金材料研究所,北京有色金属研究总院矿物资源与冶金材料研究所,北京有色金属研究总院矿物资源与冶金材料研究所 北京100088,北京100088,北京100088,北京100088,北京100088
摘 要:
评估了Cu-In体系的相平衡和热力学实验结果, 并对体系进行了热力学优化。采用替代模型描述体系的液相和富铜固溶体相, 双亚晶格模型描述线性化合物相, 三亚晶格模型描述非线性化合物相, 结合选取合理的实验数据, 优化得到Cu-In体系各相的热力学参数, 用优化结果计算的相图以及热力学性质与实验结果吻合。
关键词:
Cu-In ;相图计算 ;热力学优化 ;
中图分类号: TG111.3
作者简介: 储茂友 (E-mail:chumaoyou@163.com) ;
收稿日期: 2006-12-25
基金: 国家自然科学基金资助项目 (50672012);
Thermodynamic Optimization of Cu-In System
Abstract:
The data of phase diagram and thermodynamic properties of the Cu-In system in the literature were reviewed.The substitutional model was used for describing liquid and (Cu) terminal solid solution phases and two-sub lattice model for linear compounds and three-sub lattice model for non-stoichiometric compounds, respectively.Based on the available experimental data the thermodynamic parameters were optimized.The calculated phase diagram and thermodynamic properties were in reasonable agreement with experimental data.
Keyword:
Cu-In;phase diagram calculation;thermodynamic optimization;
Received: 2006-12-25
建立Cu-In体系的热力学模型, 对开发包含Cu, In元素的无铅焊料、 铜铟硒基太阳能电池材料有重要意义。 本文综合评估了Cu-In体系的相平衡和热力学实验结果, 选择适当的热力学模型, 进行热力学优化, 得到此二元系中各相的热力学参数。
1 实 验
Subramanian等
[1 ]
综合文献
[
2 ,
3 ,
4 ,
5 ,
6 ,
7 ,
8 ,
9 ]
的实验结果, 首次给出了全温度范围内的实验相图。 Weibke等
[2 ]
的实验研究表明, In在Cu中有较大的固溶度, Cu-In体系中有7个中间化合物, 包括3个低温相δ-Cu7 In3 , η-Cu2 In和φ (40.6%In) , 和4个高温相γ-Cu7 In3 , η′-Cu2 In, β-Cu4 In和ε (30%~32%In) 。 Rajasekharan等
[10 ]
对CuIn (44%In) 合金的研究表明, φ 相为线性化合物Cu11 In9 。 Jain等
[8 ]
采用XRD (X射线衍射) 和DTA (差热分析) 方法对该体系的研究表明, 随温度下降此体系在35%~38%In组成范围内依次存在h, A, A′, B, C 五相; 而Bolcavage等
[11 ]
综合利用XRD, DTA, DSC (扫描量热) , EPMA (电子微探分析) 测试方法, 表明此组成范围内只有η′, η两相存在, 并发现η′相和Jain等
[8 ]
的h, A, A′构成的相区相吻合, η相和B, C相区相吻合, 此结果与Kim等
[9 ]
的实验结果相同, 也为本文优化所采用。
Kang等
[12 ]
用EMF (电动势) 实验测定了不同温度下Cu-In体系液相的混合焓。 Bahari等
[13 ]
采用DSC和量热法, 测量了Cu0.7 In0.3 合金的摩尔焓随温度的变化。 Kang等
[12 ]
, Kameda等
[14 ]
均采用EMF方法对In在液相中的活度进行了测量, 两者的测量结果吻合较好。
Kao等
[15 ]
, Hertz等
[16 ]
, Liu等
[17 ]
分别对此体系进行了热力学优化。 但Kao等
[15 ]
忽略了γ和δ相在结构上的差别, 在优化时将这两个相视为同一个相处理。 Hertz等
[16 ]
, Liu等
[17 ]
将η, δ相视为线性化合物, 而文献
[
5 ,
8 ]
的相图实验结果表明, η, δ相均为有一定成分范围的非线性化合物。 最近Bahari等
[18 ]
综合采用了XRD, DSC和EPMA等几种方法对该体系进行了较全面的相平衡测量, 得到了一些新的相平衡实验结果。 综合考虑以上因素, 修正了各相的热力学模型, 对Cu-In二元体系重新进行热力学优化。
2 热力学模型
2.1 纯组元
对体系中的每一相φ , 其纯组元的摩尔自由焓°G
φ i
φ i
(T ) 与温度的关系采用下式描述:
°G
φ i
φ i
(T ) =G
φ i
φ i
-H
S E R i
S E R i
=a +bT +cT lnT +dT 2 +eT 3 +fT 4 +gT 7 +hT -9 +iT -1 (J・mol-1 ) (1)
其中, H i SER 是元素i在298.15 K标准参考态 (Standard Element Reference -SER) 下的摩尔焓, a , b , c ……为温度系数。 Cu和In各相纯组元的参数见表1, 取自SGTE热力学数据库
[19 ]
。
表1 纯元素热力学参数*
Table 1 Unary data for pure components
Phase
Temperature
a b c d e f g h i
298.15~1358
5194.277
120.973331
-24.112392
-2.65684×10⁻³
-1.29223×10⁻⁷
0
-5.849×10⁻²¹
0
52478
1358~3200
-46.545
173.881484
-31.38
0
0
0
0
0
0
298.15~494.4
-3696.798
84.701255
-21.8386
-5.72566×10⁻³
-2.12032×10⁻⁶
0
-5.59×10⁻²⁰
0
-22906
494.4~3800
3749.81
116.835784
-27.4562
0.54607×10⁻³
-0.08367×10⁻⁶
0
0
0
-211708
298.15~1358
-7770.458
130.485235
-24.1124
-2.65684×10⁻³
1.29223×10⁻⁷
0
0
0
52478
1358~3200
-13542.026
183.803828
-31.38
0
0
0
0
3.642×1029
0
298.15~429.75
-6978.89
92.338115
-21.8386
-5.72566×10⁻³
-2.120321×10⁻⁶
0
0
0
-22906
429.75~3800
-7033.516
124.476588
-27.4562
-0.54607×10⁻³
-0.08367×10⁻⁶
0
0
3.53×10²²
-211708
* a ~i : G
φ i
φ i
(T ) -H
S E R i
S E R i
=a +bT +cT lnT +dT 2 +eT 3 +fT 4 +gT 7 +hT -9 +iT -1
2.2 液相, 富铜固溶体相
液相 (Liquid) 、 富铜固溶体相 (α) 均采用替代模型描述, 摩尔自由焓表达式如下:
G φ = 2 ∑ i = 1 x i ° G φ i + R Τ 2 ∑ i = 1 x i ln ( x i ) + x 1 x 2 n ∑ v = 0 v L ( x 1 - x 2 ) v ( J ? m o l - 1 ) ? ? ? ( 2 )
其中x i 为组分i 的摩尔分数, °G
φ i 为φ相纯组元i的摩尔自由焓, v L 是两组元间的相互作用参数。
2.3 线性化合物 : Cu11 In9
Cu11 In9 相采用双亚晶格 (Cu) 0.55 (In) 0.45 模型描述, 摩尔自由焓的数学表达式为:
G Cu11 In9 =0.55 °G
f c c C u +0.45 °G tetr In +a +bT (J・mol-1 ) (3)
其中a , b 为待优化系数。
2.4 非线性化合物 : β, δ, γ, η, η′
β, δ, γ, η, η′相都是有一定成分范围的非线性化合物, 其成分和温度范围列于表2。 根据γ, η′相结构的特点
[17 ]
, 分别采用 (Cu) 0.654 (Cu, In, Va) 0.115 (In) 0.231 , (Cu) 0.545 (Cu, In, Va) 0.122 (In) 0.333 三亚晶格模型进行描述。 其余三相因缺乏结构方面的详细信息, 本文依据实验相图中各相成分的范围来构筑三亚晶格模型, β, δ, η三相的模型依次为 (Cu) 0.73 (Cu, In, Va) 0.14 (In) 0.13 , (Cu) 0.68 (Cu, In, Va) 0.04 (In) 0.28 , (Cu) 0.62 (Cu, In, Va) 0.03 (In) 0.35 。 摩尔自由焓的表达式为:
G =y ″ Cu °G Cu∶Cu∶In +y ″ In °G Cu∶In∶In +y ″ Va °G Cu∶Va∶In +x ″RT {y ″ Cu ln (y ″ Cu ) +y ″ In ln (y ″ In ) +y ″ Va ln (y ″ Va ) }+y ″ Cu y ″ In L Cu∶Cu, In∶In +y ″ Cu y ″ Va L Cu∶Cu, Va∶In +y ″ In y ″ Va L Cu∶In, Va∶In (J・mol-1 ) (4)
其中x ″表示第二个亚晶格所占晶格阵点的摩尔分数, y ″i 表示组分i在第二个亚晶格中的摩尔分数, L Cu∶i, j∶In 表示第二个亚晶格中i, j组元间的相互作用参数。
3 参数优化及结果
本文采用Thermo-Calc的Parrot优化模块
[20 ,21 ]
, 利用上述实验数据, 对各相的参数进行优化。 首先利用液相混合焓
[12 ]
、 液相线
[2 ,18 ]
、 In在液相中的活度
[12 ,14 ]
数据, 优化液相的热力学参数。 然后固定液相的热力学参数, 利用该体系的相平衡实验数据
[1 ,2 ,5 ,6 ,8 ,15 ,18 ,22 ]
和热力学性质数据
[13 ,23 ,24 ]
, 优化出各固相的热力学参数。 最后用所有数据对各相参数再进行一次优化, 使计算结果尽可能和实验数据相吻合。 优化后各相的热力学参数列于表3。
表2 非线性化合物的成分和温度范围
Table 2 Composition and temperature range of non-stoichiometric compounds
Phase
Composition range/ (% In)
Temperature range/K
Refs.
18.05~24.5
847~983
[3]
28.9~30.6
298~904
[1]
27.7~31.3
887~957
[1]
32.92~37.8
550~942
[1]
35.2~37.8
298~662
[8]
表3 Cu-In二元系中各相热力学参数的优化结果
Table 3 Optimized parameters for Cu-In system (J・mol -1 )
Phase
Model
Parameters in this work
(Cu, In)
L ( 0 ) C u , Ι n T -29.90241T lnT
L ( 1 ) C u , Ι n T -44.9521T lnT
L ( 2 ) C u , Ι n T -22.65452T lnT
(Cu, In)
L ( 0 ) C u , Ι n T
L ( 1 ) C u , Ι n T
L ( 2 ) C u , Ι n T
(Cu) 0.73 (Cu, In, Va) 0.14 (In) 0.13
°G Cu∶Cu∶In -0.87°G f c c C u G t e t r Ι n T
°G Cu∶I∶In -0.73°G f c c C u G tetr In =-2331.64-3.89391T
°G Cu∶Va∶In -0.73°G f c c C u G tetr In =5326.035-4.63147T
(Cu) 0.654 (Cu, In, Va) 0.115 (In) 0.231
°G Cu∶Cu∶In -0.769°G f c c C u G t e t r Ι n T
°G Cu∶In∶In -0.654°G f c c C u G t e t r Ι n T
°G Cu∶Va∶In -0.654°G f c c C u G t e t r Ι n
(Cu) 0.68 (Cu, In, Va) 0.04 (In) 0.28
°G Cu∶Cu∶In -0.72°G f c c C u G t e t r Ι n T
°G Cu∶In∶In -0.68°G f c c C u G tetr In =-7991.308+1.1853T
°G Cu∶Va∶In -0.68°G f c c C u G t e t r Ι n
L ( 0 ) C u ∶ C u ∶ Ι n ∶ Ι n T
(Cu) 0.545 (Cu, In, Va) 0.122 (In) 0.333
°G Cu∶Cu∶In -0.667°G f c c C u G t e t r Ι n T
°G Cu∶Cr∶In -0.545°G f c c C u G t e t r Ι n T
°G Cu∶Cu∶In -0.545°G f c c C u G t e t r Ι n
L ( 0 ) C u ∶ C u ∶ Ι n ∶ Ι n T
(Cu) 0.62 (Cu, In, Va) 0.03 (In) 0.35
°G Cu∶Cu∶In -0.65°G f c c C u G t e t r Ι n T
°G Cu∶In∶In -0.62°G f c c C u G tetr In =-7923.823+1.38T
°G Cu∶In∶In -0.62°G f c c C u G t e t r Ι n
11 In9 (Cu) 0.55 (In) 0.45
°G Cu11 In9 -0.55°G f c c C u G t e t r Ι n T
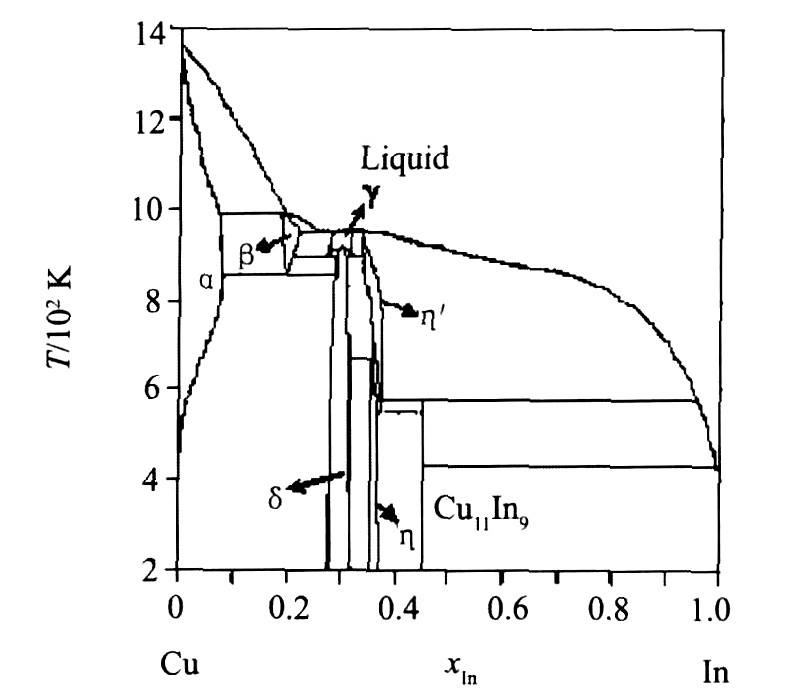
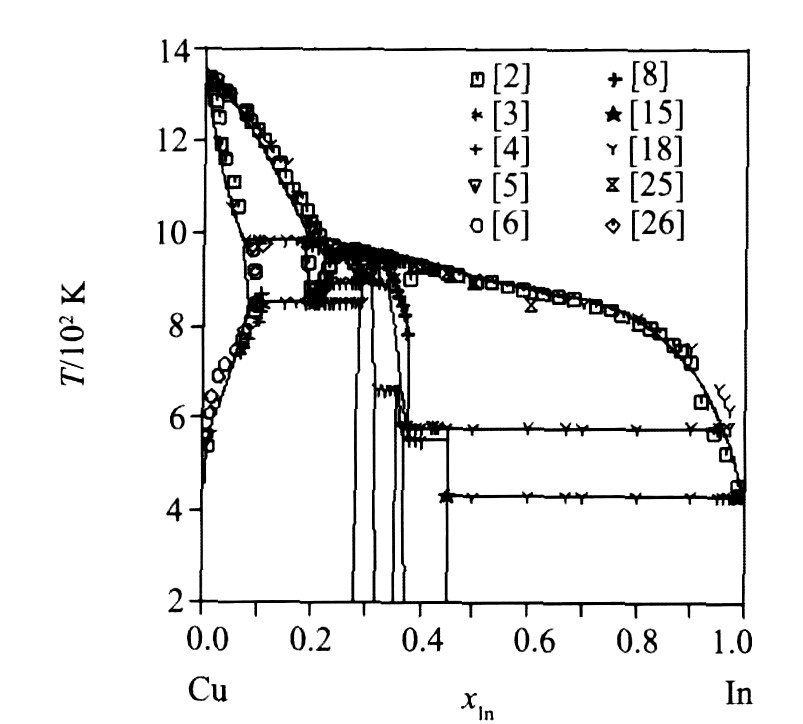
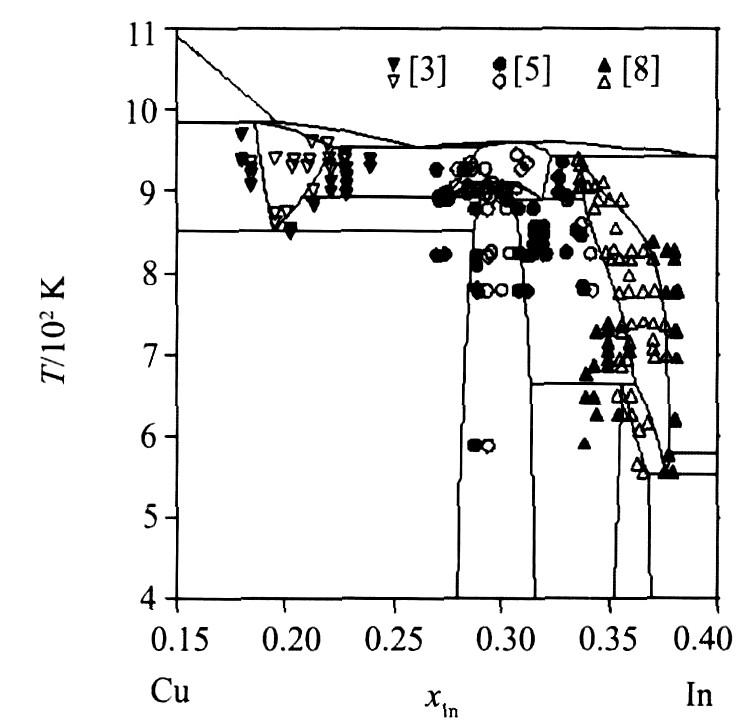
图1为由各相热力学参数优化结果计算的相图, 图2为计算相图与文献实验相平衡数据的比较, 图3为非线性化合物相区和实验结果的比较, 表4对比了无变反应计算值和文献实验值。 通过以上比较, 看出计算相图与已有的相平衡数据吻合很好, 非线性化合物的组分范围也与文献实验数据基本一致。
图1 Cu-In二元系的计算相图
Fig.1 Calculated phase diagram of Cu-In binary system
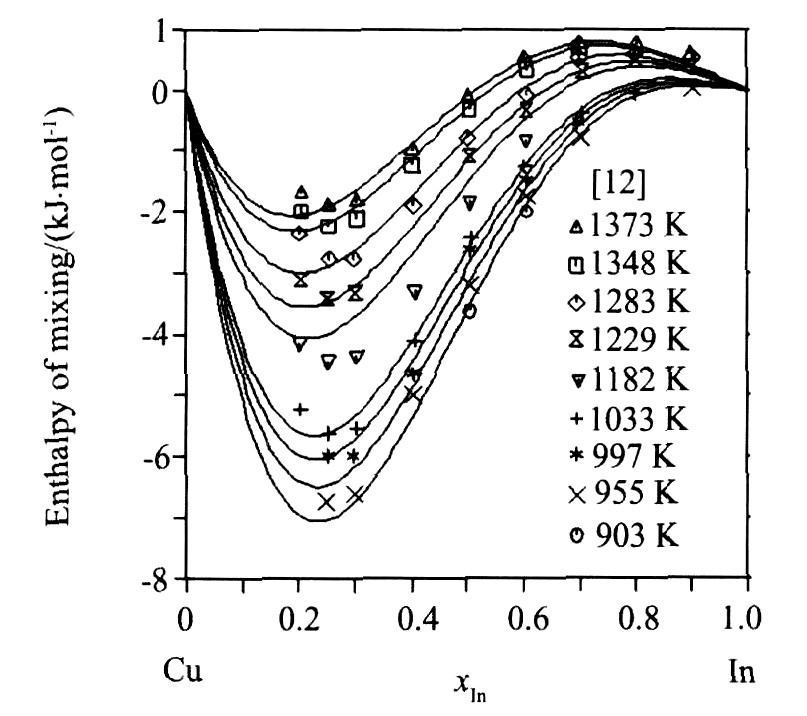
图4为利用优化结果计算的液相豁合焓与实验数据的比较, 图5为液相中In活度的计算值与实验值的符合情况, 图6为Cu0.7 In0.3 合金的摩尔焓计算值与实验值的比较。 从图4~6可以看出, 由优化结果计算的热力学性质与实验值均能很好地吻合。
图2 计算相图与实验相平衡数据的比较
Fig.2 Comparison of calculated phase diagram with experimental data
表4 计算相图中的无变反应与实验数据的比较
Table 4 Calculated invariant reactions compared with experimental data
Reaction
Composition (% In)
Temperature/K
Refs.
Liquid+α?β
20.8
9.5
18.3
988
[2]
25.8
23.8
27.2
952
[2]
29.1
29.1
-
958.2
[2]
35.2
31.2
32.7
944
[2]
27.9
22.1
28.2
889
[2]
29.5
29.5
-
904.2
[2]
30.8
30.5
32.7
888
[2]
20.0
11.63
28.7
847
[2]
35.0
32.0
34.5
661.8
[18]
11 In9 36.4
97.0
45.0
579.0
[18]
11 In9 -
-
-
549.8
[18]
11 In9 +In-
-
100
428.7
[18]
图3 局部相图中相区内的实验数据的吻合情况 (实心点为落在两相区内的点, 空心点为落在单相区内的点)
Fig.3 Comparison of calculated phase diagram from 15% to 40% In with selected data (solid symbols in two-phase regions, open symbols in single-phase regions)
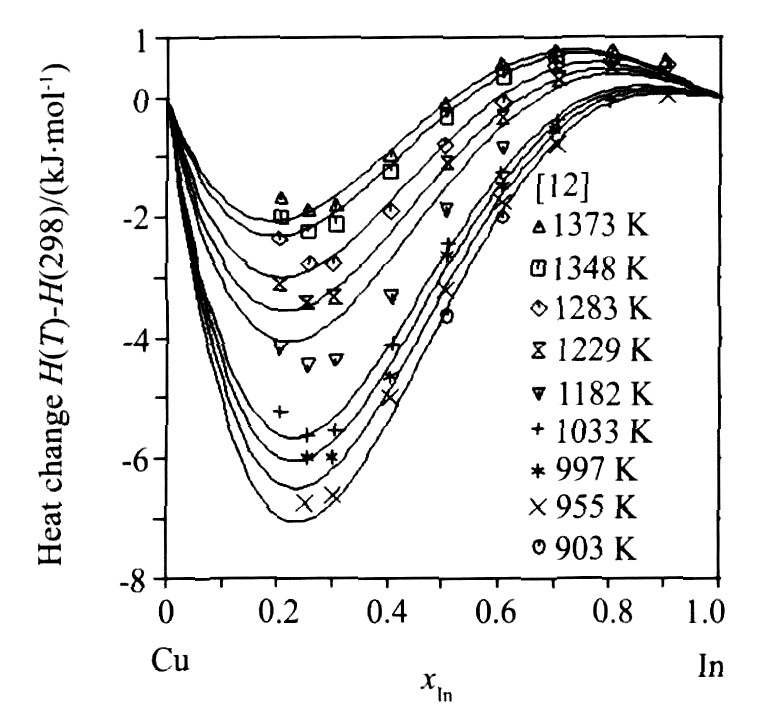
图4 Cu-In体系的液相混合焓的计算值与实验数据的比较
Fig.4 Comparison between calculated enthalpies of mixing of Cu-In liquid phase and experimental data
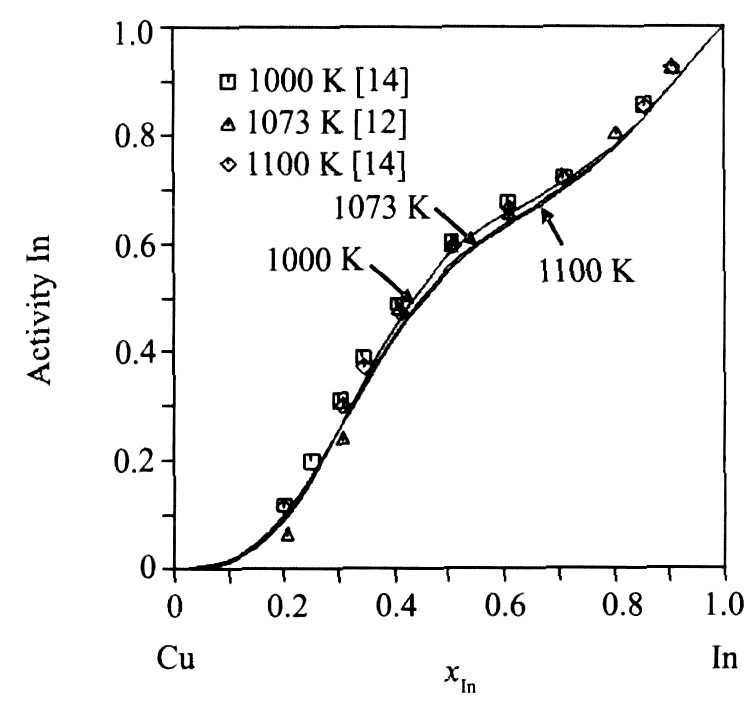
图5 Cu-In体系液相中In活度计算值与实验数据的比较 (参考态: 液相纯In)
Fig.5 Comparison between calculated activities of indium in Cu-In liquid phase and experimental data (reference state: liquid In)
图6 Cu0.7In0.3合金摩尔焓的计算结果与实验数据的比较
Fig.6 Comparison between calculated molar enthalpies of the Cu0.7 In0.3 alloy and experimental data
4 结 论
对Cu-In二元系进行了热力学优化, 选用了适合的热力学模型描述体系中的各相, 利用相关实验数据, 优化出各相的热力学模型参数。 用优化结果计算的相图以及热力学性质与实验数据吻合较好。
参考文献
[1] Subramanian P R, Laughlin D E.The Cu-In (copper-indium) sys-tem[J].Bull.Alloy Phase Diagrams, 1989, 10:554.
[2] Weibke F, Eggers H.The phase diagram of the system copper-in-dium[J].Z.Anorg.Allg.Chem., 1934, 220:273.
[3] Hume-Rothery W, Raynor G V, Packer K K.The constitution andstructure of alloys of intermediate composition in the systems copper-indium, copper-aluminum, copper-germanium[J].J.Inst.Met., 66, 1940:209.
[4] Owen E A, Morris D P.The application of X-ray methods to thedetermination of phase boundaries in metallurgical equilibrium dia-grams[J].J.Inst.Met., 76, 1949-1950:145.
[5] Reynolds J, Wiseman W A, Hume-Rothery W.The equilibriumdiagram of the system copper-indium in the region 25%~35%indi-um[J].J.Inst.Met., 1951-1952, 80:637.
[6] Jones R O, Owen E A.X-ray determination of the alpha-phaseboundary of the copper-indium alloy system[J].J.Inst.Met., 1953-1954, 82:445.
[7] Straumanis M E, Yu L S.Lattice parameters, densities, expansioncoefficients and perfection of structure of Cu2Inαphase[J].ActaCrystallogr.A, 1969, 25:676.
[8] Jain K C, Ellner M, Schubert K.On the phases occurring near thecomposition Cu64In36[J].Z.Metallkd., 1972, 63 (8) :456.
[9] Kim H S.Crystal structure studies of alloys InMn3, γCu-In, δCu-In andγ3Au-Zn[D].Ph.D dissertation, Physics, University ofWaterloo, Waterloo, Ontario, Canada, 1980.
[10] Rajasekharan T P, Schubert K.Crystal structure of Cu11In9[J].Z.Metallkd., 1981, 72:275.
[11] Bolcavage A, Chen S W, Kao C R, Chang Y A, Romig Jr A D.Phase equilibria of the Cu-In system.I.experimental inverstigation[J].J.Phase Equilibria, 1993, 14:14.
[12] Kang T, Kehaiain H V, Castanet R.Thermodynamic study of thecopper-indium binary system.2.potentiometric study[J].J.Less-Com.Met., 1977, 53:153.
[13] Bahari Z, Dichi E, Legendre B.Heat content and heat capacity ofCu0.7In0.3from 298 K to 1273 K[J].Z.Metallkd., 1999, 90:55.
[14] Kameda K.Activity measurements of liquid Cu-In alloys by EMFusing zirconia electrolyte[J].J.Jpn.Inst.Metals, 1990, 54:54.
[15] Kao C R, Bolcavage A, Chen S L, Chen S W, Chang Y A, RomigJr A D.Phase equilibria of the Cu-In system.I.experimental in-vestigation[J].J.Phase Equilibria, 1993, 14:22.
[16] Jean Hertz, Khadija EI Aissaoui, Lahcen Bouirden.A thermody-namic optimization of the Cu-In system[J].Journal of Phase Equi-libria, 2002, 23 (6) :473.
[17] Liu H S, Liu X J, Cui Y.Thermodynamic assessment of the Cu-Inbinary system[J].Journal of Phase Equilibria, 2002, 23 (5) :409.
[18] Zahra Bahari, Emma Dichi, Bernard Legendre.The equilibriumphase diagram of the copper-indium system:a new investigation[J].Thermochimica Acta, 2003, 401:131.
[19] Dinsdale A T.SGTE data for pure elements[J].Calphad, 1991, 15:317.
[20] Sundman B, Jansson B, Anderson J O.Thermocalc databank sys-tem[J].Calphad, 1985, 9:153.
[21] 储茂友, 郭江贵, 商顺利, 孙军, 沈剑韵.W-Zr体系的热力学优化[J].稀有金属, 2003, 27 (6) :701.
[22] Muschik T, Hehenkamp T.Solid-liquid-equilibria on the Cu-sideof the Cu-In system[J].Z.Metallkd., 1987, 78 (5) :358.
[23] Kang T, Kehaiain H V, Castanet R.Thermodynamic study of thecopper-indium binary system.I.calorimetric study[J].J.Calorim.Anal.Therm., 1976, 7 (3-7) :1.
[24] Vinokurova G A, Geiderikh V A.Thermodynamic properties of in-dium-copper alloys[J].Zh.Fiz.Khim., 1976, 50:1661.
[25] Bolcavage A, Chen S W, Kao C R, Chang Y A, Romig Jr A D.Phase equilibria of the Cu-In system.I.experimental investigation[J].J.Phase Equilibria, 1993, 14 (1) :14.
[26] Okamoto H.Cu-In (copper-indium) [J].J.Phase Equilibria, 1991, 12 (6) :702.
[27] Wallbrecht P C, Blachnik R, Mills K C.The heat capacity andenthalpy of some hume-rothery phases formed by copper, silver andgold.PartⅢ.Cu+Ga, Ag+Ga, Au+Ga, Cu+In, Ag+In andAu+In systems[J].Thermochim.Acta., 1981, 48:69.