J. Cent. South Univ. Technol. (2010) 17: 947-953
DOI: 10.1007/s11771-010-0582-5

Seismological method for prediction of areal rockbursts in deep mine with seismic source mechanism and unstable failure theory
TANG Li-zhong(������)1, 2, XIA K W2
1. School of Resources and Safety Engineering, Central South University, Changsha 410083, China;
2. Department of Civil Engineering, University of Toronto, Toronto M4Y 1R5, Canada
? Central South University Press and Springer-Verlag Berlin Heidelberg 2010
Abstract: The research on the rock burst prediction was made on the basis of seismology, rock mechanics and the data from Dongguashan Copper Mine (DCM), the deepest metal mine in China. The seismic responses to mining in DCM were investigated through the analyses of the spatio-temporal distribution of hypocenters, apparent stress and displacement of seismic events, and the process of the generation of hazardous seismicity in DCM was studied in the framework of the theory of asperity in the seismic source mechanism. A method of locating areas with hazardous seismicity and a conceptual model of hazardous seismic nucleation in DCM were proposed. A criterion of rockburst prediction was analyzed theoretically in the framework of unstable failure theories, and consequently, the rate of change in the ratio of the seismic stiffness of rock in a seismic nucleation area to that in surrounding area, dS/dt, is defined as an index of the rockburst prediction. The possibility of a rockburst will increase if dS/dt��0, and the possibility of rock burst will decrease if dS/dt��0. The correctness of these methods is demonstrated by analyses of rock failure cases in DCM.
Key words: areal rockburst prediction; seismic source mechanism; unstable failure; deep mine; seismic stiffness; seismic nucleation
1 Introduction
In general, the main objectives of the prediction of rockburst through routine seismic monitoring in mines are to indicate the locations of potential rockbursts associated with intermediate or large seismic events, and to detect spatio-temporal changes in seismic parameters and relate these changes to the stability of deformation within the volume of interest. This prediction would guide control measures and warnings to manage the exposure to potential rockbursts. Seismicity in many mines shows a sort of complex areal spatial distribution, which can be measured effectively by a seismic monitoring system [1]. Therefore, the seismological method of the prediction of the areal rockbursts is very important for rockburst control and warning in a mine.
In order to understand the mechanism of rockbursts in mines, the seismic response to mining was researched for many mines [2-3]. In these researches, the key problem that needs to be resolved is to establish the model of seismic nucleation. It is demonstrated that the heterogeneity of seismicity bears the information for the seismic nucleation and there are some correlations between the heterogeneity of seismicity and the properties of rock mass [4-6]. Because overall rock mass structure in a mine includes not only the geological structure of rock, but the mining engineering structure, the models of seismic nucleation need to be established based on the theories of seismic heterogeneity and overall rock mass structure in the mining condition. However, the majority of the researches on the seismic mechanism and models of seismicity in mines focused mainly on rock structure such as faults and local stopes or tunnels [7-9], and there were few researches on the mechanism of the areal seismic nucleation and the models of hazardous seismic prediction through combining the properties of mining engineering structure in the whole mining area and the seismicity. Therefore, in this work, the researches on the mechanism of the hazardous seismic nucleation and the model of the rockburst prediction were made by the comprehensive analyses of the total mining engineering structure and seismicity in the condition of mining on the large scale.
For the rockburst prediction, many attempts were made to quantify the mechanisms of rockbursts using seismic parameters and rock mechanics methods. Some seismological-based theories and methods for rockburst prediction were proposed. For example, the statistical analyses of the temporal data were used to calculate the probability of the occurrence of the seismic event of a magnitude [10-11], and the state and migration of theseismic apparent stress and displacement were used to assess the potential hazardous seismicity [12-13]. However, these methods do not really relate the parameters to the energy accumulation in one area and the energy transfer in different areas. In recent years, a mine stiffness theory has been studied preliminarily using data from some mines in South Africa [14-16]. It adopts the seismic stiffness to characterize the rock stiffness in real time in order to do rockburst prediction through the mine stiffness theory of rockburst, which is more accordant with the mechanism of rockburst in mine. But the determination of mine stiffness using seismic stiffness should be investigated for the specific mines, and especially in rockburst prediction, it is necessary to establish a criterion of rockburst prediction based on the seismic stiffness.
Dongguashan Copper Mine (DCM), near the Tongling City in Anhui Province, China, is a large deep-level hard rock copper mine where a rockburst monitoring system was built before production in the mine [17]. The seismic monitoring in the mine aims at the assessment of hazardous seismicity and rockburst prediction. Based on the theory of the asperity of the seismic source mechanism, the mine stiffness theory and the in-situ micro-seismic data from DCM, a model of hazardous seismic nucleation and a criterion of rockburst prediction were investigated in this work.
2 Geologic and mining conditions
Dongguashan Copper Deposit is at 1 000 m beneath the surface and it is controlled by an anticline (Fig.1). Its strike is NE35?-40? and the dip along the strike is about 10?. Its two wings dip northwest and southeast respectively, and the average dip angle is about 20?. The horizontal projection length of the orebody is 1 820 m and the horizontal projection width varies from 204 to 882 m. The average thickness of the orebody is about 40 m. The orebody is mainly composed of cupriferous skarn, with the direct roof of marble and the floor of siltstone and quartz diorite. There are few large faults and dense joints in the orebody. The maximum in-situ stress is 30-35 MPa, approximately parallel to the strike direction of the orebody; the minimum in-situ stress is 9-16 MPa, approximately vertical. The ore and its major surrounding rocks are very hard and prone to rockburst during mining operation [18-19].
The orebody is divided into panels along its strike, with the length of each panel being equal to the horizontal width of the orebody and width of the panel being 100 m (Fig.2). Panel barrier pillars (PBP) of 18 m in width are kept between the two neighboring panels. The stopes are arranged along the long axis of panels. Each stope is of 78 m or 82 m in length and 18 m in

Fig.1 Occurrence of Dongguashan copper deposit
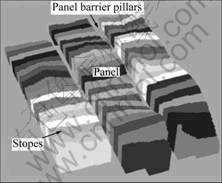
Fig.2 Layout of mining of the first mining area
width. The stope is mined and backfilled with the cemented tailings afterwards, which is followed by the excavation and backfill of the pillars.
3 Seismic monitoring system
The Dongguashan rockburst monitoring system has worked since Aug. 25, 2005. It is composed of a seismic monitoring system and a conventional stress and deformation monitoring system [20]. The seismic monitoring system is an ISS system manufactured by Integrated Seismic System International (South Africa). The system is tuned and optimized for the geologic and mining conditions of DCM [21]. It has 24 channels and 16 sensors. All signals are transmitted by copper twisted cables to the monitoring control centre underground, and then transmitted by an optical cable to the monitoring center on the ground surface as well as the safety and production management offices of the mine. Currently, the area of monitoring is the first mining area where there are four panels located between the 52# exploration line and the 60# exploration line and the surrounding rock mass. The monitoring area will be extended to the entire mine.
4 Location of hazardous seismic area
4.1 Spatio-temporal distribution of hypocenters
In spatial volume and time period, seismic events are plotted in 3D with coordinates of hypocenters of events (Fig.3). The change of spatial clusters can be analyzed by comparing the spatial distribution of the events in different time periods. For example, it can be seen from Fig.3 that there were nine areas of the clustered events in the first mining area from Dec. 2005 to Jan. 2006. Areas 1, 2, 3, 4 and 8 were induced by the driving of draw shafts, areas 5 and 6 by the development of drifts, and area 7 by the extraction of a stope. However, because area 9 is far from the mining area, the mechanism of the seismicity in area 9 is believed to be the slip of one pre-existing fault, activated by blasting. Analyzing the data from the first mining area from Sep.1, 2005 to Aug. 30, 2008 reveals that the events induced by the driving of draw shafts and the development of drifts are located near these mining sites, and they are sensitive to these mining activities. On the other hand, the extraction of a stope can induce the seismicity in larger areas. In general, the clustered events are located at the temporary pillars and panel barrier pillars.
4.2 Apparent stress and displacement of seismic events
Apparent stress, ��A, and average displacement at a source, u, in different time periods can be used to describe the variation of the stress state. The formulae are as follows [1]:
 (1)
(1)
 (2)
(2)
where �� is the shear rigidity modulus; r0 is the radius of the source; E is the emitted seismic energy; and M0 is the seismic moment. In terms of the occurrence of Dongguashan Deposit and the layout of the mining engineering structure, it can be seen that the apparent stress and displacement at different levels are appropriate to describe the spatial distribution of the stress and deformation in the first mining area. Therefore, a series of nephograms of the displacement, u, and contour maps of the apparent stress logarithm, lg ��A, at different levels in different time periods are plotted for DCM. Fig.4 shows the apparent stress contour and displacement nephogram of -730 and -760 m levels, respectively, during the same time period as shown in Fig.3. Areas of the stress concentration and deformation are clearly shown in Fig.4.
It is seen that some concentrations of the stress and deformation are not located at the areas of clustered events. For example, the development of a single drift usually does not obviously cause stress concentrations and large deformation although the clusters of events occur in these areas. There are also cases where the stress is not positively related to the deformation, which is manifested in the discordance between the area of the seismic apparent stress concentration and that of the deformation (Fig.4(a)). If the mining scale is small, the mining activities do not affect each other and the mining structures are independent, the areas of the stress concentration usually correlate well to the areas of the deformation. However, the correlation may not exist if the excavated spaces are large and affect each other. Because the seismic apparent stress and displacement are independently calculated in seismology [1], the relative rate of the change between the seismic apparent stress and the deformation in the same space reflects the mechanical property of rock mass.
4.3 Conceptual model of hazardous seismic nucleation
Because there are no obviously large-scale geological discontinuities such as dykes and faults in this mine, the dominant factors that control the heterogeneity of rock mass are the mining engineering structure and mining activities. The panel barrier pillars and many temporary pillars are formed between the hanging wall and foot wall with mining. These pillars restrain the relative deformation of the walls, which can be roughly considered as the compression-shear. In the framework of the theory of asperity in seismic source mechanism [4, 22], these pillars can be considered as the asperities where the seismic nucleation may occur. Therefore, a
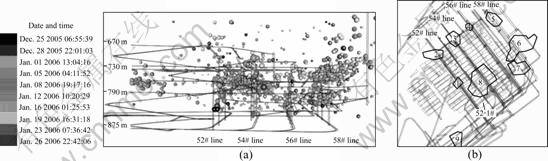
Fig.3 Distribution of events in the first mining area: (a) Scenograph of seismic events; (b) Delineation of horizontal projection of areas of clustered events
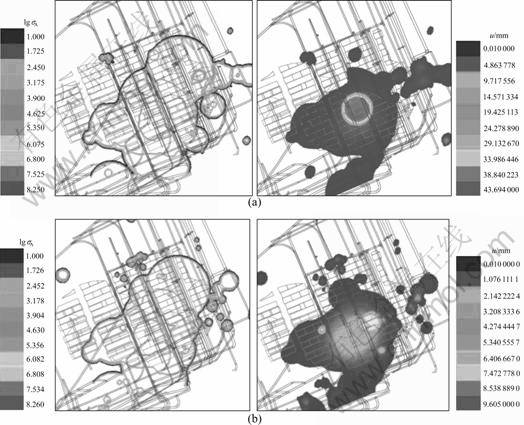
Fig.4 Apparent stress contour map and displacement nephogram at different levels: (a) -730 m; (b) -760 m
conceptual model of hazardous seismic nucleation in DCM is proposed, as shown in Fig.5, in which the areas enclosed by the elliptic dashed curve are considered approximately the potential areas of the hazardous seismic nucleation.
Fig.6 shows the apparent stress and displacement on the section along the strike of 52-6# stope (perpendicular to the strike of the orebody) from Jun. 1, 2006 to Jul. 30,
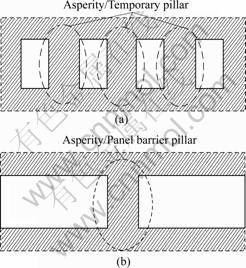
Fig.5 Conceptual model of seismic nucleation: (a) Section perpendicular to strike; (b) Section along strike
2006, in which the rectangles are the designed stopes, and the barrier pillars are between these stopes. It is seen that the concentrations of stress and deformation are located in the panel barrier pillars and their surrounding rocks, which is in accordance with the suggested conceptual model. These areas work as the asperities on the faults. This fact demonstrates that the conceptual asperity model can be used for analyzing the areas of
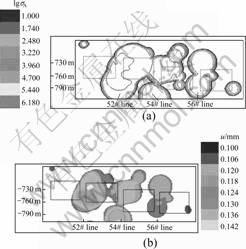
Fig.6 Distribution of seismicity on section of the first mining area along strike of 52-6# stope: (a) Apparent stress; (b) Displacement
potential hazardous seismic nucleation.
5 Mine seismic stiffness method of rockburst prediction
5.1 Unstable failure of deformation system of mine
The deformation of rock shows the characteristics of location in some stages of deformation. The deformation in a localization area will likely go into the strain softening stage where the deformation may be in an unstable state or in a stable state, which depends on the release of stress and the dissipation of energy in the strain softening area, and the migration of stress and the transfer of energy between the rock mass in the strain softening area and outside the area [23]. The deformation system will be unstable if the dissipated energy in the process of the inelastic strain in a softening area is smaller than the imported elastic energy from the wall rocks of the softening area. This is just a sort of rockburst mechanism in which the strain softening area can be considered as a rockburst nucleation area.
The mine stiffness theory of rockburst mechanism was proposed based on the rockburst mechanism [14]. According to the theory, the rock will be damaged in the form of unstable failure if the stiffness of the rock in a nucleation area is larger than that of the rock outside the nucleation area. The failure is abrupt and drastic, i.e., rockburst. Therefore, the prediction of areal rockbursts in a mine can be made by analyzing the stiffness of rock in the nucleation area and its wall rock. In the light of the above section, a hazardous seismic nucleation area can be considered as a potential rockburst nucleation area, and the research should focus on the measurement of the stiffness of rock with seismic monitoring in mines and on rockburst prediction with the stiffness.
5.2 Measurement of parameters of unstable failure
Using the definition of the seismic apparent stress, ��A, and its relation to the stress drop, ?��, of an event [24], the ratio of the release energy of the event, E, to the seismic moment, M, can be used to express the stiffness of the event. Because there are many events in a nucleation area, ?V, during a time period, ?t, a fitting method was used to determine the average stiffness of this area in a given time period. The scatter diagram of lg E and lg M of events can be drawn and a relation of E-M is given as follows [15]:
lg E=c+dlg M (3)
where c and d are the fitting constants, under the given ?V and ?t. The slope, d, shows the stiffness of the nucleation area. d increases with the increase of stiffness [15]. If M is constant, a steeper slope d indicates a larger energy release.
The wall rock mass outside the nucleation area should be considered as a mine loading system, whose stiffness is named as mine stiffness. In the seismic prediction, b in the G-R relation is studied extensively. The G-R relation is [25]:
lg N(��m)=a-bm (4)
where N(��m) is the number of events whose magnitude is larger than m; and a and b are constants.
It is demonstrated that b is affected by the stiffness of the loading system and decreases with the decrease of the mine stiffness [26-27]. Therefore, b can be used to characterize the seismic stiffness of the loading system.
5.3 Criterion of rockburst prediction
Theoretically, rockburst prediction can be made by comparing the relative change between d and b values. However, it is often difficult to identify the sizable changes in this way. Furthermore, the absolute values of the seismic stiffness cannot be actually obtained. To solve this problem, the change of the ratio of d in a nucleation area to b in the loading system was proposed to measure the change of the relative stiffness of bath areas, and further to determine the possibility of a rockburst. The ratio of d to b is defined as S below:
S=d/b (5)
The change of S reflects the relative change of the stiffness of the nucleation area to that of the load system area. Therefore, dS/dt is defined as a rockburst prediction index in a mine. Accordingly, the criterion is that the possibility of a rockburst will increase if dS/dt��0, and that of a rockburst will decrease if dS/dt��0.
5.4 Case study
The properties of parameters b and d were analyzed using the data recorded in DCM to predict rockbursts with seismic stiffness. A typical case is shown in this work. From Sept. to Oct. 2006, a few rock failures, some of which were rockbursts occurring in surrounding rocks of drifts under the panel barrier pillar along 54# exploratory line. Fig.7 shows the distribution of the stress and displacement on the vertical section along the midline of the panel barrier pillar. The area where a rock failure occurred is recognized as the seismic nucleation area. Some rocks outside the nucleation area are selected as the load system rock. For the nucleation area, the scatter diagram of lg E and lg M is plotted to determine d; for the load system rock, the frequency of events vs magnitude of events is plotted to determine b. The total time period for analysis is from Apr. 2006 to Apr. 2007. Every two month is used as the time interval for the analysis and parameters b and d are determined for every time interval and shown in Fig.8.
It is seen in Fig.9 that from Jun. to Oct. 2006,
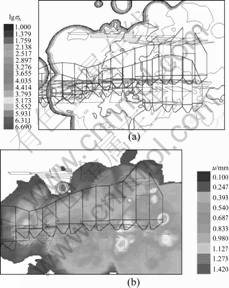
Fig.7 Distribution of seismicity in panel barrier pillar along 54# exploratory line: (a) Apparent stress contour map; (b) Displacement nephogram
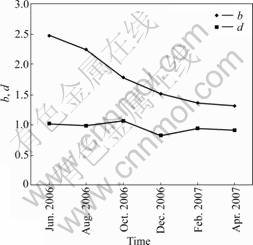
Fig.8 b in loading system area and d in nucleation area
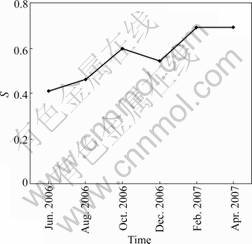
Fig.9 Ratio of stiffness of load system area to that of nucleation area
dS/dt��0, S increased continuously, showing that the probability of rockburst increased; After the rock failures, from Oct. to Dec. 2006, dS/dt��0, S decreased, showing that the energy was released and the probability of rockburst decreased. Though S started to increase after Dec. 2006, it kept constant after Feb. 2007. In fact, from Nov. 2006 to Feb. 2007, the wall rocks of the drifts were supported and reinforced, which kept the wall rocks stable. This demonstrates that in this case dS/dt reflects the probability of rockbursts and can be used as an index of the rockburst prediction.
6 Discussion
It is recognized that the distribution of the clusters of events, seismic stress and deformation in the course of mining are affected directly by the mining activities, which are shown in other mines. But it is more interesting that most clusters of seismic events, stress concentrations and strain localization are often temporary, that is, they are formed during mining, but lower or vanish after mining, and there are only a few areas where the seismic parameters increase continuously and ultimately cause drastic rock failures. With the extension of the scale of mining and the increase of stopes and pillars, the larger stress release areas and stress concentration areas will be formed in some pillars because of deformation and stress transfer. In this course, the stress in some former stress concentration areas may be released, and on the other hand, the stress in some other former stress concentration areas may further increase or some new concentration areas may be formed. Only those areas where the stress concentrations intensify continuously can be considered as the hazardous seismic nucleation areas.
However, because there are many mining activities and large scale mined-out spaces in DCM, which affect each other, the clusters, stress and deformation of seismicity are very complicated and show some distinct heterogeneity, which make it difficult to identify the hazardous seismic nucleation areas in the mine. According to the suggested conceptual model of seismic nucleation, the hazardous seismic areas should be in the panel barrier pillars or temporary pillars. But it is seen in the mine that the panel barrier pillars are often the areas where the stress continuously increases, and the temporary pillars are only occasional. This shows that the process of hazardous seismic nucleation in the mine has not yet been entirely understood in this work, and the model needs to be improved in the further research.
The seismic stiffness modulus in an area can be determined by an accumulation of seismic events in the area in Ref.[1]. But because the value determined by this method is affected dramatically by large seismic events, it cannot present the total stiffness of rocks in an area. The seismic stiffness determined by the suggested method in this work is the statistic mean value in the area for calculation, which eliminates the abnormal effect of the large events on the calculated value and then presents the total stiffness of the area. Because d and b values are statistics that are determined with enough detected data, the time period for the determination of b and d should be long enough. For example, in DCM, the time period should be about 60 d. Therefore, this method is not suitable for the short prediction of a rockburst, but suitable for the medium prediction of a rockburst.
7 Conclusions
(1) The distribution of the hypocenters, the stress and the deformation of seismic events is relative to the mining activities and the mining engineering structure. The most continuous stress concentrations often occur in panel barrier pillars and sometimes in temporary pillars; the relationship between the seismic apparent stress and the deformation is nonlinear in some areas.
(2) A conceptual model of the hazardous seismic nucleation in the framework of the theory of asperity in seismic source mechanism is proposed for DCM. In the model, hazardous seismic nucleation may occur in pillars, especially in the panel barrier pillars. It will be an effective method for locating the areas of hazardous seismicity and is worth of further research.
(3) A mine seismic stiffness method of the rockburst prediction is proposed on the basis of the mine stiffness theory. In the method, the change of the ratio of d value in the nucleation area to b value in the loading system, dS/dt, is defined as an index of the rockburst prediction. The possibility of a rockburst increases if dS/dt��0, and that of rockburst decreases if dS/dt��0.
References
[1] MENDECKI A J. Seismic monitoring in mines [M]. London: Chapman & Hall, 1997: 220-245.
[2] LASOCKI S, ORLECKA-SIKORA B. Seismic hazard assessment under complex source size distribution of mining-induced seismicity [J]. Tectonophysics, 2008, 456: 28-37.
[3] ABDUL-WAHED M K, AL-HEIB M, SENFAUTE G. Mining- induced seismicity: Seismic measurement using multiplet [J]. International Journal of Coal Geology, 2006, 66: 137-147.
[4] AKI K. Asperities, barriers, characteristic earthquakes and strong motion prediction [J]. Journal of Geophysical Research, 1984, 89: 5867-5872.
[5] TANG Chun-an, FU Yu-fang, ZHAO Wen. Numerical simulation of growth of seismic source simulation [J]. Journal of Earthquake, 1997, 19(4): 377-346. (in Chinese)
[6] LEI X, MASUDA K, NISHIZAWA O. Detailed analysis of acoustic emission activity during catastrophic fracture of faults in rock [J]. Journal of Structural Geology, 2004, 26: 247-258.
[7] DRIAD-LEBEAUA L, LAHAIEA F, AL HEIBA M. Seismic and geotechnical investigations following a rockburst in a complex French mining district [J]. International Journal of Coal Geology, 2005, 64: 66-78.
[8] SILENY J, MILEV A. Source mechanism of mining induced seismic events: Resolution of double couple and non double couple models [J]. Tectonophysics, 2008, 456: 3-15.
[9] ALBER M, FRITSCHEN R, BISCHOFF M. Rock mechanical investigations of seismic events in a deep long wall coal mine [J]. International Journal of Rock Mechanics and Mining Sciences, 2009, 46: 408-420.
[10] MANSUROV V A. Prediction of rockbursts by analysis of induced seismicity data [J]. International Journal of Rock Mechanics and Mining Sciences, 2001, 38: 893-901.
[11] LESNIAK A, ISAKOW Z. Space�Ctime clustering of seismic events and hazard assessment in the Zabrze-Bielszowice coal mine, Poland [J]. International Journal of Rock Mechanics and Mining Sciences, 2009, 46: 918-928.
[12] MERCER R A, BAWDEN W F. A statistical approach for the integrated analysis of mine-induced seismicity and numerical stress estimates, a case study. Part I: Developing the relations [J]. International Journal of Rock Mechanics and Mining Sciences, 2005, 42: 47-72.
[13] SENATORSKI P. Apparent stress scaling for tectonic and induced seismicity: Model and observations [J]. Physics of the Earth and Planetary Interiors, 2008, 167: 98-109.
[14] COOK N G W, HOEK E, PRETORIUS J P G. Rock mechanics applied to rockbursts [J]. Journal of South African Institute of Mining and Metallurgy, 1966, 66: 436-528.
[15] AMIDZIC D. Energy-moment relation and its application [C]// Proceedings of the Sixth International Symposium on Rockburst and Seismicity in Mines. Nedlands: Australian Centre for Geomechanics, 2005: 509-513.
[16] van ASWEGANG G. Routine seismic hazard assessment in some South African mines [C]// Proceedings of the Sixth International Symposium on Rockburst and Seismicity in Mines. Nedlands: Australian Centre for Geomechanics, 2005: 435-444.
[17] TANG Li-zhong, PAN Chang-liang, YANG Cheng-xiang. Establishment and application of microseismicity monitoring system in Dongguashan Copper Mine [J]. Metal Mine, 2006(10): 41-45. (in Chinese)
[18] TANG Li-zhong, PAN Chang-liang, XIE Xue-bing. Analysis and prediction of rockburst dangerous areas in Dongguashan Copper Mine under deep well mining [J]. Journal of Central South University of Technology, 2002, 33(4): 335-338. (in Chinese)
[19] TANG Li-zhong, PAN Chang-liang, XIE Xue-bing. Study on rockburst control in deep seated hard ore deposit [J]. Chinese Journal of Rock Mechanics and Engineering, 2003, 22(7): l067-1071. (in Chinese)
[20] TANG Li-zhong, PAN Chang-liang. Study on scheme of rockburst monitoring system of large deep-laying hard ore deposit [J]. Metal Mine, 2002(11): 10-13. (in Chinese)
[21] TANG Li-zhong, YANG Cheng-xiang, PAN Chang-liang. Optimization of stations of seismic monitoring at a large deep mine [J]. Chinese Journal of Rock Mechanics and Engineering, 2006, 25(10): 2036-2042. (in Chinese)
[22] KANAMORI H, STEWART G. S. Seismological aspects of the Guatemala earthquake of February 4, 1976 [J]. Journal of Geophysical Research, 1978, 83: 3427-3434.
[23] MUHLAUS H B, HOBBS B E, ORD A. Evolution of fractal geometries in deforming material [C]// Rock Mechanics. Rotterdom: A.A. Balkema, 1992: 681-690.
[24] URBANCIC T I, TRIFU C I. Shear zone stress release heterogeneity associated with two mining-induced events of M 1.7 and 2.2 [J]. Tectonophysics, 1998, 289: 75-89.
[25] GUTENBURG M C, RICHTER C F. Frequency of earthquakes in California [J]. Bulletin of Seismological Society of America, 1944, 34: 185-188.
[26] FUNK C, van ASWEGAN G, BROWN B. Visualisation of seismicity [C]// Proceedings of the 4th International Symposium on Rockbursts and Seismicity in Mines. Rotterdam: A. A. Balkema, 1997: 81-87.
[27] BRINK A V Z. Application of a microseismic system at Western Deep Levels [C]// Proceedings of the 2nd International Symposium on Rockburst and Seismicity in Mines. Rotterdam: A. A. Balkema, 1990: 355-361.
(Edited by CHEN Wei-ping)
Foundation item: Project(2010CB732004) supported by the National Basic Research Program of China; Project(50490274) supported by the National Natural Science Foundation of China
Received date: 2009-12-02; Accepted date: 2010-04-28
Corresponding author: TANG Li-zhong, PhD, Professor; Tel: +86-731-88906889; E-mail: lztang09@gmail.com

