J. Cent. South Univ. (2013) 20: 413�C423
DOI: 10.1007/s11771-013-1502-2

Dynamic simulation of drum level sloshing of heat recovery steam generator
CAO Xiao-ling (��С��)1, 2, PI Zheng-ren (Ƥ����)1, JIANG Shao-jian (���ܼ�)2,YANG Wei-hong (������)3, B. Wlodzimerz3
1. School of Energy and Power Engineering, Changsha University of Science and Technology, Changsha 410076, China;
2. School of Energy Science and Engineering, Central South University, Changsha 410083, China;
3. Division of Energy and Furnace Technology, Royal Institute of Technology (KTH),Stockholm 10044, Sweden
 Central South University Press and Springer-Verlag Berlin Heidelberg 2013
Abstract: Drum level sloshing is the latest discovery in the application of heat recovery steam generator (HRSG) in combined cycle, and shows certain negative influence on drum level controlling. In order to improve drum level controlling, influence factors on the drum level sloshing were investigated. Firstly, drum sub-modules were developed using the method of modularization modeling, and then the model of drum level sloshing was set up as well. Experiments were carried out on the experimental rig, and the model was validated using the obtained experimental results. Dynamic simulation was made based on the model to get a 3-D graph of drum level sloshing, which shows a vivid procedure of drum level sloshing. The effect of feed-water flow rate, main-steam flow rate and heating quantity on the drum level sloshing was analyzed. The simulation results indicate that the signals with frequency higher than 0.05 Hz are that of drum level sloshing, the signals with frequency of 0.0�C0.05 Hz are that of drum level trendy and ��false water level��, and variation of the feed-water flow rates, main-steam flow rates and heating quantities can change the frequency of drum level sloshing, i.e., the frequency of sloshing increases with the increase of feed-water flow rate, or the decrease of the main-steam flow rate and the heating quantity. This research work is fundamental to improve signal-to-noise ratio of drum level signal and precise controlling of drum level.
Key words: combined cycle; heat recovery steam generator; false level; drum level sloshing model; modularization modeling
1 Introduction
Heat recovery steam generator (HRSG) is the critical part of combined cycle, which may considerably affect main performances of the combined cycle. Now, mathematic modeling is an effective way to study HRSG��s performance and controlling, and much work has been done about HRSG modeling in combined system and other system. for example, the work of Aklilu and GILANI [1], CARAZAS et al [2], MANA SSALDI et al [3] and de et al [4]. At present, the key issue on HRSG mathematic modeling is optimizing the parameters and performance of HRSG in the combined cycle. BASSILY [5�C7] introduced feasible techniques to decrease the irreversibility of the HRSG of the dual-pressure reheat and triple-pressure reheat combined cycles and showed that the efficiency could be increased by 2%�C2.5% and 1.9%�C2.1%, respectively. MOHAGHEGHI and SHAYEGAN et al [8] adopted a new method for modeling a steam cycle in advanced combined cycles by organizing non-linear equations and their simultaneous solutions using hybrid Newton methods, where optimal thermodynamic performance conditions for HRSG are calculated with genetic algorithm. There are also other researches [9�C11] about modeling of drum level controlling of HRSG.
In the practical operation of HRSG in combined cycle, drum level is always sloshing and its forming principle is relatively complex, which does more harm to the controlling of drum level. But by now, no research group has done the research of drum level sloshing except CAO et al [12�C13]. In this work, the model of drum level sloshing was set up using the method of modularized modeling, and the experimental research was carried out to validate the model. Some simulation researches were also carried out, and useful results were obtained to further drum level signal processing and drum level precise controlling.
2 Module division and modularized modeling for drum level sloshing
2.1 Module division of drum
Drum structure is illustrated in Fig.1. A main-steam outlet and two downcomers are installed at the two extremities of the drum, and the risers are installed on the drum bottom symmetrically. One feed-water inlet is installed in the end of the drum, and all feed-water is sprinkled into the drum through many feed-water outlets evenly distributed in the drum.
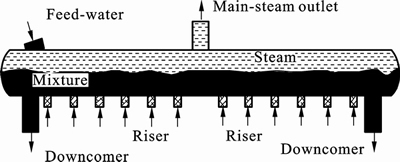
Fig. 1 Schematic of drum structure
The module division of drum model is shown in Fig. 2. The drum is divided into two parts [12�C16] as mixture and steam. The whole steam space is taken as one sub-module, and the mixture inside drum is evenly divided into some segments separately the horizontal direction. As a result, the model composes of one steam sub-module and some mixture sub-modules. Each mixture sub-module represents a segment of the drum, containing riser inlets, feed-water outlets and mixture of water and steam. Compared with the other segments, the centered one is special, containing a main-steam outlet. Steam exchanging happens in two-neighbored mixture sub-module, and between mixture sub-modules and the steam sub-module, as indicated in Fig. 2. Wg1 represents exchange flow rate of steam between the module 1 and steam sub-module. Wg2 means exchange flow rate of steam between the module 2 and steam sub-module, while, any two-neighbored mixture sub-modules exchange mixture of steam and water. WL1 means mixture exchange flow rate of steam and water between the sub-module 1 and sub-module 2. WL2 means exchange mixture flow rate of steam and water between the sub-module 2 and sub-module 3, and so on. Some parameters are assumed to be values of designing condition, based on other modeling parameters in practical operation.
2.2 Modeling assumption
Some hypothesises were made in the modeling of drum level shown as follows [12�C16]:
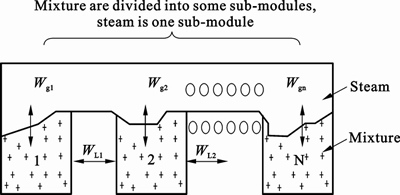
Fig. 2 Module dividing of drum
1) Mixture of steam and water from the risers is uniformly allocated in the drum by the cyclone separator.
2) According to the principle of boiler design, it is supposed that the feed-water is uniformly allocated inside the drum.
3) Only the frequency of drum level sloshing along drum length is considered in this modeling, because the frequency of drum level sloshing along the longitudinal belongs to higher frequency.
4) As the flow rate of steam is too fast, the influence of the steam��s flow rate over the drum level sloshing is ignored.
2.3 Steam sub-module ST
The main conservation equations used in sub-module ST are presented as follows[12�C16].
Mass conservation equation for the steam in the ST sub-module:
 (1)
(1)
Energy conservation equation for the steam in the ST module:

 (2)
(2)
Simplifying the mass conservation equation (1) and energy conservation equation (2), it can be got:
 (3)
(3)
 (4)
(4)
where ,
, ,
,  ,
, 
 ,
,  .
.
2.4 Mixture of steam and water sub-module DN
The main conservation equations used in sub-module DN are presented as follows [12�C16].
Mass conservation equation for mixture of steam and water:
 (5)
(5)
Energy conservation equation for mixture of steam and water:
 (6)
(6)
Momentum conservation equation for mixture of steam and water inside drum:

 (7)
(7)
where
 Simplifying the mass conservation
equation (5) and energy conservation equation (6), the following equations can be got:
 (8)
(8)
 (9)
(9)
where 


 .
.
Some parameters and frictions in Eqs. (5)�C(7) can be calculated by
 (10)
(10)
 (11)
(11)
 (12)
(12)
 (13)
(13)
 (14)
(14)
2.5 Mixture of steam and water sub-module MS
The main equations used in the sub-module MS are presented as follows [14].
Mass conservation equation for mixture of steam and water:
(15)
Energy conservation equation for mixture of steam and water:
(16)
where

(17)
(18)
(19)
(20)
2.6 Configuration of drum model based on Easy5
Based on the module division above and method of modularized modeling, the steam sub-module ST, mixture of steam and water sub-modules DN and MS can be set up. Some data used in simulation come from some power plants in General Electricity Company in USA, and based on the Easy5 software flat, the model of drum level sloshing is developed. Configuration of the model is shown in Fig. 3.
3 Experimental rig
3.1 Designing of experimental rig
Figure 4 shows the schematic diagram of experiment rig system. the experimental system includes computer, data acquisition cards, transducer, solenoid valve, water tank, waterpipe and so on. Figure 5 shows the configure of experimental rig, where the right part is water channel with three waves sensors installed at middle, left and right ends, respectively. The left part is signal data collection system. The water channel is designed to simulate the drum based on mechanism experimental requirement of drum level sloshing. The height, the length and the width of the water channel is 0.4 m��1.3 m and 0.2 m, respectively. Two holes, which are used to connect the down-comer and flow-meter, are settled at bottom with a diameter of 26 mm. Distributing pipe of feed-water is designed with a length of 1 m. Uniform holes are arranged along two sides of distributing pipe with a diameter of 2 mm. The water channel and the distributing pipe are made from acryl glass and plastic, respectively.
The experimental process is firstly to open the solenoid valve of water supply, until the water tank is full of water, and to close the solenoid valve of water supply. Next, open the two solenoid valves of drain, when the level of water tank reaches the level required, the two solenoid valves are closed. Meanwhile, the data acquisition and computer begin to work.
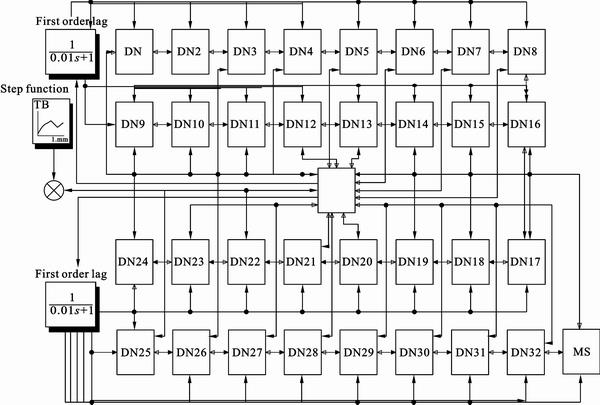
Fig. 3 Structure of model of drum level sloshing based on Easy5
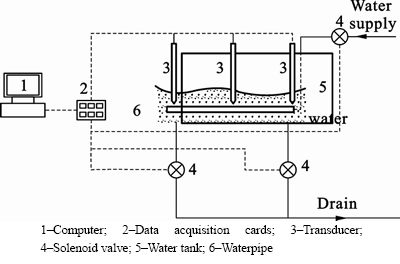
Fig. 4 Schematic diagram of experiment rig system:
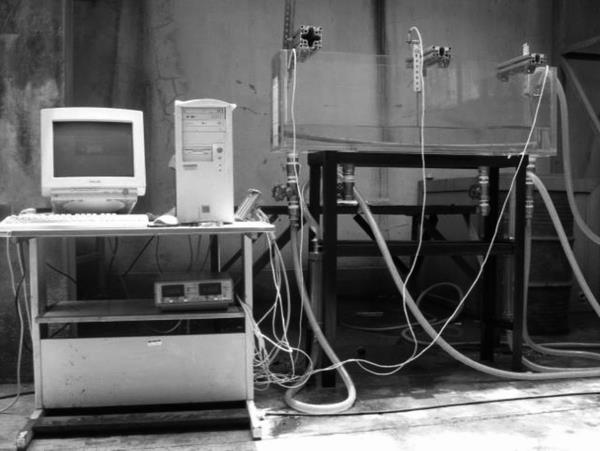
Fig. 5 Actual figure of experiment rig system
3.2 Key measuring apparatus�Cwaves measuring device
The three-way waves measuring device is used to measure the height of waves. The heights of three spots can be measured by the device at the same time. The device is produced by Wuxi Dongsheng Laser Technology Institution. Figure 6 shows the picture of one sensor of this device.
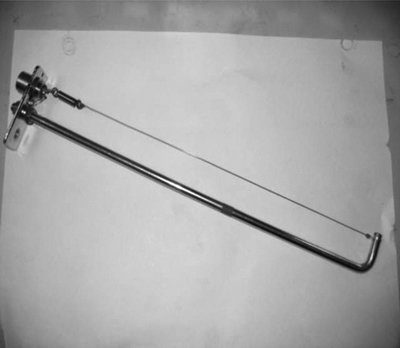
Fig. 6 Actual figure of sensor
3.3 Procedure of experiment
There are two typical experimental conditions:
1) Frequency and period of drum level sloshing were analyzed at levels of 0.08 m, 0.09 m, 0.11 m, 0.12 m, 0.135 m, respectively. As the sloshing is formed, the shape of level sloshing is shot by the high speed photographic instrument.
2) At the level of 0.16 m, the shape of drum level sloshing was analyzed. The detailed procedure is that when the sloshing was formed and the level was 0.16 m, the switches of the feed-water and down-comer were opened to the position of 3.6 L/s at the same time. The heights of middle, left and right ends of water channel were measured by the wave measuring device.
3.4 Experiment validation of level sloshing model
3.4.1 Experiment validation for frequency and period of level sloshing
Experiments were carried out with the level of water channel at 0.08 m, 0.09 m, 0.11 m, 0.12 m and 0.135 m, respectively. The whole procedure of level sloshing was shot by the high speed photographic instrument. 50 pictures were obtained in 1 s by the instrument, i.e., the sampling period is 0.02 s. The period of level sloshing can be calculated by the number of the pictures in one sloshing period. The periods of sloshing at different levels are listed in Table 1.
Based on the above-mentioned experimental conditions, the periods of level sloshing at different levels were calculated by the analytical solution formula [17] and the model in this research, respectively. The calculation results are also shown in Table 1.
Table 1 Period results of experiment, analytic solution and model
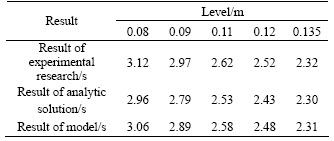
Figure 7 can be obtained by rearranging the three groups of data. The results of the model, experimental research and analytical solution formula show similar trend, and the numeric error is within ��7.2%, which suggests that the characteristic of level sloshing can be simulated by the model. Possible numeric errors are resulted from the disposing friction coefficient in the modelling, experimental device and means in the process of experiment research.
3.4.2 Experiment validation of shape of level sloshing
When the sloshing was formed, and the level is 0.16 m, the switches of the feed-water and down- comer were opened to the position of 3.6 L/s at the same time. Figure 8 shows the experimental data obtained from the three-way wave measuring device and the result of model under the same border condition. Numeric errors within ��3.5% can be seen between the modeling and experimental results in frequency domain, while greater numeric errors within ��14.7% can be found at the amplitude of level sloshing. the reason may be that friction coefficient of water in the model is difficult to match with the friction coefficient of water in experimental, and the other reason is that air flow is not considered in the model. During the phase of level sloshing, there is also a little numeric error. But, the frequency of level sloshing is the key influence factor in this work, and the errors of the amplitude and phase have little influence on the results of the research.
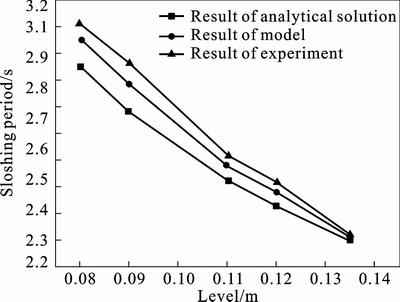
Fig. 7 Comparison among results of analytical solution, experiment and model
4 Dynamic simulation research of drum level sloshing
In this work, the main purpose is to analyze the effect of the three factors on the sloshing frequency, and the effect of the three factors on the sloshing amplitude is omitted specifically. The study process is presented as follows.
1) Firstly, as the main-steam flow rate, feed-water flow rate and quantity of heating change respectively, and the dynamic simulation was done on the model of drum level sloshing. Accordingly, the drum level data of every sub-model can be calculated by using the model. Spectrum analysis of one group of these data was carried out, so the characteristic frequencies of drum level data are obtained.
2) Then, as the feed-water flow rate, main-steam flow rate and heating quantity change respectively, the ��ideal level�� of the drum can be got by making weight average on the water level data of all sub-modules. Spectrum analysis of the ��ideal level�� was done to obtain the characteristic frequency of ��ideal level��.
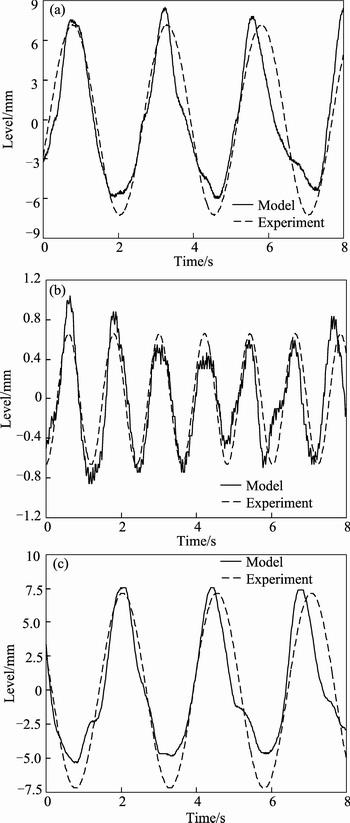
Fig. 8 Comparison between results of experiment and model
3) Afterwards, spectrum analysis of drum level data of one sub-module was implemented when the main-steam flow rate, feed-water flow rate and quantity of heating are constant. The characteristic frequency of each sub-module level was obtained by completing the one sub-module��s spectrum analysis with the same characteristic frequency.
4) Finally, analyzing the above three sorts of characteristic frequencies, the effect rule of main-steam flow rate, feed-water flow rate and heating quantity on drum level sloshing can be obtained.
4.1 3D graph of drum level sloshing
Figure 9 shows the drum levels of different sub-modules at different time. In this graph, only wave shape of drum level sloshing from 0 s to 50 s is given. In this way, the 3D wave shape graphic can be seen clearly, where Z axis denotes drum level (m), X axis denotes time (s), and Y axis denotes number of drum sub-module. Each sub-model of drum denotes the definite physical length of the drum.

Fig. 9 3D graphics of drum level sloshing
4.2 Simulation condition
Three simulation conditions are given in this dynamic simulation. The first simulation condition is that main-steam flow rate is changed suddenly as the drum works near the designing point, the second one is that feed-water flow rate is changed suddenly as the drum works near the designing point, the third one is that heating quantity is changed suddenly as the drum works near the designing point. Details are listed below:
1) The main-steam flow rate is changed suddenly, as shown in Fig. 10, namely, when the drum works near the designing point, the main-steam flow rate decreases by 10% suddenly, and lasts for 100 s.
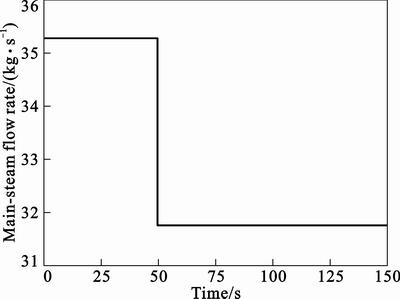
Fig. 10 main-steam flow rate decreasing by 10%
2) The feed-water flow rate is changed suddenly, as shown in Fig. 11, namely when the drum works near the designing point, the feed-water flow rate decreases by 10% suddenly, and lasts for 100 s.
3) The heating quantity is changed suddenly, as shown in Fig. 12, namely, when the drum works near the designing point, the heating quantity increases by 10% suddenly, and lasts for 100 s.
4.3 Effect of main-steam flow rate on sloshing
As the main-steam flow rate decreases by 10% suddenly and lasts for 100 s, the effect of main-steam flow rate on level sloshing was done by dynamic simulation. All data of ��ideal level�� and random selected one sub-module��s level were obtained (as shown in Fig. 13). Based on the procedure above, the following results can be obtained: 1) As the main-steam flow rate is not changed, the characteristic frequency of drum level sloshing is 0.073 2 Hz by spectrum analysis. 2) The characteristic frequencies of ��ideal level�� are 0.022 Hz and 0.007 16 Hz, respectively, as the main-steam flow rate is changed. 3) As the main-steam flow rate is changed, the characteristic frequencies of sub-module��s level are 0.081 Hz, 0.022 Hz and 0.007 16 Hz, respectively. 4) Comparing to the results of the above-mentioned characteristic frequencies, it can be found that as the main-steam flow rate is changed, the two characteristic frequencies of ��ideal level�� are equivalent to that of sub-module. The third characteristic frequency of sub-module is higher than that as the main-steam flow rate is not changed.
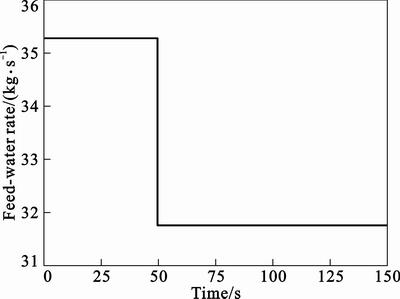
Fig. 11 Feed-water flow rate decreasing by 10%
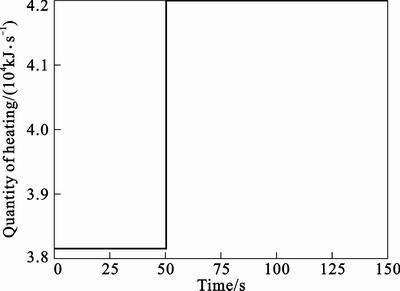
Fig. 12 Heating quantity increasing by 10%
Combining Fig. 13 with the results of spectrum analysis, it can be found that because of the phenomenon of ��false water level�� inside the drum, at first, the level decreases temporarily, then increases continually, which induces the higher value of the sloshing frequency. As the main-steam flow rate is changed reversibly, the value of the frequency becomes lower. From the dynamic simulation, it can be concluded that when the main-steam flow rate increases, the frequency of drum level sloshing decreases.
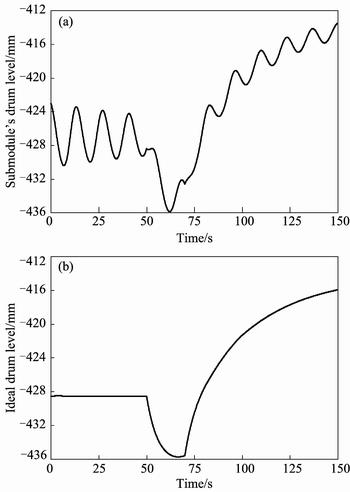
Fig. 13 Variety of one sub-model��s level (a) and drum ��ideal level�� (b) with change of main-steam flow rate
4.4 Effect of feed-water flow rate on sloshing
When the feed-water flow rate decreases by 10% suddenly and lasts for 100 s, the dynamic simulation was carried out to analyze the effect of the feed-water flow rate on level sloshing. The data of ��ideal level�� and random selected one sub-module��s level were obtained, as shown in Fig. 14. Based on the procedure above, the following simulation results can be obtained: 1) If the feed-water flow rate is not changed, the characteristic frequency of drum level sloshing is 0.073 2 Hz. 2) As the feed-water flow rate is changed, the characteristic frequencies of ��ideal level�� are 0.046 6 Hz and 0.006 68 Hz by spectrum analysis of data. 3) As the feed-water flow rate is changed, it can be found that the characteristic frequencies of sub-module��s level are 0.066 5 Hz, 0.046 6 Hz and 0.006 68 Hz. 4) Comparing the results of the above-mentioned characteristic frequencies, it can be found that as the feed-water flow rate is changed, the two characteristic frequencies of ��ideal level�� are equivalent to that of sub-module, the third characteristic frequency of sub-module is higher than that as the feed-water flow rate is not changed.
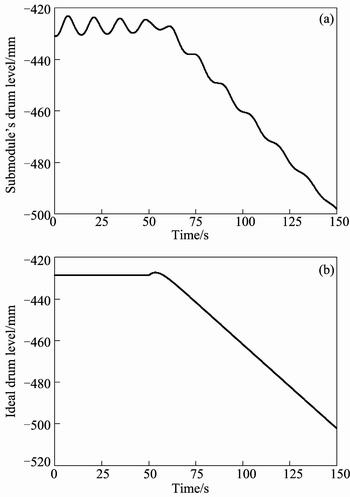
Fig. 14 Variety of one sub-model��s level (a) and drum ��ideal level�� (b) with charge of feedwater flow rate
Combining Fig. 14 with the results of spectrum analysis, it shows that because of the phenomenon of ��false water level�� inside drum, at first, the level increases temporarily, then decreases continually, which induces the lower value of the sloshing frequency. As the feed-water flow rate changes reversibly, the value of the frequency shifts towards higher. So, it can be concluded that when the feed-water flow rate increases, the frequency of drum level sloshing increases.
4.5 Effect of heating quantity on sloshing
As the heating quantity increases by 10% suddenly and lasts for 100 s, the dynamic simulation research was carried out to analyze the effect of the heating quantity on level sloshing. The data of ��ideal level�� and random selecting one sub-module��s level were obtained (as shown in Fig. 15). Based on the procedure above, the following simulation results can be obtained: 1) When the heating quantity is not changed, the characteristic frequency of drum level sloshing is 0.073 2 Hz by using spectrum analysis. 2) When the heating quantity is changed, the data were analyzed by method of spectral analysis, and it can be found that the characteristic frequencies of ��ideal level�� are 0.021 8 Hz and 0.007 1 Hz. 3) When the heating quantity is changed, it can be obtained that the characteristic frequencies of sub-module��s level are 0.07 Hz, 0.021 8 Hz and 0.007 1 Hz by spectrum analysis. 4) Comparing to the results of the above-mentioned characteristic frequencies, it can be found that when the main-steam flow rate is changed, the two characteristic frequencies of ��ideal level�� are equivalent to that of sub-module, and the third characteristic frequency of sub-module is higher than that as the main-steam flow rate is not changed.
Combining Fig. 15 with the results of spectrum analysis, it can be obtained that because of the phenomenon of ��false water level�� inside drum, at first,the level increases temporarily, then decreases continually, which can induce the value of the sloshing frequency to shift towards lower. And the heating quantity is changed reversibly, the value of the frequency shifts towards higher. So, the dynamic simulation indicates that when the heating quantity increases, the frequency of drum level sloshing decreases.
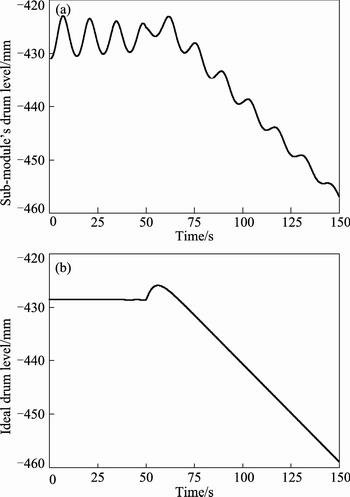
Fig. 15 Variety of one sub-model��s level (a) and drum ��ideal level�� (b) with change of heating quantity
5 Spectrum analysis of field data of combined cycle power plant
The phenomenon of drum level sloshing is found in operational field of combined cycle power plant in General Electricity Company in USA. In order to reveal the phenomenon, at least four drum level sensors are installed symmetrically on the drum, and from the analysis of the field data of drum level, the phenomenon of drum level sloshing can be discovered, especially when the HRSG runs smoothly.
Figures 16�C19 show the field data of drum level from A, B, C and D drum level sensors provided by General Electricity Company in USA, and also the corresponding spectrum analysis was carried up. Here, A and B sensors are installed at the same end of drum, and symmetrically C and D sensors are installed at opposite end. It is obvious from the spectrum analysis that different drum levels from opposite drum side are reverse. And main power of drum level signal is focused on the 0�C0.05 Hz, the other power of drum level signal is focused on around 0.05�C0.1 Hz. Combined the simulation result with the field data and the spectrum analysis, it can be found that the signal with frequency smaller than 0.05 Hz is the signal of drum level trendy and ��false water level��, and the signal with frequency higher than 0.05 Hz is the signal of drum level sloshing.
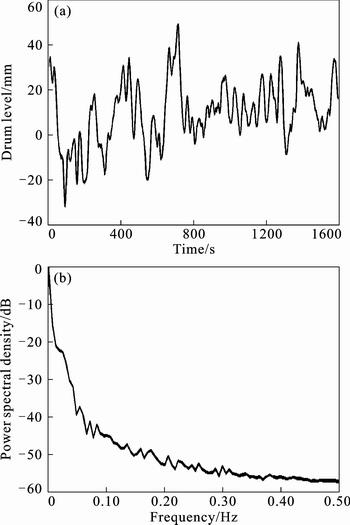
Fig. 16 Drum level data (a) and spectrum analysis (b) from sensor A
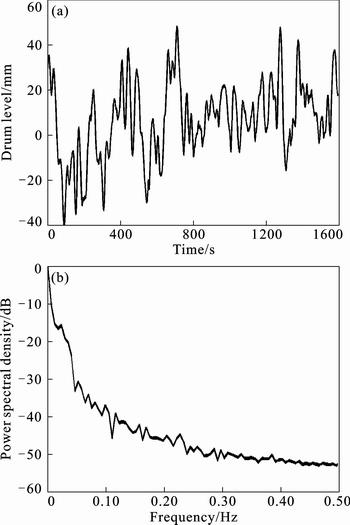
Fig. 17 Drum level data (a) and spectrum analysis (b) from sensor B
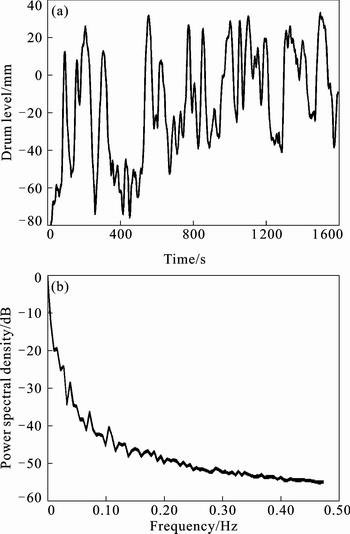
Fig. 18 Drum level data (a) and spectrum analysis (b) from sensor C
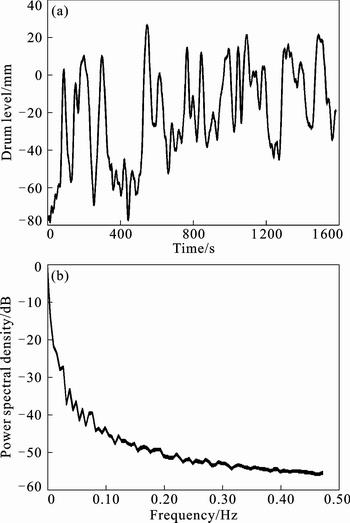
Fig. 19 Drum level data (a)and it��s spectrum analysis(b) from sensor D
6 Conclusions
1) The model of drum level sloshing is set up, and the experimental research is carried out to validate the model. The result of experimental research shows that the model is feasible and effective, and suitable for further research.
2) The simulation results show that variation of the feed-water flow rate, main-steam flow rate and heating quantity can change the frequency of drum level sloshing, i.e., the frequency of sloshing increases with the increase of feed-water flow rate, or the decrease of the main-steam flow rate and the heating quantity.
3) By comparing the results of field data and their spectrum analysis with simulation results, the critical frequency can be confirmed, and the trend of drum level and drum level sloshing data can be differentiated approximately.
4) The critical value of sloshing frequency should be further studied, and it may be changed according to operational condition of HRSG. Next work of this research is to further confirm the critical frequency, and design the filter to delete the signal of drum level sloshing. So, the ratio of signal to noise of drum level can be improved, which will be better for the precise controlling of drum level in the combined cycle.
Acknowledgements
We acknowledge the support of General Electricity Company (GE) in USA, the project of EDISON research foundation from GE (No.200310).
Nomenclature
pv
pressure of steam/MPa
Pl
pressure of mixture of steam and water/MPa
Pe
pressures at input/MPa
Po
pressures at output/MPa
��p
pressure of friction caused by flowing/MPa
rv
density of steam, kg/m3
rg
density of saturated steam, kg/m3
rL
Density of saturated water
rf
density of mixture of saturated water and steam, kg/m3
Vv
volume of steam/m3
Vl
volume of mixture of steam and water/m3
hv
enthalpy of steam in drum, kJ/kg
hw
enthalpy of feed-water, kJ/kg
hl
mixture of steam and water, kJ/kg
hm
mixture of steam and water from right module, kJ/kg
H1
Saturated water from riser , kJ/kg
H2
saturated steam from riser , kJ/kg
hf
enthalpy of saturated water, kJ/kg
hg
enthalpy of saturated steam, kJ/kg
hd
heat of condensation, kJ/kg
gc
acceleration ratio of gravity, m/s2
g
acceleration of gravity, m/s2
Tv
temperature of steam phase in drum/K
Tl
temperature of mixture phase in drum/K
wm
flow rates of mixture of steam and water at output of module, kg/s
ww
flow rates of water in downcomer, kg/s
ws
flow rate of main-steam, kg/s
wg
flow rate of bubbling, kg/s
wc
flow rate of condensation, kg/s
wf
flow rate of flash steam, kg/s
we
flow rates of saturated water from evaporator, kg/s
wd
flow rate of feed-water, kg/s
wl
flow rates of mixture of steam and water from left module, kg/s
wr
flow rates of saturated steam from evaporator, kg/s
Ae
areas at input/m2
Al
areas at output/m2
A
contact area between steam and mixture of steam and water/m2
vi
total input flow rates of module, m/s
vo
total output flow rates of module, m/s
Vb
velocity of bubbling, m/s
Vd
velocity of water dropping, m/s
Qc
heat transfer between saturated steam and mixture of steam and water, kJ/s
Uc
coefficient of heat transfer, W/(m2����C)
x
coefficient of local resistance, dimensionless
X
dryness where local resistance is produced, dimensionless
al
rate of vapor content in saturated water, dimensionless
��
angle between control volume and level, rad
References
[1] AKLILU B T, GILANI S I. Mathematical modeling and simulation of a cogeneration plant [J]. Applied Thermal Engineering, 2010, 30(16): 2545-2554.
[2] CARAZAS F J G, SALAZAR C H, Souza G F M. Availability analysis of heat recovery steam generators used in thermal power plants [J]. Energy, 2011, 30 (6): 3855-3870.
[3] MANASSALDI J I, MUSSATI S F, SCENNA N J. Optimal synthesis and design of heat recovery steam generation (HRSG) via mathematical programming [J]. Energy, 2011, 36(1): 475-485.
[4] DE S, KAIADI M, FAST M, ASSADI M. Development of an artificial neural network model for the steam process of a coal biomass cofired combined heat and power (CHP) plant in Sweden [J]. Energy, 2007, 32: 2099-2109.
[5] ASSILY A M. Modeling, numerical optimization, and irreversibility reduction of a dual-pressure reheat combined-cycle [J]. Applied Energy, 2005, 81(2): 127-151.
[6] BASSILY A M. Modeling, numerical optimization, and irreversibility reduction of a triple-pressure reheat combined cycle [J]. Energy, 2007, 32(5): 778-794.
[7] BASSILY A M. Enhancing the efficiency and power of the triple-pressure reheat combined cycle by means of gas reheat, gas recuperation, and reduction of the irreversibility in the heat recovery steam generator [J]. Applied Energy, 2008, 85 (12):1141-1162.
[8] MOHAGHEGHI M, SHAYEGAN J. Thermodynamic optimization of design variables and heat exchangers layout in HRSGs for CCGT, using genetic algorithm [J].Applied Thermal Engineering, 2009, 29 (2/3): 290-299.
[9] MARTELLI E, AMALDI E, CONSONNI S. Numerical optimization of heat recovery steam cycles: Mathematical model, two-stage algorithm and applications [J]. Computers & Chemical Engineering, 2011, 35(12): 2799-2823.
[10] BEHBAHANI-NIA A, BAGHERI M, BAHRAMPOURY R. Optimization of fire tube heat recovery steam generators for cogeneration plants through genetic algorithm [J]. Applied Thermal Engineering, 2010, 30(16): 2378-2385.
[11] LING Yu-hua, CHEN Lin. Optimum water level control and realization of waste heat boiler in copper converter smelting process [J]. Journal of Central South University: Natural Science, 2005, 36(1): 108-112. (in Chinese)
[12] CAO Xiao-hua, CAO Xiao-ling, JIANG Shao-jian, SU Ming. Dynamic simulation of hydrodynamic model of drum level wave action and sloshing [J]. Journal of Central South University of Technology, 2007, 38 (6):814-819. (in Chinese)
[13] YANG Jin-cheng, CAO Xiao-ling, LIU Yong-wen, SU Ming. Development and Dynamic simulation Research of Thermal Model of Drum Level Wave Action and Sloshing [J]. Journal of System Simulation, 2007, 19(9): 2030-2036.
[14] Boeing Company. The PC-TRAX Theory Manual [M]. Chicago: Boeing Company., 1998.
[15] SADOUN B. Applied system simulation: a review study [J]. Information Sciences, 124(4): 173-192.
[16] YANG Wen-bin, SU Ming. Influence of moist combustion gas on performance of a sub-critical turbine [J]. Energy Conversion and Management, 2005, 46(5): 821-832.
[17] BAO Guang-wei. Equivalent mechanical model of liquid sloshing horizontal cylindrical container [J]. Journal of Shanghai Jiaotong University, 2003, 37(12): 1961-1968.
(Edited by HE Yun-bin)
Foundation item: Project(51276023) supported by the National Natural Science Foundation of China; Project(09k069) supported by the Open Project Funded by Universities Innovation Platform, Hunan Province, China; Project(2011GK311) supported by the Office of Science and Technology of Hunan province, China
Received date: 2012�C03�C18; Accepted date: 2012�C10�C22
Corresponding author: CAO Xiao-ling, PhD; Tel: +86�C15973111541; E-mail: xiaolingcao3258@gmail.com.

