
Numerical simulation of recalescence of 3-dimensional isothermal solidification for binary alloy using phase-field approach
ZHU Chang-sheng(朱昌盛)1, 2, XIAO Rong-zhen(肖荣振)2, WANG Zhi-ping(王智平)2, FENG Li(冯 力)2
1. Computer Aided Designed Center, Lanzhou University of Technology, Lanzhou 730050, China;
2. State Key Laboratory of Gansu New Non-ferrous Metal Materials, Lanzhyou University of Technology,
Lanzhou 730050, China
Received 15 August 2008; accepted 5 June 2009
Abstract: A accelerated arithmetic algorithm of the dynamic computing regions was designed, and 3-dimensional numerical simulation of isothermal solidification for a binary alloy was implemented. The dendritic growth and the recalescence of Ni-Cu binary alloy during the solidification at different cooling rates were investigated. The effects of cooling rate on dendritic patterns and microsegregation patterns were studied. The computed results indicate that, with the increment of the cooling rate, the dendritic growth velocity increases, both the main branch and side-branches become slender, the secondary dendrite arm spacing becomes smaller, the inadequate solute diffusion in solid aggravates, and the severity of microsegregation ahead of interface aggravates. At a higher cooling rate, the binary alloy presents recalescence; while the cooling rate is small, no recalescence occurs.
Key words: phase-field approach; microsegregation; dendritic growth; 3-dimensional simulation; recalescence
1 Introduction
Dendrites are intricate patterns that make up the microstructure of many important commercial alloys. They develop a complex shape due to the emission of secondary branches behind the growing tips of primary branches[1]. Generally, it is difficult to get a perfect equilibrium situation during solidification of alloy, because the segregation by non-equilibrium solidification always occurs except for a few cases[2]. Microsegregation resulted from the solute redistribution causes non-equilibrium secondary phase, porosity and crack formation, which can degrade the mechanical properties of metal products. Thus, the quantitative prediction is indeed very necessary. Experimental methods and analytic methods have been used to predict the degree of microsegregation. But it is very difficult to observe and determine the solute segregation that appears in the small dendrite region. Moreover, analytic models have so many assumptions that they cannot describe actual phenomenon exactly. If it is possible to estimate the degree of microsegregation by means of computer simulation, it will be possible to predict the mechanical and physical properties of metal products.
Recently, phase-field method is very powerful in simulation of dendritic growth, and is becoming one of the important ways to achieve the industrial prediction of the solidification microstructure[3-7]. LOGINOVA et al [8] simulated the dendritic growth of Ni-Cu binary alloy during the solidification, and pointed out the recalescence of alloy solidification. But due to the enormous computing amount of phase-field simulation, little research has been conducted by 3D phase-field method. In this work, based on the accelerated arithmetic algorithm of the dynamic computing regions, the dendritic growth and the recalescence of 3D isothermal solidification for a binary alloy was studied, and the effects of cooling rate on 3D dendritic growth and the recalescence was discussed.
2 Mathematical model
To a system of initially undercooled binary alloy with components A(solvent) and B(solute), the entropy of the system is written as[6]:
 (1)
(1)
where s(Φ, c, e) is the thermodynamic entropy density; Φ is phase-field variable; c is the concentration of solute B in solvent A; e is the internal energy density; ε and δ are coefficients accounting for the phase-field and concentration gradient term corrections, respectively; Ω is the region occupied by the system.
The form for the evolution of phase-field is
 (2)
(2)
Conservation laws govern the solute and energy density transport:
 (3)
(3)
 (4)
(4)
where MΦ, Mc and Me are positive constants.
Using the thermodynamic equation,
 (5)
(5)
the governing equations of the evolution of phase-field, concentration and thermal field are obtained as
 (6)
(6)
where HA(Φ, T) is defined as
 (7)
(7)
In Eq.(7), g(Φ) is defined as
g(Φ)=Φ2-(1-Φ)2 (8)
With the choice, p(Φ)=Φ3(10-15Φ+6Φ2). The reasons for these particular choices are elucidated that the bulk solid and liquid are described by Φ=0 and Φ=1, respectively.
The dynamic equation for the concentration field is written as

 (9)
(9)
where
Dc=Ds+p(Φ)(Dl-Ds) (10)
Dl and Ds are the diffusivities in the liquid and solid, respectively.
The equal solid and liquid thermal conductivities(K) are assumed. MΦ, W and ε are the phase-field parameters which are related to the physical parameters as follows:
 (11)
(11)
 (12)
(12)
 (13)
(13)
where σ is the interfacial energy; β is the kinetic coefficient;  and
and  are the melting point of pure materials A and B; LA and LB are the latent heat of pure materials A and B; and δA and δB are the interface thickness of pure materials A and B, respectively.
For simplicity, the approximations are made as follows:  , WA=WB=W.
3 Numerical issues
3.1 Initial condition and boundary condition
For an initial nuclear of the radius r0, there are
 (14)
(14)
where x, y and z are the coordinate axes; T0 is the initial temperature of the undercooled melt; and c0 is the initial alloy composition, c0=0.491 1. Dendritic axes correspond to axes x, y, z, respectively, 3D Cartesian coordinate system. Initial interface uses sphere to represent an initial nuclear. To reduce the amount of computation, the real simulative size is a quarter section of a computation box.
The Zero-Neumann boundary conditions for Φ and c are imposed at the boundaries (xy face, xz face and yz face) of the computational domain[5]. The boundary temperature is fixed at 1 543 K.
3.2 Thermal noise
The noise was proposed in Ref.[7] by modifying the phase-field equation:
 (15)
(15)
where r is a random number distributed uniformly between -1 and +1, and a new number is generated for every point of the grid, at each time-step; and α is an amplitude of the fluctuations, taken as 0.4.
3.3 Physical parameters and computed parameters
The Ni-Cu alloy is selected. The physical properties for Ni-Cu alloy used in calculation are shown in Table 1.
Table 1 Physical parameters for Ni-Cu alloy

The selection of computed parameters affects directly simulated results. To ensure convergence, Table 2 gives the value of space step Δx, Δy, Δz and time step Δt.
Table 2 Computed parameters

4 Recalescence
During the solidification of alloy, when the undercooling of melt reaches a certain value, the driving forces of dendritic nucleation and growth increase acutely, a great deal of nucleus come into being and grow up. In a relatively shorter time, a mass of latent heat sets free, which exceeds heat to dissipate outwards from system, leading to the raise of temperature of alloy melt, which is so-called recalescence phenomenon.
In order to simulate recalescence in the course of the solidification, the latent released during the solidification has to be considered. A heat balance equation should be coupled in solving phase-field model, and a heat flux is extracted from the domain. This regime is modeled in two ways[8].
1) The isothermal model is coupled with a heat balance which neglects temperature variations in space:
 (16)
(16)
where  is the cooling rate; S is the area of the domain;
 is the change rate of solidoid during
the course of solidification.
Eq.(17) can be dispersed as follows:

 (17)
(17)
where M, N and K are numbers of gridpoints along with x-, y- and z- direction for square computational domain, respectively.
2) By non-isothermal model with Neumann boundary conditions for the heat equation, the heat flux Q imposing on the outer boundary is related to by
 (18)
(18)
where a is the side length of the square computational domain.
5 Numerical results and discussion
5.1 Dendrite pattern and concentration field
With the development of the research for 2D phase-field method, increasing importance has been attached to 3D simulation. However, because 3D simulation is too computationally intensive, high demands are placed on computers performance, therefore, little research has been conducted by 3D phase-field method. To resolve this problem, we developed one sure way, and a accelerated arithmetic algorithm of the dynamic computing regions is designed. The algorithm can reduce the computing time and the dependence of the simulation results on the hardware is great. While the accelerated effect is evident, the quantity of redundancy is little, the calculated precision is reasonable, and the simulation results are more consistent with the real dendritic growth.
Fig.1 shows the 3D dendrite pattern and concentration field in the undercooled Ni-Cu alloy melt. Fig.2 shows the 2D dendrite pattern and concentration field. We can see that the concentration profiles agree well with the dendrite patterns. Fig.2(b) shows clearly the solute segregation both in solid and liquid phases. The concentration in the primary spine of arm as well as in the secondary spine of arm is relatively lower, because the influence of the curvature undercooling is arisen by the curvature effect of the dendritic tip during the solidification, and the curvature effect leads to the solid line descending; nevertheless, the diffusivity of the solute in solid is far less than the velocity of the dendritic tip growth[9]. The concentration ahead of interface in undercooled melt enrichment contributes to the solute redistribution during the course of solidification, which makes the concentration of solid phase lower than the initial concentration, and the speed of the solute diffusivity in liquid phase is less than that of the dendritic growth. So, the solute is educed from the solid while solidifying cannot spread to the liquid fully, resulting in enrichment ahead of dendritic interface.
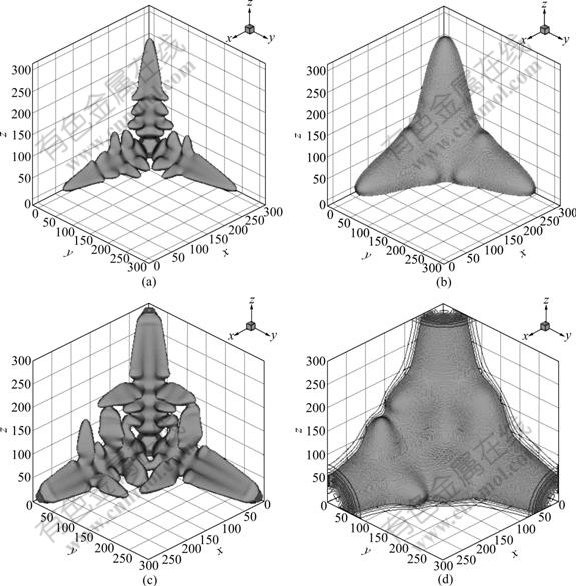
Fig.1 3D dendrite pattern and concentration field: (a) 3D dendritic pattern at t=60 000?t; (b) Solute field at t=60 000?t; (c) 3D dendritic pattern at t=75 000?t; (d) Solute field at t=75 000?t

Fig.2 Primary branch along with 45? direction: (a) Dendrite pattern; (b) Concentration field
Due to the fastest growth speed of dendritic tip, the solute does not diffuse in time, the solute gradient of the tip is the highest. Furthermore, in the mushy regions between the dendritic secondary arms, the solute cannot easily diffuse, leading to the highest concentration.
From Fig.2(b), it can also be found that, on the bottom of the primary arm, the fracture appears in parts of sidebranch roots, which can be explained as follows. When the dendritic grows to certain extent, the computation domain is limited, which makes the solute unable to diffuse adequately, leading to the higher solute oversaturation, as a results, the dendritic fracture happens [10]. Coalescence occurs between some side-branches.
5.2 Recalescence profiles
Because the limits of computational area, the effects of latent released in the course of dendrite growth on temperature field are enormous. To implement the simulation of recalescence, it requires to properly improve the cooling rate in the computational boundary. When the cooling rate is a uniform value, the recalescence temperature is related to the computational area, initial temperature, and so on. The larger the computational area, the fewer the number of nucleus per unit. When initial temperature is same, the smaller the latent released in the computational area, the lower the recalescence temperature. When the computational area is a uniform value, the lower the initial temperature is; the quicker the dendritic growth rate is, the quicker the latent releases, and the lower the recalescence temperature is.
Assuming that initial temperature T0=1 574 T, computational area is foursquare with side length a=7.0×10⁻⁵ m. Fig.3 presents the recalescence profiles of isothermal simulation at cooling rates of 1.0×10³, 5.0×10³, 1.0×10⁴ and 1.0×10⁵ K/s. It can be found that, at the highest cooling rate, the temperature falls down because the composition needs more time to be changed and to cause solidification. At early stage of crystal growth, the change rate of solidoid is small, the latent heat involved during the solidification of alloy is less than the heat dissipated when alloy is cooled down. With the development of dendrite, the cooling causes the system temperature to fall, quickening the dendritic growth. And the heat evolved by reason of solidification increases accordingly, and exceeds heat dissipated outwards gradually; consequently, system temperature increases, and finally, system enters a recalescence stage. If the cooling rate is low enough, it is possible for decreasing again the temperature of system when the crystal grows to a certain extent, because a rise in temperature leads to a decrease in dendritic growing speed, and latent released reduces accordingly. At the same time, the limited computational area results in the decrease in the change rate of solidoid.

Fig.3 Recalescence profile at different cooling rates
When the dendritic growth rate is small, at early stage of development, the temperature increases gradually and constantly in the whole time, and no recalescence takes on.
5.3 Effect of cooling rate on dendritic patterns
From macroscopical point of view, dendritic growth is a transporting process of heat, mass and momentum, and so on. The influence of cooling rate on dendritic pattern and concentration field is obviously. Fig.4 shows the dendritic pattern at different cooling rates at growth time of 6.0×10⁻⁵ s. It can be found that, with the increment of , the dendritic growth velocity increases, and the dendrite shows a morphology of more developed side-branches. With the increase of cooling rate, the more the heat of system loses, the more the latent released in the initial phase of dendritic growth is, and the quicker the temperature drops, accordingly, the higher the undercooling of system is.

Fig.4 Dendritic patterns at growth time of 6.0×10⁻⁵ s and different cooling rates of 1.0×10³ K/s (a), 5.0×10³ K/s (b), 1.0×10⁴ K/s (c) and 1.0×10⁵ K/s (d)
It can also be seen from Fig.4 that with the increment of  both the main branch and side-branches become slender, and the DAS (secondary dendrite arm spacing) becomes small. The greater the cooling rate is, the shorter the arms of side-branches’ coarsening are, and the small the DAS is. When the cooling rate is greater, the coarsening for side-branches is restrained, and dendritic coarsening is not obvious.
From solidification theory, it is clear that dendrite arm spacing depends on the loss of heat. The stronger the loss of heat is, the smaller the regions are affected where every branch gives out heat, therefore, the small the DAS is. Moreover, the capability for loss of heat on solid/liquid interface depends on the cooling rate. The greater the cooling rate is, the stronger the capability for loss of heat in solid/liquid interface is, therefore, the higher the cooling rate is, which sometimes leads to the smaller dendritic structure[10].
5.4 Effect of cooling rate on microsegregation patterns
Fig.5 shows the solute profiles in interface front and phase-field profile when dendritic tip of main branches traverse through the solid/liquid interface along x axis at growth time of 5.5×10⁻⁵ s. It can be found that the solute profile of solid phase region appears to fluctuate because the mathematical model used in this work neglects the influence of solute gradient term on the solute distribution, which makes the interface moving velocity fluctuating acutely follow the growth time, inducing the solute partition coefficient(k) ahead of the interface fluctuation accordingly, in the end, leading to the solute profile of solid phase region fluctuating[11]. It can be found that there is a diffusion layer in the liquid phase region ahead of the interface. In the diffusion layer, the solute concentration presents the index relation and decays along the direction of the initial composition. At distance behind interface front the concentration value equals the initial concentration again, due to the re-distribution of solution in liquid phase by diffusion. Otherwise, we can see that an area increased sharply in solute profile in the solid/liquid interface region, and the area holding the length of some grids is the vale of interfacial thickness[12].

Fig.5 Solute profiles along growth direction at different cooling rates and growth time of 5.5×10⁻⁵ s: (a)  1.0×10³ K/s; (b) 5.0×10³ K/s; (c) 1.0×10⁴ K/s; (d) 1.0×10⁵ K/s
In addition, the structure has an effect on microsegregation and solidification condition plays a role on the severity of micro-segregation. The increase of cooling rate aggravates inadequate solute diffusion in solid; consequently, the microsegregation ahead of interfere front alleviates. We can also see that from Fig.5, with the increment of the dendritic tip velocity rises accordingly and the fluctuation of the solute composition in the solid increases accordingly, and that of the solid/liquid interface corresponding to the peak value of concentration increases. The increase of cooling rate causing the decrease of DAS makes microsegregation dispersed, which reduces the severity of microsegregation. Otherwise, the increase of cooling rate makes the ratio of actual solute distribution(k) and equilibrium distribution coefficient(k0) approach 1, decreasing the difference of solute content between the area of dendritic stem that freezes earlier and residual liquid, which is favourable to restrain dendritic segregation[13]. However, the greater the cooling rate is, the more the side-branches are developed, the more the solute salts out, and the less sufficient the solute diffuses, therefore, the cooling rate does not change the basic distribution laws of solute in dendrite. But the increase of the cooling rate tends to aggravate the severity of microsegregation.
To understand 3D dendritic growth more distinctly, some cutaway views are gotten from different positions, and material parameters and computed parameters are gotten from Table 1 and Table 2 respectively. Fig.6 shows the cutaway views of solute field at cooling rates of 1.0×10³, 5.0×10³, 1.0×10⁴ K/s at position y=80, growth time of 70 000?t. The same conclusion can be obtained as 2D simulation.
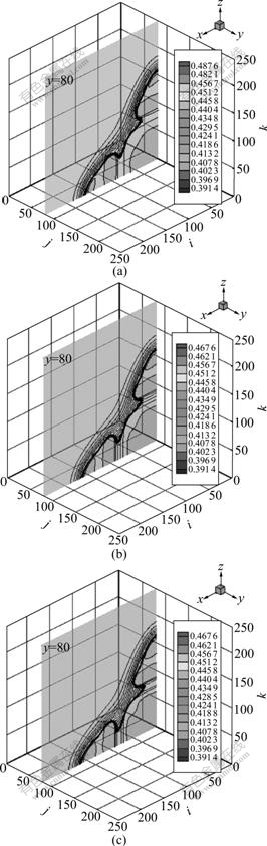
Fig.6 Cutaway views of solute field at position of y=80, t= 70 000?t and different cooling rates: (a)  =1.0×10³ K/s; (b) = 5.0×10³ K/s; (c) =1.0×10⁴ K/s
6 Conclusions
1) A accelerated arithmetic algorithm of the dynamic computing regions was designed, and 3D numerical simulation of isothermal solidification for a binary alloy was implemented. The evolution of the formation of 3D dendritic growth and severity of microsegregation can be realistically simulated using the phase-field method during solidification.
2) With the increment of cooling rate, the dendritic growth velocity increases, both the main branch and side-branches become slender, and the DAS becomes smaller.
3) The larger the cooling rates, the more acutely the solute composition in the solid fluctuates, and the severity of microsegregation ahead of interface aggravates.
4) At the higher cooling rate, recalescence happens; while the cooling rate is small, no recalescence takes on.
References
[1] KARMA A, RAPPEL W J. Phase-field model of decdritic sidebranching with thermal noise [J]. Phys Rev E, 1999, 60(4): 3164-3624.
[2] ZHU Yao-chan, YANG Gen-cang, WANG Jin-cheng, ZHAO Da-wen. Investigation on stability of directionally solidified CBr4-C2Cl6 lamellar eutectic by using multiphase field simulation [J]. Chinese Physics, 2007, 16(3): 805-811.
[3] CHU Zhong, CHEN Zheng, WANG Yong-xin, LU Yan-li, LI Yong-sheng. Microscopic phase-field simulation of L12 and D022 phases during the early precipitation process of Ni-Cr-Al alloy [J]. Journal of University of Science and Technology Beijing, 2006, 13(5): 429-434.
[4] ZHU Yao-chan, WANG Jin-cheng, YANG Gen-cang, ZHAO Da-wen. Multiphase field modeling of the eutectic growth at varying velocity [J]. Acta Metallurgica Sinica, 2007, 43(2): 194-198.
[5] ZHU Chang-sheng, WANG Zhi-ping, LIU Bai-cheng, JING Tao. Effects of phase-field parameters of sidebranching using phase field simulation [J]. Chinese Journal of Mechanical Engineering, 2005, 41: 30-34.
[6] CONTI M. Solidification of binary alloys: Thermal effects studied with the phase field model [J]. Phys Rev E, 1997, 55(1): 765-771.
[7] WARREN J A, BOETTINGER W J. The phase-field method: Simulation of alloy dendritic solidification during [J]. Metallurgical and Materials Transactions A, 1996, 27: 657-669.
[8] LOGINOVA I, AMBERG G, ?GREN J. Phase-field simulation of non-isothermal binary alloy solidification [J]. Acta Master, 2001, 49: 573-581.
[9] LONG Wen-yuan, CAI Qi-zhou, CHEN Li-liang, WEI Bo-kang. Phase-field simulations of solidification of Al-Cu binary alloys [J]. Trans Nonferrous Met Soc China, 2004, 14(2): 291-296.
[10] GU Lin-yu. The relationship between dendritic arm spacings and cooling rate of superalIoy under the directional solidification [J]. Journal of Xi’an Institute of Technology, 1999, 19(2): 147-150. (in Chinese)
[11] LI Mei-e, YANG Gen-cang, ZHOU yao-he. Modelling the crystal growth in highly undercooled alloy melts by non-isothermal phase-field method [J]. Chinese Physics, 2005, 14(5): 838-843.
[12] ZHU Chang-sheng, WANG Zhi-ping, JING Tao, XIAO Rong-zhen. Parameters affecting microsegregation in phase-field simulation [J]. Trans Nonferrous Met Soc China, 2006, 16(4): 760-765.
[13] LI Jian-guo, CHU Shuang-jie, LIU Zhong-yuan, FU Heng-zhi. Effect of wide change of cooling rate on dendritic segregation of a directionally solidified cobalt-base superalloy [J]. Acta Aeronautica Et Astronautica Sinica, 1992, 13(1): 117-120. (in Chinese)
Foundation item: Project(10964004) supported by the National Natural Science Foundation of China; Project(20070231001) supported by Research Fund for the Doctoral Program of Higher Education of China; Project(096RJZA104) supported by the Natural Science Foundation of Gansu Province, China; Project(SB14200801) supported by the Doctoral Fund of Lanzhou University of Technology
Corresponding author: ZHU Chang-sheng; Tel: +86-931-2975338; E-mail: zhucs@lut.cn
DOI: 10.1016/S1003-6326(08)60440-9
(Edited by YANG Hua)

