J. Cent. South Univ. (2012) 19: 1206-1211
DOI: 10.1007/s11771-012-1130-2
Influence of surface roughness on flotation kinetics of quartz
M. Rahimi1, M. R. Aslani2, B. Rezai1
1. Department of Mining and Metallurgical Engineering, Amirkabir University of Technology, Tehran, Iran;
2. Department of Mining Engineering, Science and Research Branch, Islamic Azad University, Tehran, Iran;
? Central South University Press and Springer-Verlag Berlin Heidelberg 2012
Abstract: Surface roughness of quartz particles was determined by measuring the specific surface area of particles. The wettability characteristics of particles were determined by measuring the flotation rate using a laboratory flotation cell. Experimental results show that the rod mill product has higher roughness than the ball mill product. For the particles with larger surface roughness, the flotation kinetics constant is also higher. Finally, empirical relationships between surface roughness (r) and the flotation kinetics constant (k) of quartz particles as k=A+Br+Cr0.5lnr+D/lnr+E/r and k=A+Br are presented, in which A, B, C, D and E are constants related to experimental conditions and mineralogical properties of mineral.
Key words: grinding; flotation kinetics; surface roughness; ball mill; rod mill
1 Introduction
In the flotation process, cumulative recovery as a function of time can be considered as flotation rate. Many empirical models were proposed by different researchers for flotation kinetics [1-2]. Flotation kinetics can be expressed as a first-order rate equation as follows [3-6]:
R=R*(1-exp(-kt)) (1)
where R is the cumulative recovery after time t; R* is the maximum theoretical flotation recovery; k is the rate or kinetics constant; t is the cumulative flotation time.
Plot of [-ln(R*-R)/R*] vs time is a straight line and the slope of this line is the first order rate constant. Surface roughness is due to fluctuations around a surface solid [7]. Surface roughness increases the surface energy of the solid [8]. In general, roughness is confined to changes in the surface representing movements of the surface larger than the interatomic distances. In Fig. 1, the real surface is XY and AB represents the surface of a hypothetical solid of equal volume with a molecularly smooth surface. The surface roughness is defined by [9]
 (2)
(2)
Surface roughness is also calculated from this equation [10]:
Ra=A/A0 (3)
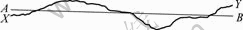
Fig. 1 Profile of solid surface [9]
where A0 is geometric surface area and is obtained from this assumption that mineral grains have regular geometric shapes; A is the specific surface area that is calculated by using the BET isotherm to gas adsorption data [10].
Finally, this equation is obtained from Eq. (3) [10-11]:
 (4)
(4)
where ABET is the BET specific surface area (m2/g); �� is the grain density (g/cm3); D is the average grain diameter (��m); �� is the surface roughness (dimensionless).
Tumbling mills have different breakage mechanisms such as compression, abrasion and impact [12]. These mechanisms cause different changes in physical, chemical and surface properties such as roughness. The amount of these changes depends on specifications of materials and mill, method of milling, ambient temperature and environmental pressure [13].
The surface roughness characteristic of particles will affect the next processes in mineral processing operations such as flotation [14]. DUCKER et al [15] studied the flotation behavior of smooth ballotini and ground ballotini. They observed that there were many differences between flotation results of these materials. They expressed that these differences were due to a difference in their surface roughness. FENG and ALDRICH [16] studied the influence of wet and dry grinding methods on flotation behavior of complex sulphide ores. After being crushed, sulphide ore was ground by the wet rod mill and dry rod mill. The surface roughness of these products was compared by SEM images. It was observed that dry ground products had higher surface roughness than wet ground products. It was also observed that dry ground products had higher flotation recovery than wet ground products. EXTRAND [17] showed that the measured contact angle is higher at rough hydrophobic surfaces. KRASOWSKA and MALYSA [18] prepared the hydrophobic Teflon plates with different surface roughness and measured bubble attachment time to Teflon plates. They observed that bubble attachment time was less for plates with higher surface roughness and the bubble was attached during the first collision.
In the reported works by others, the influence of surface roughness on wettability of particles was investigated by measuring the contact angle and stability of intervening liquid film [17-18]. In some works, the influence of surface roughness on wettability was investigated by the Hallimond tube and in the other works surface roughness was investigated only in the qualitative form [11, 16].
In this work, the influence of surface roughness on wettability is investigated by a laboratory flotation cell with considering the time during the recovery. On the other hand, the influence of roughness on flotation kinetics is investigated.
2 Experimental
2.1 Material
The representative sample was obtained from Ghazvin Province, Iran. Chemical and mineralogical analyses were done by XRD (X-ray diffraction) (Fig. 2) and XRF (Table 1) methods and the results showed that this sample was pure enough.
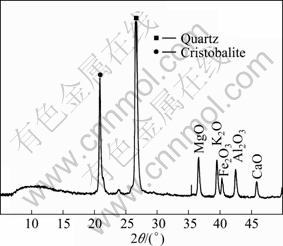
Fig. 2 Mineralogical analysis result of sample by XRD technique
Table 1 Chemical composition of quartz mineral (mass fraction, %)
In this work, the collector with a trade name Armac C was used for doing the flotation tests. Its manufacturer company is Akzo Nobel Surface Chemistry AB and its chemical name is coco-alcyl-amine-acetate (C-N; R22-R34-R50). Its density is 880 kg/m3 and its solubility in water is good.
2.2 Methods
A flow sheet of the process is shown in Fig. 3.
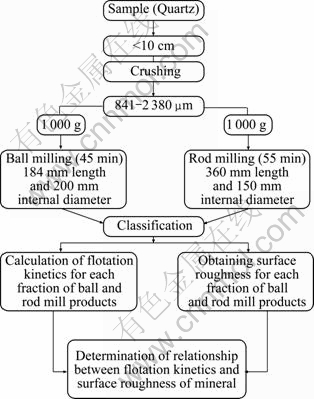
Fig. 3 Flow sheet of process
Flotation experiments were performed in a laboratory Denver machine, model D12, using a 1.5 L cell. The test conditions were: 1 000 r/min for rotor speed, 4 min for collector conditioning, 70 s for froth removal until the froth was barren of quartz. Sample mass for each test was 100 g and water volume was 1.2 L.
In this work, Eq. (4) was used for the calculation of surface roughness. BET surface area, grain density and average grain diameter were measured for the calculation of surface roughness. BET specific surface area was measured by Micrometrics Gimini III 2375, USA.
3 Results and discussion
For doing flotation kinetics tests, initial conditions in which recovery is the maximum were determined. Flotation tests were done on the same samples with different collector dosages and the maximum recovery was obtained in 1 500 g/t(Ore) collector dosage. Table 2 gives the results of these tests.
Table 2 Results of flotation tests for determination of optimal collector dosage
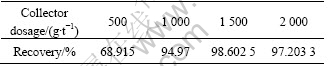
Appropriate pH for quartz flotation kinetics tests that maximize the recovery is 9 [19]. Therefore, flotation kinetics tests were done in the above conditions. All flotation tests were done in triplicate and the reproducibility of the experiments was good.
3.1 Results of surface roughness
The results of particles roughness are given in Table 3. It can be observed that when particle size decreases, the surface area for ball and rod mill products increases. Furthermore, for all size fractions, surface area of rod mill products is larger than that of ball mill products.
Table 3 Results of specific surface area and surface roughness for products of each mill
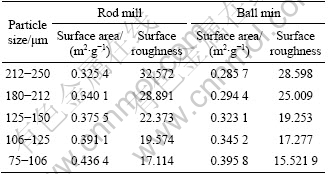
Table 3 shows that the surface roughness for both ball and rod mill products decreases when particle size decreases while surface area increases. With size reduction, it is expected that surface area and surface roughness of particles increase, but according to Eq. (4), surface roughness depends on both surface area and particle size. In this case with reduction in particle size, surface area increases but the influence of size reduction is larger than the increase of surface area. It can also be observed from Table 3 that for a particular size, rod mill products have larger surface roughness than ball mill products.
3.2 Effect of grinding type on flotation
For successful flotation, collision and attachment of bubble to particle must occur. For this reason, the intervening liquid film between bubble and particle must rupture. The stability of this intervening liquid film depends on surface properties of the solid. For hydrophobic solids, this intervening liquid film has less stability and the measured contact angle is larger [18].
To investigate the effect of surface roughness on flotation kinetics, the flotation kinetics constant of ball and rod mill products were measured. According to Eq. (4), for the 212-250 ��m, 180-212 ��m, 125-150 ��m, 106-125 ��m and 75-106 ��m fractions, surface area is different for ball and rod mill products. This is due to their different grinding mechanisms. It can be seen from Tables 4-8 that for a particular size, the rod mill products that have larger surface roughness than the ball mill products have faster flotation kinetics. Figures 4-8 show these results in graphical form.
Table 4 Flotation recovery for 212-250 ��m fraction of ball and rod mill products
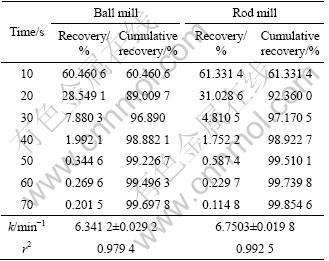
Table 5 Flotation recovery for 180-212 ��m fraction of ball and rod mill products
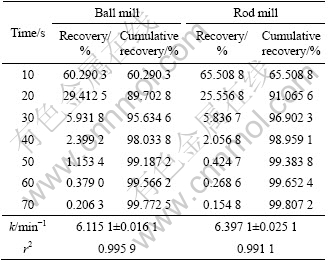
Table 6 Flotation recovery for 125-150 ��m fraction of ball and rod mill products
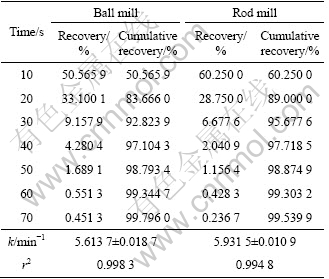
Table 7 Flotation recovery for 106-125 ��m fraction of ball and rod mill products
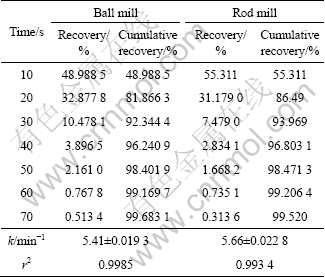
Table 8 Flotation recovery for 75-106 ��m fraction of ball and rod mill product
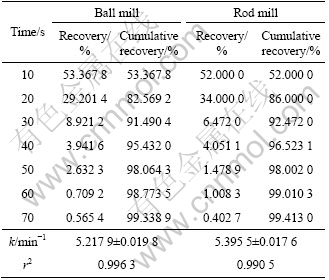
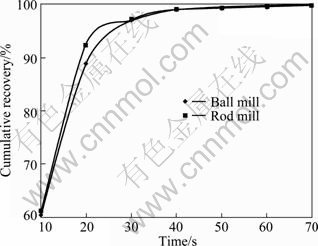
Fig. 4 Cumulative recovery vs time for 212-250 ��m fraction of ball and rod mill products
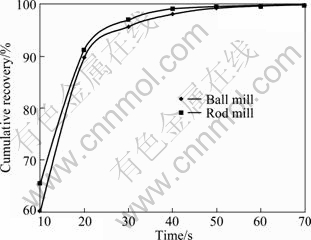
Fig. 5 Cumulative recovery vs time for 180-212 ��m fraction of ball and rod mill products
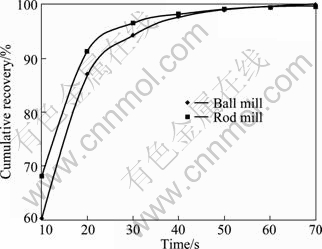
Fig. 6 Cumulative recovery vs time for 125-150 ��m fraction of ball and rod mill products
According to the above results, for the particles with higher surface roughness, the flotation kinetics constant is also higher.
3.3 Effect of particle size on flotation
According to Table 3, the surface roughness of ball and rod mill products decreases with size reduction.
Results of flotation kinetics tests for rod and ball mill products show that the flotation rate decreases with size reduction. Therefore, it can be concluded that the flotation rate decreases with reduction in surface roughness for rod and ball mill products (Figs. 9 and 10).
Figure 11 shows the above results as a bar chart. It can be concluded from this work that the flotation kinetics constant decreases with surface roughness reduction. Our results are in agreement with the results of ANFRUNS and KITCHENER [20], DUCKER et al [15], FENG and ALDRICH [16], EXTRAND [17] and KRASOWSKA and MALYSA [18]. ANFRUNS and KITCHENER [20] explained that intervening liquid film rupture is easier at rougher surfaces even when the measured contact angle is lower. AHMED et al [21] showed that more time and larger forces are required for separating the particles from gas/liquid interface for rougher surfaces. KRASOWSKA and MALYSA [18] explained that this phenomenon is due to the following reasons: 1) Higher surface roughness means a higher pillar on the surface that increases the probability of intervening liquid film rupture; 2) There are larger cavities at rougher surfaces in which a greater amount of gas can be present [18].
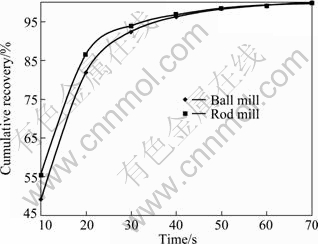
Fig. 7 Cumulative recovery vs time for 106-125 ��m fraction of ball and rod mill products

Fig. 8 Cumulative recovery vs time for 75-106 ��m fraction of ball and rod mill products
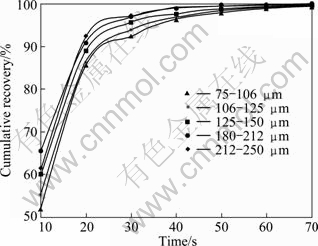
Fig. 9 Cumulative recovery vs time for different fractions of rod mill products
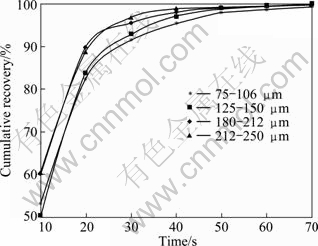
Fig. 10 Cumulative recovery vs time for different fractions of ball mill products
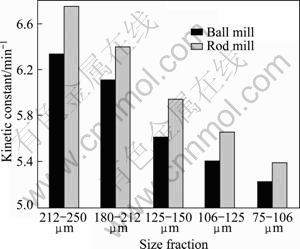
Fig. 11 Flotation rate for ball and rod mill products
In this work, two empirical relationships between surface roughness and the flotation kinetics constant of quartz particles have been determined as follows:
k=A+Br+Cr0.5lnr+D/lnr+E/r (5)
where k is the flotation kinetics constant (min-1) and r is the surface roughness. A, B, C, D and E are also constants:
A=5 764.692 8, B=36.207 551, C=-14.658 23,
D=-19 733.359, E=32 802.573, r2=0.999 6566
k=A+Br (6)
A=3.934 793, B=0.086 13, r2=0.993 459 4
We have derived many relations between experimental results. According to Eq. (5), the maximum amount of r2 was obtained and the simplest relation was Eq. (6). Therefore, we chose these equations. The amount of r2 obtained by Eq. (6) is close to the optimum r2 obtained by Eq. (5) while the Eq. (6) is simpler than Eq. (5) and also Eq. (6) is linear. Therefore, we used Eq. (6) as the final empirical relation (the simplest and linear one).
4 Conclusions
The influence of surface roughness on flotation kinetics constant of quartz particles was determined. Surface roughness for different fractions of ball and rod mill products was determined by measuring the BET specific surface area. Experimental results for quartz particles showed that the surface roughness for both ball and rod mill products decreases with the reduction of particle size. For a particular size, the rod mill products have larger surface roughness than the ball mill products. The results of flotation kinetics tests for the rod and ball mill products showed that the flotation kinetics constant decreases with size reduction. Therefore, the flotation kinetics constant decreases with surface roughness reduction for rod and ball mill products. The results of flotation kinetics tests for quartz particles also showed that for a particular size, the rod mill products have larger surface roughness and faster flotation kinetics than the ball mill products. Therefore, flotation kinetics constant decreases with surface roughness reduction. This is due to intervening liquid film rupture being easier at rougher surfaces.
References
[1] KUOPANPORTTI H, SUORSA T, DAHL O, NIINIMAKI J. A model of conditioning in the flotation of a mixture of pyrite and chalcopyrite ores [J]. International Journal of Mineral Processing, 2000, 59(4): 327-338.
[2] KLIMPEL R R. Optimizing the industrial flotation performance of sulfide minerals having some natural floatability [J]. International Journal of Mineral Processing, 2000, 58 (1�C4): 77-84.
[3] XU M. Modified flotation rate constant and selectivity index [J]. Minerals Engineering, 1998, 11(3): 271-278.
[4] OLIVEIRA J F, SARAIVA S M, PIMENTA J S, OLIVEIRA A P A. Kinetics of pyrochlore flotation from Araxa mineral deposits [J]. Minerals Engineering, 2001, 14(1): 99-105.
[5] AGAR G E, CHIA J, REQUIS C L. Flotation rate measurements to optimize an operating circuit [J]. Minerals Engineering, 1998, 11(4): 347-360.
[6] ?ILEK E C. Estimation of flotation kinetic parameters by considering interactions of the operating variables [J]. Minerals Engineering, 2004, 17(1): 81-85.
[7] SZLEIFER I, SHAUL A B, GELBERT W M. Chain statistics in micelles and bilayers: Effects of surface roughness and internal energy [J]. J Chem Phys, 1986, 85(9): 5345-5358.
[8] HOGG R. Characterization of mineral surfaces [M]// SOMASUNDARAN P Ed, Fine Particle Processing, Vol. I. New York: Society of Mining Engineers of AIME, 1980: 492-524.
[9] JAYCOCK M J, PARFITT G D. Chemistry of interfaces [M]. Chichester, UK: Ellis Horwood Publications, 1981: 156-161.
[10] HODSON M E, LEE M R, PARSONS I. Origins of the surface roughness of unweathered alkali feldspar grains [J]. Geochimica et Cosmochimica Acta, 1997, 61: 3885-3896.
[11] HICYILMAZ C, ULUSOY U, BILGEN S, YEKELER M. Flotation responses to the morphological properties of particles measured with three-dimensional approach [J]. International Journal of Mineral Processing, 2005, 75: 229-236.
[12] KELLY Z G, SPOTTISWOOD D J. Introduction to Mineral Processing [M]. New York: Wiley, 1982: 117.
[13] ORUMWENSE O A, FORSSBERG E. Surface and structural changes in wet ground minerals [J]. Powder Technology, 1991, 68: 23-29.
[14] OLIVER J F, HUH C, MASON S G. An experimental study of some effects of solid surface roughness on wetting [J]. Colloids and Surfaces, 1980, 1: 79-104.
[15] DUCKER W A, PASHLEY R M, NINHAM B W. The flotation of quartz using a double-chained cationic surfactant [J]. Journal of Colloid and Interface Science, 1988, 128: 66-75.
[16] FENG D, ALDRICH C. A comparison of the flotation of ore from the Merensky Reef after wet and dry grinding [J]. International Journal of Mineral Processing, 2000, 60: 115-129.
[17] EXTRAND C W. Criteria for ultralyophobic surfaces [J]. Langmuir, 2004, 20: 5013-5018.
[18] KRASOWSKA M, MALYSA K. Kinetics of bubble collision and attachment to hydrophobic solids: I. Effect of surface roughness [J]. International Journal of Mineral Processing, 2007, 81: 205-216.
[19] VIEIRA A M, PERES A E C. The effect of amine type, pH, and size range in the flotation of quartz [J]. Minerals Engineering, 2007, 20: 1008-1013.
[20] ANFRUNS J F, KITCHENER J A. Rate of capture of small particles in flotation [J]. Trans Inst Min Metall, 1977, 86: C9-C15.
[21] AHMED M M, STECHEMESSER H, MABROUK S A, IBRAHIM G A, TARSHAN M M. The relationship between the surface roughness, shape and detachment force of particles from the liquid/gas interface using centrifuge method [C]// 49 Berg-und Huettenmaennischer Tag, Kolloquium 2, Partikeltechnologie, Freiberg, Germany, 1998: 207-223.
(Edited by YANG Bing)
Received date: 2011-07-08; Accepted date: 2011-10-17
Corresponding author: M. Rahimi; Tel: +98-9131065063; Fax: +98-2166405846; E-mail: rahimi.mehdi@yahoo.com, rahimi410@aut.ac.ir

