
J. Cent. South Univ. (2018) 25: 1213-1225
DOI: https://doi.org/10.1007/s11771-018-3819-3

Experimental investigation on damage evolution behaviour of a granitic rock under loading and unloading
DAI Bing(戴兵)1, 2, 3, ZHAO Guo-yan(赵国彦)2, H. KONIETZKY3, P. L. P. WASANTHA3
1. Nuclear Resources Engineering College, University of South China, Hengyang 421001, China;
2. School of Resources and Safety Engineering, Central South University, Changsha 410001, China;
3. Geotechnical Institute, TU Bergakademie, Freiberg 09599, Germany
 Central South University Press and Springer-Verlag GmbH Germany, part of Springer Nature 2018
Abstract: In-situ rock failures can result from stress changes due to pure loading and/or unloading. Understanding of the damage evolution behavior in brittle rocks during loading and unloading is imperative for the designs of rock structures. In this paper, we investigate the damage evolution characteristics of a granitic rock during loading and unloading after a series of triaxial experiments performed at different confining pressures. The axial stress–axial strain variations of the tested specimens revealed that the specimens undergoing unloading fail with a lower axial strain compared to the specimens failed purely by loading. Higher confining pressures were observed to exacerbate the difference. Volumetric strain versus axial strain curves indicated that the curves reverse the trend with the beginning of major damage of specimens. We suggest here a new form of equation to describe the secant modulus variation of brittle rocks against the axial stress for the unloading process. Failure mechanisms of tested specimens showed two distinct patterns, namely, specimens under pure loading failed with a single distinct shear fracture while for the unloading case specimens displayed multiple intersecting fractures. In addition, analysis of the evolution of dissipation and elastic energy during deformation of the specimens under loading and unloading conditions showed differentiable characteristics. Moreover, we evaluated the variations of two damage indices defined based on the energy dissipation and secant modulus evolution during deformation and observed that both of them satisfactorily distinguish key stages of damage evolution.
Key words: damage evolution; loading and unloading; granitic rock; triaxial testing
Cite this article as: DAI Bing, ZHAO Guo-yan, H. KONIETZKY, P. L. P. WASANTHA. Experimental investigation on damage evolution behaviour of a granitic rock under loading and unloading [J]. Journal of Central South University, 2018, 25(5): 1213–1225. DOI: https://doi.org/10.1007/s11771-018-3819-3.
1 Introduction
Subsurface rocks are under three-dimensional in-situ stress state. Rock excavations for various applications such as mining, caving and tunneling, disturb the virgin in-situ stress field of rock. According to numerous studies in the literature, rock masses undergo loading before the excavation [1–4]. Rock mass close to the open rock surfaces of an excavation often undergoes unloading and stress relaxation during and after the excavations that can lead to severe rock failures such as rock bursts, spalling and collapses [5–7]. Clearly, both loading and unloading can induce failure in rock masses.
Failure of brittle rock is often progressive where the damage accumulation begins with micro-scale failures [8]. Damage evolution behaviour of rock is directly linked with the stability of rock structures, meaning that it is of great importance for any kind of safety considerations of rock structures [9, 10]. The damage evolution in rocks under both loading and unloading is a non-equilibrium and nonlinear process, and the origin and nature of damage evolution characteristics of rock under loading and unloading can have significant differences. Thorough understanding of the underlying mechanisms of damage evolution in brittle rock under both loading and unloading is imperative for characterizing their failure behaviour and to identify possible precursors of rock failures in order to avoid or minimize the adverse impacts of such failures.
Numerous experimental studies in the literature investigate the damage evolution behaviour of various rock types in loading. AYLING et al [11] studied the microcrack propagation behaviour in two dry sandstones (Darley dale and Gosford sandstone) during triaxial deformation and observed an initial closure of suitably oriented pre-existing cracks followed by dilatant crack growth occurring predominantly parallel to the major loading axis. BAUD [12] investigated the damage accumulation in Darley dale sandstone during triaxial creep using pore volumometry and observed that the level of applied differential stress has a crucial effect on the creep rate and time-to-failure. EBERHARDT et al [13] explored the progressive pre-peak damage process in pink Lac du Bonnet granite under uniaxial compression and showed that the crack initiation and crack damage thresholds for pink Lac du Bonnet granite are 39% and 75% of peak strength, respectively. CAI et al [14] proposed two simple generalized models to determine the crack initiation and crack damage stress thresholds. SUN et al [15] conducted a series of triaxial compression tests on a weathered porphyrite and observed that the weathered soft rock under both unsaturated and saturated conditions has strong confining pressure dependency on deformation. LI et al [16] used granite to discuss the dispersion damage mechanics based on fracture mechanics and established a relationship between the micro-fracture and the macro dilation. WASANTHA et al [17] investigated the water-weakening behaviour of Hawkesbury sandstone in brittle regime and one of their observations suggests that micro-cracking begins at progressively earlier stages of loading when confining stress increases. SHAO et al [18] explored the effect of temperature on the thermo- mechanical behaviour of Australian Strathbogie granite under uniaxial compression and observed that increasing temperature decreases the stress thresholds for crack initiation and crack damage and extends the duration of stable crack propagation.
The vast majority of the previous experimental studies considered the damage evolution of rocks under loading and only very few studies explored that under unloading. For example, GUO et al [19] investigated the mechanical behaviour of salt rock under unloading and found that the plastic deformation of salt rock is different from that of brittle failures of hard rocks under unloading. ZHAO et al [20] performed true-triaxial unloading tests on granite specimens and their results suggested that the rock samples are prone to strain burst failure under high unloading rates and the associated acoustic emission (AE) energy release during the strain burst process is dependent on the unloading rate. QIU et al [21] and ZHANG et al [22] studied the effect of unloading rate on the strength of rock and concluded that the strength of rock increases with increasing unloading rate.
In this work, we conduct a comprehensive experimental study to better understand the damage evolution characteristics of a granitic rock during loading and unloading. In particular, the specific differences of damage evolution behaviour between loading and unloading scenarios are explored here using a single experimental program in order to derive key insights of the failure behaviour of brittle rock under loading and unloading. Furthermore, we endeavour in this study to quantitatively describe the damage evolution process of granitic rock under both loading and unloading in order to assist with designing safe and stable rock structures. Forthcoming sections detail the methodology and results of the experimental work.
2 Experimental procedure
A series of laboratory experiments was conducted on granitic rock specimens under triaxial stress conditions and following sections independently describe the procedure in detail.
2.1 Testing material and sample preparation
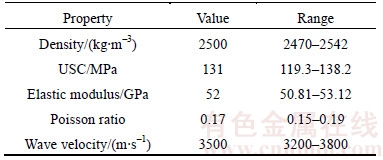
We used granitic rock samples sourced from the Sanshandao gold mine in Shandong province, China, for testing. The samples were obtained from a depth of 400–600 m and some basic geo-mechanical properties of this granitic rock are shown in Table 1. Cylindrical specimens with diameter of 49–50 mm were cored from a single rock block and all coring was performed in a common orientation. The cylindrical cores were then cut to a length of 110 mm. Rock cores did not show any visible discontinuities, meaning that they can be assumed as macroscopically homogeneous. Then, the end surfaces of each specimen were ground to ensure that the ends are smooth and perpendicular to the long axis of the samples and the final length of the specimens varied between 99.5 and 100 mm (i.e. length-to-diameter ratio ≈ 2). The machining accuracy of the specimens was in accordance with the specifications of the International Society for Rock Mechanics (ISRM) recommended methods [23].
Table 1 Basic geo-mechanical properties of tested material
2.2 Testing apparatus and procedure
All tests were performed under triaxial stress conditions using a MTS 815 rock testing system housed at the Advanced Research Centre of Central South University (Figure 1). This servo-controlled testing rig comprises with five major units: 1) pumping unit to apply the confining pressure with a capacity of 40 MPa, 2) loading frame with a capacity of 3600 kN to apply the axial load, 3) data acquisition unit to record the data related to deformation, pressure and loading, 4) linear variable differential transducer (LVDT) unit to measure the circumferential strain and 5) a separate LVDT unit to measure the axial strain.
The testing program of this study included two series of testing: 1) conventional triaxial compression tests in which the specimens were loaded until the failure (referred to as loading tests hereafter), and 2) loading in which specimens were first loaded to a predetermined stress level after which the confining stress was released (unloaded) at a constant rate until specimen failure while axial stress was unchanged (referred to as unloading tests hereafter). Three different confining pressures –σ2=σ3=10, 20 and 30 MPa were considered for both loading and unloading tests. Figure 2 schematically illustrates the stress paths for both loading and unloading tests. In loading tests, confining pressure was first applied to the desired level before the constant stress rate axial loading was applied at a rate of 0.05 MPa/s (this loading rate was selected to ensure static loading condition) until failure (see Figure 2). For unloading tests, confining pressure was first applied similar to the loading tests and set to a pre-determined level (i.e., 10, 20 and 30 MPa). Then the axial load was applied at the same constant stress rate of 0.05 MPa/s until the deviatoric stress reached 80% of the peak strength (a stress level close to the yield strength and greater than the uniaxial compressive strength) under each confining pressure (the peak strengths under different confining pressures were determined from loading tests). The unloading process (i.e. releasing the confining pressure while maintaining constant axial stress) was then started at a rate of 0.05 MPa/s and continued until the specimen failure (see Figure 2).
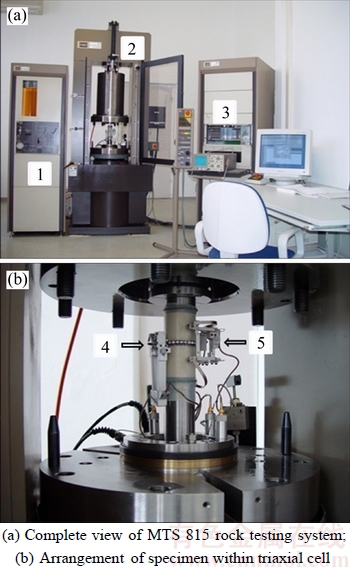
Figure 1 Components of testing apparatus:(1–Pump unit; 2–Loading frame; 3–Data acquisition unit; 4–LVDT unit for circumferential strain; 5–LVDT unit for axial strain)
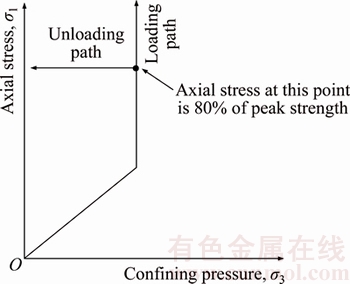
Figure 2 Schematic diagram of stress path for loading and unloading tests
3 Results and analysis
The results of the experimental work performed as described in the previous section were analyzed in different ways to quantitatively describe the damage evolution characteristics of the tested granitic rock under loading and unloading conditions.
3.1 Stress–strain behaviour and failure mechanisms
Figure 3 shows the axial stress–axial strain curves of the specimens tested under the loading case. The points P1, P2 and P3 on Figure 3 represent the peak strengths (σ3c) of specimens at 10, 20 and 30 MPa confining pressures, respectively. Unsurprisingly, peak strength increases with increasing confining pressure and the post-peak portions of the curves indicate a more brittle response of the rock specimens tested under lower confining pressures. The stress–strain curves of the specimens tested for the unloading case are shown in Figure 4. As described before, the specimens were first loaded up to 80% of their peak strengths before the unloading process was started under each confining pressure.The points a2, b2 and c2 of Figure 4 mark the stages of the beginning of unloading and the points a3, b3 and c3 mark the stages of the end of unloading process at confining pressures of 10, 20 and 30 MPa, respectively.
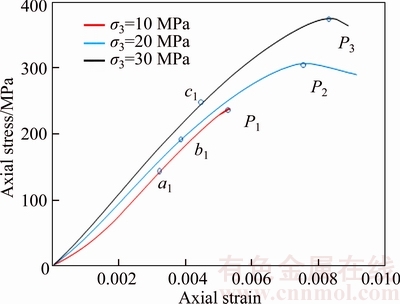
Figure 3 Axial stress–axial strain curves of specimens tested for loading
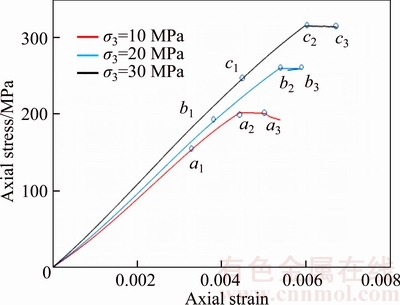
Figure 4 Axial stress–axial strain curves of specimens tested for unloading
The volumetric strain, εv (calculated according to εv=ε1+2ε3 where ε1 and ε3 are axial and lateral strains, respectively) versus axial strain relationships are shown in Figure 5 for both loading and unloading. The points, a1, b1 and c1 of the axial stress–axial strain curves of Figures 3 and 4 correspond to the stages of the reversal points of volumetric strain–axial strain curves as shown by the points a1, b1 and c1 of Figure 5 for the confining pressures 10, 20 and 30 MPa, respectively. Table 2 summarizes some of the key mechanical observations obtained from the stress–strain variations of Figures 3, 4 and 5. Table 2 clearly shows that σi (i.e., the axial stress at the reversal point of volumetric strain curve) increases with increasing confining pressure for both loading and unloading. The ratio of σi/σ3c also rises with increasing confining pressure according to Table 2 and it is within the range of 60%–70% of peak strength for the considered range of confining pressures. These behaviours are consistent with those observed by some scholars [13, 24]. In addition, Table 2 depicts that the axial strain at failure for unloading is smaller than that for loading under all three confining pressures and the difference becomes more pronounced with increasing confining pressure. Up to 80% of the peak strength specimens tested under both loading and unloading exhibit closely similar axial strains at corresponding confining pressures. Thus, the difference of axial strains at failure between loading and unloading scenarios is a product of the difference of damage evolution and failure development behaviour under the two scenarios. Specimens undergoing unloading fail with lower axial strains as a product of the release of confining pressure that allows lateral deformation all around the sample. Dominance of the lateral strain for the unloading case is evident from the volumetric strain–axial strain curves of Figure 5, which shows approximately similar volumetric strains at the failure for both loading and unloading cases at corresponding confining pressures where the axial strains for specimens tested under unloading are smaller.
Post-failure images of the specimens tested for both loading and unloading tests are shown in Figure 6. Two distinct failure patterns can be observed from the images of Figure 6, namely the specimens tested for the loading case failed predominantly with a distinct single shear fracture plane whereas two intersecting shear fracture planes are manifested by the specimens tested for unloading. While single shear fracture plane of specimens tested for loading is not unexpected more shear planes, specimens tested for unloading could be a product of the release of confining pressure from all around the specimen that facilitates easier strain energy release by forming multiple macro fractures.
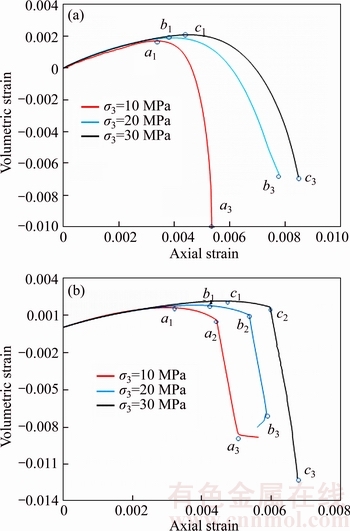
Figure 5 Volumetric strain versus axial strain curves of specimens tested for loading (a) and unloading (b)
3.2 Evolution of secant modulus
Secant modulus (ET) which accounts for the instantaneous variation of the elastic modulus is an important parameter to describe the damage evolution behaviour of brittle materials. Evolution of the secant modulus of brittle rock under loading has been studied in the literature and can be described as shown in Eq. (1), according to CHEN et al [25].
 (1)
(1)
Table 2 Key information from stress–strain curves (σi represents the axial stress at which the volumetric strain curve reverses (i=a1, b1, c1); σj and εj represents the axial stress and axial strain, respectively, at which the unloading was started (j=a2, b2, c2) and εf represents the axial strain at which the sample failed in loading and unloading tests (f=a3, b3, c3))
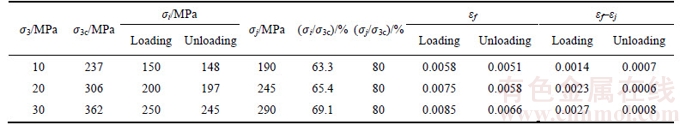
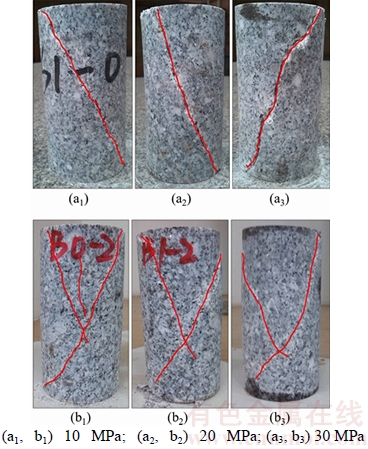
Figure 6 Post-failure images of tested specimens at different confining pressures for loading (a) and unloading (b)
where A1, A2, A3, A4 and A5 are constants.
Equation (1) can be further simplified as follows:
 (2)
(2)
where B1, B2, B3 and B4 are constants.
We calculated the secant modulus from axial stress–axial strain curves and Figure 7 shows the variations of secant modulus against the axial stress under different confining pressures for loading tests. Secant modulus rapidly increases initially due to the stiffening resulting from the closure of pre-existing cracks with the increase of axial stress (this part is not shown in Figure 7) and stabilizes in a range of axial stress followed by a steep decrease under all confining pressures. The beginning of the steep decrease of secant modulus was identified to coincide with the reversal points of corresponding volumetric strain versus axial strain curves (Figure 7). This observation verifies the fact that reversal point of the volumetric strain–axial strain curve marks the beginning of significant plastic damage accumulation. The fitting lines of Figure 7 were derived following Eq.(2) and the constants applicable to the tested granitic rock are shown in Table 3. According to Figure 7 and the coefficient of correlation values for the fitted curves for each confining pressure shown in Table 3, it can be seen that the secant modulus variation against axial stress is satisfactorily expressed by the form of Eq. (2). According to Eq. (2) and Table 3, initial elastic modulus of the tested granitic rock before any damage are 53.736, 55.490 and 58.550 GPa for the confining pressures of 10, 20 and 30 MPa respectively.
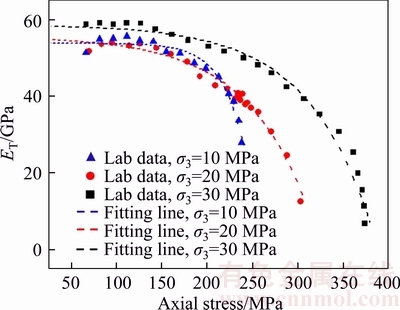
Figure 7 Secant modulus versus axial stress for specimens tested for loading at different confining pressures
Figure 8 shows the secant modulus variation against confining pressure for unloading tests. Note that the laboratory data points of the Figure 8 display the secant modulus variation only for the unloading process. At each confining pressure secant modulus begins from a particular value which is approximately constant in a range of confining pressures after which it rapidly decreases with further decrease of confining pressure. We modified Eq. (2), which was derived for loading, to describe the secant modulus evolution during unloading and shown in Eq.(3).
Table 3 Values of constants of Eqs. (1) and (2) (R2 is the coefficient of correlation)
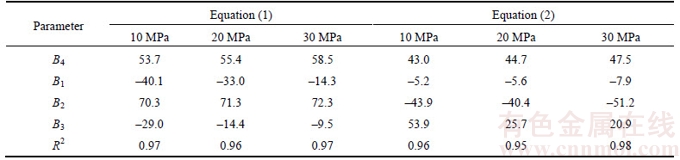
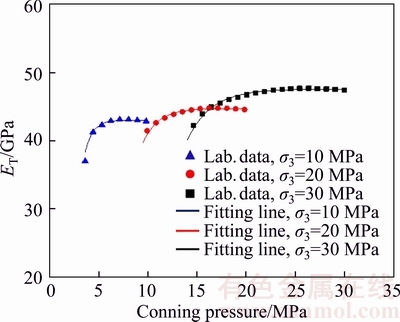
Figure 8 Secant modulus versus confining pressure for specimens tested for unloading at different initial confining pressures
 (3)
(3)
Fitting lines for each confining pressure condition according to Eq. (3) are shown in Figure 8 and the relevant constants according to Eq. (3) are tabulated in Table 3. The coefficients of correlation values as shown in Table 3 prove that the secant modulus-axial stress variation for unloading can be adequately described in the form of Eq.(3) suggested by the present study.
3.3 Energy analysis
During conventional triaxial testing, the testing apparatus does positive work on the specimen in axial direction and confining pressure does negative work, due to the radial dilation of the specimen [26].Hence, the total strain energy (U),evolves as a result of the external work done on the specimen during the process of triaxial testing and can be expressed as follows [25–27]:
 (4)
(4)
where
 (5)
(5)
 (6)
(6)
where ε1t and ε3t are the axial and lateral strain at any time t, respectively.
Based on the principal of energy conservation, the total strain energy (U)can be divided into two parts, the elastic strain energy (Ue), which is stored in specimens, and the dissipation energy (Ud), which is the energy dissipation due to plastic deformation and crack propagation. Therefore, U can be expressed as
 (7)
(7)
According to XIE et al [28, 29] and HUANG et al [27], the elastic strain energy (Ue) is given by

 (8)
(8)
Substituting Eqs. (5)–(8) into Eq. (4), the following equation can be obtained:

 (9)
(9)
We calculated the Ue and Ud from Eqs. (8) and (9), respectively, followed by the total energy (U) from Eq. (7), which is equal to the total work done by the external forces, for both loading and unloading tests and shown in Figure 9.
According to Figure 9, U, Ue and Ud show a plausible initial increase with increasing axial strain. Before the reversal points of the volumetric strain–axial strain curves (i.e. points a1, b1, c1 of the curves of Figure 9), total energy (U) comprises mainly with the elastic energy (Ue) with relatively insignificant contribution from dissipation energy (Ud) for both loading and unloading tests under all confining pressures. From the stage where reversal of the volumetric strain–axial strain curve occurs, dissipation energy (Ud) gradually increases until the failure for loading tests under all confining pressures. In contrast, dissipation energy (Ud) gradually increases from the stage where reversal of the volumetric strain–axial strain curve occurs until the unloading begins for unloading tests followed by a rapid increase until the failure under all confining pressures (contrasting gradients can be seen from the curves of Figure 9 before and after unloading begins for unloading tests).
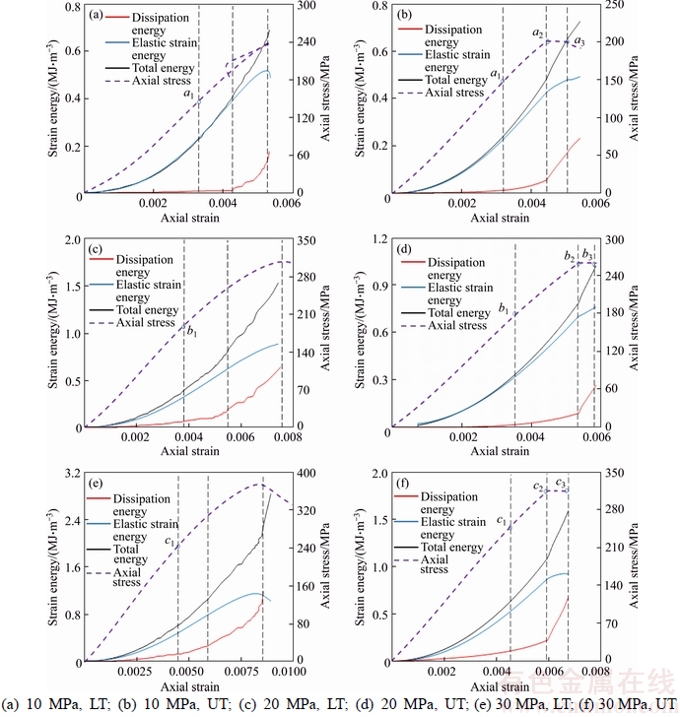
Figure 9 Strain energy and axial stress versus axial strain for both loading and unloading tests (Confining pressure/test type: LT, loading test; UT, unloading test)
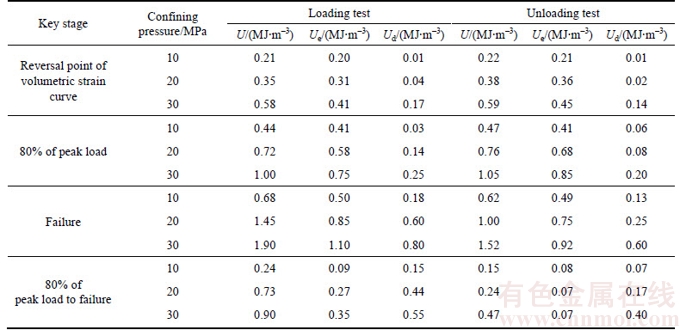
Energy levels at different key stages of loading/unloading for both loading and unloading tests are summarized in Table 4. According to Table 4, it is clear that both elastic and dissipation energies, so as the total energy, increase with increasing confining pressure for both loading and unloading. This is a result of the greater external work done on the specimens tested at higher confining pressures. As expected, all energy levels (i.e., U, Ue and Ud) until 80% of the peak strength through the reversal point stage of the volumetric strain–axial strain curve for both loading and unloading are approximately similar at corresponding confining pressures. The difference of dissipation energies between 80% of the peak strength stage and rock failure, which are 0.15, 0.44 and 0.55 MJ/m–3 for loading tests and 0.07, 0.17 and 0.40 MJ/m–3 for unloading tests under 10, 20 and 30 MPa confining pressures, respectively, reveals that unloading failures of rock dissipate lower amount of energy compared to those fail purely by loading.
Table 4 Energy levels at different stages of loading/unloading for loading and unloading tests
3.4 Damage evolution behaviour based on damage indices
In order to characterize the damage evolution, two damage indices, one based on the dissipation energy [26] and the other based on the secant modulus [25], are used here. These damage indices are defined as follows:
 (10)
(10)
 (11)
(11)
where UDmax is the dissipation energy at failure; ET0 is the secant modulus at the reversal point of volumetric strain–axial strain curve and ET1 is the secant modulus at failure.
We studied the damage evolution of the tested granitic rock in this study based on the above two damage indices and their variations against axial strain for both loading and unloading tests are shown in Figure 10.
As Figure 10 displays that DE is nearly unchanged for both loading and unloading tests until the stage where reversal of the volumetric strain–axial strain curve occurs followed by a rapid increase (points a1, b1 and c1 of Figure 10). The variation of DW against axial strain also exhibits that the DW increases slowly until the reversal of the volumetric strain–axial strain curve occurs after which the rapid increase can be observed for both loading and unloading. This observation suggests that the major damage of the specimens begins with that particular occurrence of the volumetric strain– axial strain curve (i.e., the reversal of the curve). In general, it can be seen from Figure 10 that both damage indices for unloading tests increase faster than those for loading tests under all confining pressures with the beginning of rapid increase and the difference becomes more pronounced with increasing confining pressure. In addition, DW shows a more distinct difference of the gradient of the curve sections before and after unloading begins (i.e., before and after the points a2, b2 and c2 of Figure 10) for unloading tests (Figure 10). Therefore, considering all characteristics of DE and DW curves, it can be suggested that while both indices are satisfactory to characterize the damage evolution of brittle rocks under loading and unloading, DW can be a slightly better index for the same due to the visible distinction of the curves for loading and unloading. Moreover, for the same strain, lower confining pressure shows more damage after the beginning of rapid increase for both DE and DW. This is an indication of more sudden failure of specimens under lower confining pressures under both loading and unloading. This behaviour verifies the fact that rock behaves more brittly under lower confining pressures.
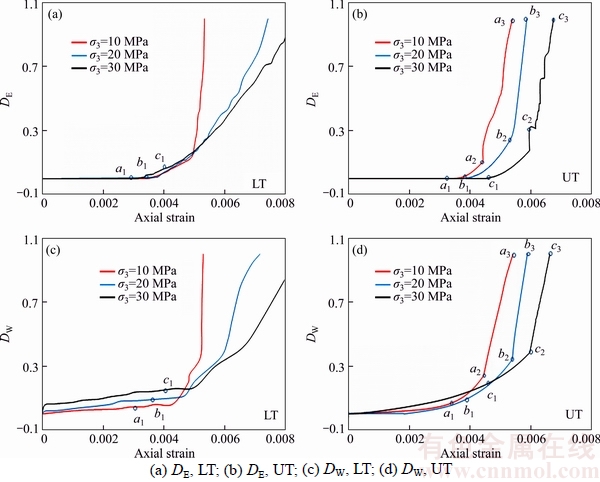
Figure 10 Damage indices, DE and DW versus axial strain (LT, loading test; UT, unloading test)
To better understand the difference of the evolution of damage indices in loading and unloading tests, we plotted the differences of the damage indices values between unloading and loading (i.e., DEU–DEL and DWU–DWL, where U and L stand for unloading and loading, respectively) against axial strain as displayed in Figure 11. Note that only the regions from 80% of peak strength (i.e., the beginning of the unloading for unloading tests) are shown in Figure 11.
According to Figure 11, all the curves conceivably begin with a value close to zero inferring a similar level of damage at 80% of peak strength in the specimens tested for both loading and unloading. Furthermore, it can be generally seen that both the differences of damage indices (i.e., DEU–DEL and DWU–DWL) display similar trends at corresponding confining pressures and are positive for majority of the axial strains, implying that the damage indices for unloading is higher than that for loading. Interestingly, the maximum values of both cases under all confining pressures fall within the range 0.5–0.6. This is an indication that the damage accumulation during the unloading process is more efficient in terms of the axial strain than that under loading, and unloading failures can occur with less axial deformation due to this reason.
4 Conclusions
1) The failure strain of specimens for unloading is smaller than that for loading under all three confining pressures considered for testing and the difference becomes more pronounced with increasing confining pressure. Major damage of the specimens marks the reversal of the trend of the volumetric strain–axial strain curves under all confining pressures. Secant modulus evolution during deformation revealed fundamental differences for loading and unloading, and a new form of equation was suggested in this study to describe the evolution of secant modulus during unloading that complements with the same available for loading condition.
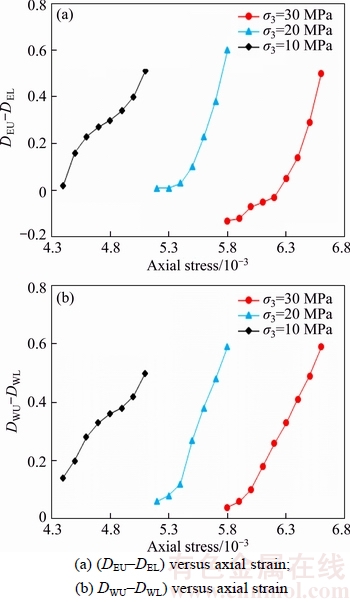
Figure 11 Difference of damage indices between unloading and loading
2) Analysis of the variation of elastic and dissipation energies during the deformation of specimens suggested that before the reversal of the volumetric strain–axial strain curve occurs, elastic energy prevails (i.e., more energy is stored in the specimen with elastic deformation) after which the dissipation energy becomes dominant (i.e., energy is dissipated by plastic deformation). A distinct difference of the pattern of energy dissipation against axial strain before and after the unloading begins was observed for unloading tests. Furthermore, the loading failures displayed greater energy dissipation than unloading failures, meaning that unloading failures may occur less violently.
3) Two damage indices, one based on dissipation energy and the other based on secant modulus (DW and DE, respectively), were used to quantitatively describe the damage evolution process and showed distinct characteristics at key stages of damage evolution. These characteristics of both indices can assist in characterizing the damage evolution in brittle rock under loading and unloading. For the sake of differentiating the damage evolution between loading and unloading conditions, DW displayed slightly better visual distinctions on the space against axial strain.Moreover, the variations of the differences of the damage indices between unloading and loading against axial strain substantiated the fact that unloading failures can occur with less axial deformation increase than pure loading failures due to more efficient damage accumulation during the unloading process.
References
[1] DU Kun, LI Xi-bing, LI Di-yuan, WENG Lei. Failure properties of rocks in true triaxial unloading compressive test [J]. Transactions of Nonferrous Metals Society of China, 2015, 25(2): 571-581. DOI: 10.1016/S1003-6326(15)63639- 1.
[2] LI Xi-bing, YAO Jin-rui, GONG Feng-qiang. Dynamic problems in deep exploitation of hard rock metal mines [J]. The Chinese Journal of Nonferrous Metals, 2011, 21(10): 2551-2563. DOI: 1004-0609(2011)10-2551-13. (in Chinese)
[3] WAHL M H, MCKELLAR H N, WILLIAMS T M. Patterns of nutrient loading in forested and urbanized coastal streams [J].Journal of Experimental Marine Biology and Ecology, 1997, 213(1): 111–131. DOI: 10.1016/S0022- 0981(97)00012-9.
[4] DAI Bing, HE Gui-cheng, ZHANG Zhi-jun. A numerical research on crack process of gypsum containing single flaw with different angle and length in uniaxial loading [J]. Shock and Vibration, 2018. DOI: 10.1155/2018/2968205.
[5] DAI Bing, ZHAO Guo-yan, dong Long-jun, YANG Chen. Mechanicalcharacteristics for rocks under different paths and unloading rates under confining pressures [J]. Shock and Vibration, 2015. DOI: 10.1155/2015/578748.
[6] WANG Min,CAO Ping, WAN Wen, ZHAO Yan-lin, LIU Jie, LIU Jing-shuo. Crack growth analysis for rock-like materials with ordered multiple pre-cracks under biaxial compression [J]. Journal of Central South University, 2017,24(4): 866-874. DOI: 10.1007/ s11771-017-3489-6.
[7] YIN Tu-bing,WANG Pin, LI Xi-bing. Effects of thermal treatment on physical and mechanical characteristics of coal rock [J]. Journal of Central South University, 2016,23(9): 2336–2345. DOI: 10.1007/s11771-016-3292-9.
[8] WASANTHA P L P, RANJITH P G, VIETE D R. Influence of the geometry of partially-spanning joints on the uniaxial compressive strength of rock [J].International Journal of Rock Mechanics and Mining Sciences, 2012,50: 140–146. DOI: 10.1016/j.ijrmms.2012.01.006.
[9] LI Xi-bing, CAO Weng-zuo, ZHOU Zi-long. Influence of stress path on excavation unloading response [J].Tunnelling and Underground Space Technology,2014, 42: 237–246. DOI: 10.1016/j.tust.2014.03.002.
[10] HUANG Qiu-run, HUANG Da. Experimental research on affection laws of unloading rates on mechanical properties of Jinping marble under high geostress [J].Chinese Journal of Rock Mechanics and Engineering, 2010,29(1): 21–33. (in Chinese)
[11] AYLING M R, MEREDITH P G. Microcracking during triaxial deformation of porous rocks monitored by changes in rock physical properties, I. Elastic-wave propagation measurements on dry rocks [J]. Tectonophysics, 1995, 245(3): 205–221. DOI: 10.1016/0040-1951(94)00235-2.
[12] BAUD P, MEREDITH P G. Damage accumulation during triaxial creep of Darley Dale sandstone from pore volumometry and acoustic emission [J].International Journal of Rock Mechanics and Mining Sciences, 1997, 34(3): 24.
[13] EBERHARDT E, STEAD D, STIMPSON B. Identifying crack initiation and propagation thresholds in brittle rock [J].Canadian Geotechnical Journal, 1998,35(2): 222–233.
[14] CAI M, KAISER P K, TASAKA Y. Generalized crack initiation and crack damage stress thresholds of brittle rock masses near underground excavations [J].International Journal of Rock Mechanics and Mining Sciences, 2004, 41(5): 833–847. DOI: 10.1016/j.ijrmms.2004.02.001.
[15] SUN D A, MATSUOKA H. Deformation and strength characteristics of weathered soft rock using triaxial tests [J]. International Journal of Rock Mechanics and Mining Sciences, 2004, 41: 87–92. DOI: 10.1016/j.ijrmms.2004.03. 024.
[16] LI Jie, WANG Ming-yang, FAN Peng-xian. Study of loading-unloading states and energy distribution relationship for rock mass [J]. Rock and Soil Mechanics, 2012, 33(Supp.2): 125–132. (in Chinese)
[17] WASANTHA P L P, RANJITH P G. Water-weakening behavior of Hawkesbury sandstone in brittle regime [J]. Engineering Geology, 2014, 178: 91–101. DOI: 10.1016/ j.enggeo.2014.05.015.
[18] SHAO S, RANJITH P G, WASANTHA P L P. Experimental and numerical studies on the mechanical behavior of Australian Strathbogie granite at high temperatures: An application to geothermal energy [J].Geothermics,2015, 54: 96–108. DOI: 10.1016/j.geothermics.2014.11.005.
[19] GUO Yin-tong, YANG Chun-he, FU Jian-jun. Experimental research on mechanical characteristics of salt rock under tri-axial unloading test [J]. Rock and Soil Mechanics, 2012, 33(3): 725-732. (in Chinese)
[20] ZHAO, X D, WANG J, CAI M, CHENG C, MA L K, SU R, ZHAO F, LI D J. Influence of unloading rate on the strain burst characteristics of Beishan granite under true triaxial unloading conditions [J].Rock Mechanics and Rock Engineering, 2014,47(2): 467–483. DOI: 10.1007/s00603-013-0443-2.
[21] QIU Si-li, FENG Xia-ting. Experimental research on mechanical properties of deep-buried marble under different unloading rates of confining pressures [J].Chinese Journal of Rock Mechanics and Engineering,2010, 29(9): 1807–1817. (in Chinese)
[22] ZHANG Kai, ZHOU Hui, PAN Peng-zhi, SHEN Lin-fang, FENG Xia-ting, ZHANG Yuan-gang. Characteristics of strength of rocks under different unloading rates [J]. Rock and Soil Mechanics,2010, 31(7): 2072–2078. (in Chinese)
[23] ULUSAY R, HUDSON J. A ISRM. The complete ISRM suggested methods for rock characterization, testing and monitoring: 1974–2006. [C]// Commission on Testing Methods International Society of Rock Mechanics. Turkey: Ankara: ISRM Turkish National Group, 2007: 628.
[24] LAJTAI E Z, CARTER B J, DUNCAN E S. Mapping the state of fracture around cavities [J]. Engineering Geology, 1991,31(3): 277–289. DOI: 10.1016/0013-7952(1)90012-A.
[25] CHEN Wei, KONIETZKY H, TAN Xin. Pre-failure damage analysis for brittle rocks under triaxial compression [J].Computers and Geotechnics, 2016,74: 45–55. DOI: 10.1016/j.compgeo.2015.11.018.
[26] ZHAO Guo-yan, DAI Bing, DONG Long-jun. Energy conversion of rocks in process of unloading confining pressure under different unloading paths [J].Transactions of Nonferrous Metals Society of China, 2015, 25(5): 1626– 1632. DOI: 10.1016/S1003-6326(15)63767-0.
[27] HUANG D, LI Y. Conversion of strain energy in triaxial unloading tests on marble [J].International Journal of Rock Mechanics and Mining Sciences,2014, 66: 160–168.
[28] XIE He-ping, PENG Rui-dong, JU Yang. On energy analysis of rock failure [J]. Chinese Journal of Rock Mechanics and Engineering, 2015, 24(15): 2603–2608. (in Chinese)
[29] XIE He-ping, JU Yang, PENG Rui-dong. Energy mechanism of deformation and failure of rock masses [J].Chinese Journal of Rock Mechanics and Engineering,2008, 27(9): 1729–1739. (in Chinese)
(Edited by YANG Hua)
中文导读
加、卸载条件下花岗岩损伤演化分析
摘要:在不同围压下进行三轴试验,研究花岗岩在加载和卸载过程中的损伤演化特征。通过分析试样的轴向应力、轴向应变变化表明,在轴向应变较低时,试样卸荷破坏失效与加载条件下的不同。围压越高这种不同越明显。本文提出了一种新的描述脆性岩石割线模量随轴向应力变化的方程。试件的破坏机制表现出2种不同的模式:在纯加载荷下,试样没有明显的剪切断裂,而卸载试样则表现出多个相交的断裂。此外,分析了在加载和卸载条件下,试样在变形过程中的耗散和弹性能的演化规律。此外,根据损伤过程中的能量耗散和割线模量演化来评价2种损伤指数的变化,并观察到2种损伤的演化过程都能很好地区分损伤演化的关键阶段。
关键词:损伤演化;加载和卸载;花岗岩;三轴试验
Foundation item: Projects(51774187, 51324744, 51374129) supported by the National Natural Science Foundation of China; Project(71380100006) supported by the Innovation Foundation of Doctoral Student in Hunan Province, China; Project(2017SK2280) supported by the Key Research and Development Program of Hunan Provincial Science and Technology Department, China; Project(17A184) supported by the Key Research Foundation of Education Bureau of Hunan Province, China
Received date: 2016-11-02; Accepted date: 2017-02-23
Corresponding author: DAI Bing, PhD, Lecturer; Tel: +86–15116703930; E-mail: daibingcsu@gmail.com; ORCID: 0000-0003-2590- 1473

