J. Cent. South Univ. (2017) 24: 2382-2395
DOI: https://doi.org/10.1007/s11771-017-3650-2

Test and numerical investigations on static and dynamic characteristics of extra-wide concrete self-anchored suspension bridge under vehicle loads
ZHOU Guang-pan(�ܹ���)1, LI Ai-qun(�Ⱥ)1, 2, LI Jian-hui(���)3, DUAN Mao-jun(��ï��)3
1. School of Civil Engineering, Southeast University, Nanjing 210096, China;
2. Beijing Advanced Innovation Centre for Future Urban Design, Beijing University of
Civil Engineering and Architecture, Beijing 100044, China;
3. School of Civil Engineering, Nanjing Forestry University, Nanjing 210037, China
 Central South University Press and Springer-Verlag GmbH Germany 2017
Abstract: The present work is aimed at studying the mechanic properties of the extra-wide concrete self-anchored suspension bridge under static and dynamic vehicle loads. Based on the field test using 12 heavy trucks and finite element simulations, the static deformations of different components, stress increments and distributions of the girder, as well as the vibration characteristics and damping ratio of the Hunan Road Bridge were analyzed, which is the widest self-anchored suspension bridge in China at present. The dynamic responses were calculated using the Newmark-�� integration method assisted by the simulation models of bridge and vehicles, the influences on the dynamic impact coefficient (DIC) brought by the vehicle parameters, girder width, eccentricity travel and deck flatness were also researched. The spatial effect of the girder is obvious due to the extra width, which performs as the stress increments distribute unevenly along the transverse direction, and the girder deflections and stress increments of the upper plate change as a ��V�� and ��M�� shape respectively under the symmetrical vehicle loads affected by the shear lag effect, cross slope and local effect of the wheels, the maximum of stress increments are located in the junctions with the inner webs. The obvious girder torsional deformation and the apparent unevenness of the hanger forces between the two cable planes under the eccentric vehicle loads, together with the mode shapes such as the girder transverse bending and torsion which appear relatively earlier, all reflect the weakened torsional rigidity of the extra-wide girder. The transverse displacements of towers are more obvious than the longitudinal ones. As for the influences on the DIC, the static effect of the heavier vehicles plays a major role when pass through with a higher speed and the changes of vehicle suspension stiffness generate greater impacts than the suspension damp. The values of DIC in the vehicle-running side during the eccentric travel, affected by the restricts from the static effects of the eccentric moving trucks, are significantly smaller than the vehicle-free side, the increase in the road roughness is the most sensitive one among the above influential factors. The results could provide references for the design, static and dynamic response analysis of the similar extra-wide suspension bridges.
Key words: self-anchored suspension bridge; extra-wide girder; field test; simulation; vehicle loads; increments distribution; damping ratio; mode shape; dynamic impact coefficient
1 Introduction
Due to the improvements of the construction level, it has become a trend for a long time to put equal emphasis on both of the practicability and attractiveness of highway bridges and the concrete self-anchored suspension bridge becomes more competitive among all kinds of bridge type because of its economy, elegant appearance and reasonable stress form [1�C3]. Since the majority of self-anchored suspension bridges are built in the thoroughfare of city transportation, the growth of traffic volume prompts the width of girder to increase to 40�C60 m, in order to meet the increasing needs for lane��s number. As the vehicle loads act directly on the girder, the increases in traffic volumes and heavy vehicles, together with the unique structural form and complex stress state make the global mechanical behaviors of the self-anchored suspension bridge under the vehicle loads draw great attentions. Furthermore, the spatial effect of the extra-wide girder becomes a key issue in the bridge engineering field because of its complex stress state and width [4, 5].
The research methods of the influences on the bridge brought by vehicle loads mainly include the numerical simulation, lab experiment with the reduced scale model and field test. As for the simulation research, the sub-model method was adopted to study the stress state of the steel girder of Runyang South Suspension Bridge under the vehicle loads [6]. Five finite element models of the simply supported beam bridges with different girder sections were established by DENG et al [7] to compare the simulation results of the dynamic impact coefficient (DIC) with the values defined by Chinese codes, and the influences on the DIC brought by section types were also researched. The vibration differential equations of the vehicle model with five freedom degrees and the simply supported beam bridge were established respectively by WANG et al [8] using the D�� Alembert principle and finite element method to research the vehicle-bridge coupled vibration response and influences on the DIC brought by the parameters of vehicle and road roughness. However, the numerical simulation is difficult to exactly obtain the stress state of the details and load��s direct action points of girder. As for the reduced scale model experiments, the models of different bridge types were manufactured by LI and WU [9], SONG et al [10] and HE et al [11] to test the deflection and stress under the live load, yet the lab experiments are limited by the lab conditions and fine level of the models and difficult to actually reflect the state of bridge. Therefore, the measured data obtained by the field test and the numerical simulation analysis should be combined to grasp the stress state of the bridge under vehicle loads accurately. At present, the static and dynamic load tests of the concrete continuous bridges [12, 13], cable-stayed bridges [14] and steel self- anchored suspension bridges [15] are relatively common, while the field test for the concrete self-anchored suspension bridges [16] is few, especially for the one with an extra-wide and heavy girder.
Based on the field test using 12 heavy trucks and numerical simulation methods, the global static characteristics, stress increments and distributions of the girder under vehicle loads, together with the natural vibration characteristics and damping ratio of the Hunan Road Bridge were studied, whose girder is the widest currently among the similar bridge type in China. A simplified vehicle model with three degrees of freedom was established and the simulation results of the dynamic deflections obtained by conducting the full Newton iteration and solving the coupled vibration equations using the Newmark-�� integration method were compared with the measured data to verify the reliability of simulation. The influences on the DIC brought by the speed and weight of vehicle, stiffness and damp of vehicle�� suspension system, eccentric travel and road flatness were researched, and the distributions of DIC along the transverse direction of girder were also analyzed.
2 Hunan Road Bridge
The global layout of Hunan Road Bridge and the section type of girder are shown in Figs. 1 and 2, respectively. The span arrangement of which is 53 m+ 112 m+53 m=218 m, the main girder with a width of 52 m is the widest among the bridges of the similar type in China currently, and the longitudinal and transverse slopes of which are 2.5% and 1.5%, respectively. The lateral distance between the two cable planes is 31.7 m and the rise-span ratios of the midspan and side span are 1/5.276 and 1/12.965, respectively. The towers are connected by a crossbeam and assisted by the side towers transversely. The serial numbers of the hangers from the west to east are N1�CN37 and S1�CS37 in the north and south sides, respectively, and the crossbeams are densely arranged with an interval of 5 m in the girder corresponding to the hangers. The numbers beginning with the CS in Fig. 1 represent the analysis control section at the towers, endpoints of the girder, midpoints of side span, and the quarter points of midspan respectively.
3 Field tests
Ten values such as the displacements of towers, force increments of hangers, bending moments and deflections of the midpoints of midspan were selected as the load efficiency control indexes, which represent the most adverse effects under designed live loads, in order to obtain the vehicle arrangements of each of the eleven static test conditions with a load efficiency coefficient of 0.95 to 1.05 [17]. Twelve triaxial trucks produced by China National Heavy Duty Truck Group (SINOTRUK) were adopted as the test vehicles to simulate the designed vehicle loads in aspects of the axle mass, wheel distance and the pressure without generating partial loads beyond the designed range, and the mass of each truck was 45 t. The wheelbase and spacing arrangement of the vehicles are shown in Fig. 3. Since the stress states of the middle section of the midspan and side span under the symmetrical and eccentric vehicle loads are relatively adverse, this four representative situations were selected to analyze. The corresponding positions of vehicles are described in Table 1 and the layouts are shown in Fig. 4.
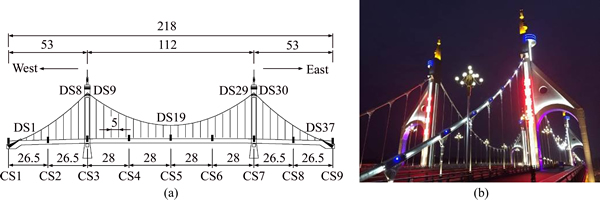
Fig. 1 Global layout of Hunan Road Bridge (m)
As for the dynamic test, six trucks were divided into three groups according to the mass 15 t, 30 t and 45 t, and the driving speed included 20, 30, 40, 50 and 60 km/h, the heights of the obstacles in the jumping test included 5 cm and 10 cm. The representative layouts of the measuring points and instruments of CS5 section are shown in Fig. 5, the measuring points of DB and DC were used to test the deformations of the girder and cable, respectively, which were measured with a total station instrument, as well as the displacements of towers; The SU and SD were used to test the stress increments and its transverse distributions of the upper and bottom plate of girder, respectively, which were measured with the vibrating wire strain gauges. The DT was used to test the dynamic vertical deflections of the girder and their transverse distributions, which were measured with the dynamic deflection meters. The AH and AB were used to test the natural vibration characteristics, hangers�� internal forces and the vibration accelerations of the hangers and girder, which were measured with the DH5920 dynamic testing system. The layouts of the rest analysis control sections were the same as Fig. 5.
4 Simulations and verifications
4.1 Finite element model
The finite element models of Hunan Road Bridge established with the ANSYS program are shown in Fig. 6, and the internal forces of hangers and the alignments of cable were obtained by conducting the iterative calculation assisted by the analytical computing software for suspension bridge [18] and the construction monitoring data.
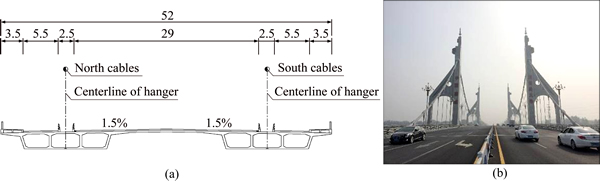
Fig. 2 Cross section of extra-wide girder (m)
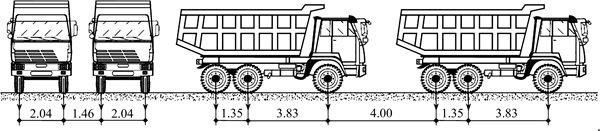
Fig. 3 Spacing arrangement and wheelbase (m)
Table 1 Description of vehicles�� positions
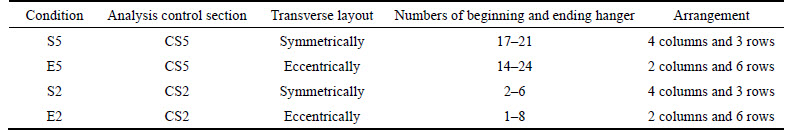
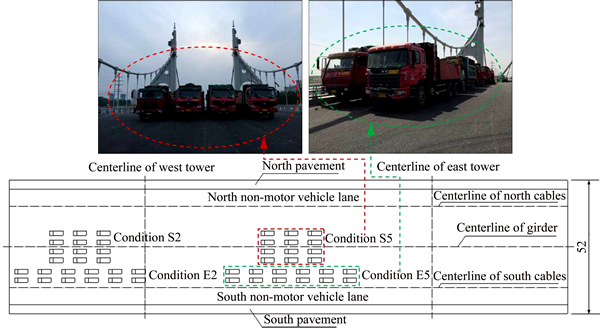
Fig. 4 Locations and scenes of static test (m)
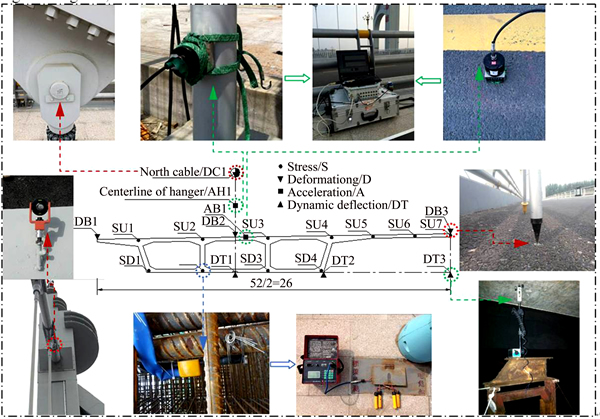
Fig. 5 Representative layout of measuring points and instruments (m)
The Timoshenko beam was adopted to simulate the towers, crossbeams and the girder, which can consider the warpage and the stresses of the hotpots were obtained through controlling the section mesh, and the calculation efficiency was improved greatly. The beam elements that only consider the tension were used to simulate the cables, hangers and the prestressed steel bundles, and the internal forces of the cables and hangers were exerted by defining the initial strains, as well as the prestresses. The compression amounts of the girder and towers were simulated by changing the temperatures of the rigid arms which connected the girder and cables, and the towers�� tops and cables. The DOF between the girder, towers, and the approach bridges were constrained according to the actual bearing types. The additional quality elements were adopted to simulate the weights of the deck pavements, saddles, clips, approach bridges and the decorative segments of towers. The static vehicle loads were equivalent to the concentrated forces according to the actual axle weights. To verify the reliability of the simulation model, the simulated results of the natural frequencies, deflections and stresses obtained through the initial equilibrium analysis of the model were compared with the measured data shown in Table 2, and the coincidences show that the simulation model can accurately realize the actual final state of Hunan Road Bridge.
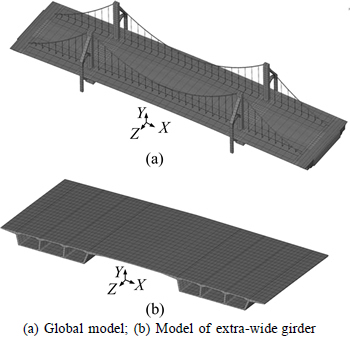
Fig. 6 Finite element models:
4.2 Simulation methods of coupled vibration
The simplified vehicle model with three degrees of freedom shown in Fig. 7 was established to simulate the float, nod and roll of the testing trucks in the dynamic test, and according to the actual vehicle parameters, the values of the spring stiffness of the front axle KL1 and KR1 were 1117680 N/m, and the damping coefficients CL1 and CR1 were 4190 kg/s; the values of the rear axle were 10882940 N/m and 19060 kg/s, respectively.
The respective vibration differential equations of the vehicle and bridge were contacted by the coordination equations of the force and displacement at the vehicle- bridge contact points [7], the kinetic equation of the vehicle-bridge system is expressed as follows:

 (1)
(1)
wherein the [M], [C] and [K] were the mass matrix, damping matrix and stiffness matrix, respectively, and the Zb and Zv were the displacement vectors of the bridge and vehicle, respectively. The Pvr and Pbr were the interaction forces between the vehicles and bridge, and the subscript r represented the roughness and pre-camber of the deck. The Pv was the gravity of vehicle. The damping matrix [Cb] was determined through defining the Rayleigh damping with the equation [Cb]=��[Mb]+ ��[Kb], and the values of �� and �� were calculated by the damping ratio �� shown as Eq. (2), wherein the ��i and ��j were the circular frequencies, the ��i and ��j were the corresponding damping ratio.
 (2)
(2)
The damped modal analysis of the bridge finite element models was conducted firstly, the frequencies and damping ratio were extracted and in good agreement with the measured data (the comparisons see later), then the Rayleigh damping were obtained through Eq. (2). The moving vehicle loads were simulated through controlling the life and death of the vehicle model elements, and the dynamic responses were obtained by conducting the full Newton iteration and solving Eq. (1) using the Newmark-�� time-integration method after inputting the Rayleigh damping. The comparison of the dynamic vertical deflection of the CS5-DT3 measuring point between the simulated and measured results is shown in Fig. 8, the measured data were obtained through the 30 km/h driving test using two 30 t trucks, the anastomosis reflects that the numerical simulation method can accurately simulate the dynamic bridge responses under moving vehicle loads.
Table 2 Verification of finite element model
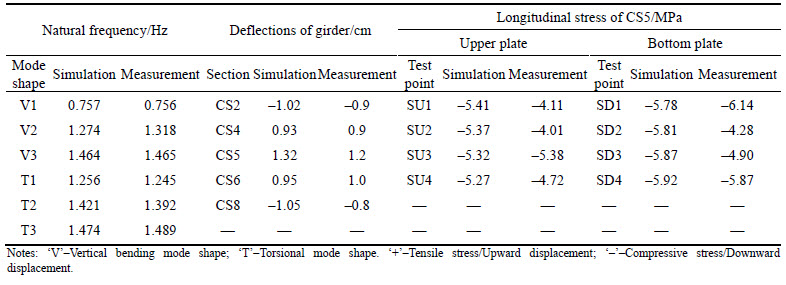
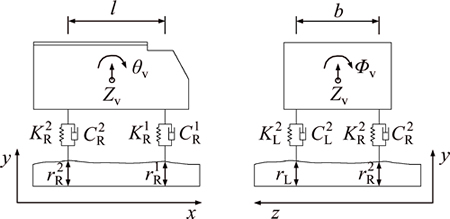
Fig. 7 Simplified vehicle model
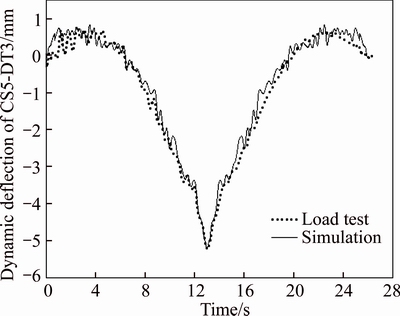
Fig. 8 Comparison between simulated and measured dynamic deflections
5 Results of static test
5.1 Global deformation
The measured and simulated vertical deflections of the DB3 measuring point of each CS-section under the condition S5 and E5 are shown in Fig. 9(a), and the both maximum values are located in the CS5 section, which is �C0.035 m and �C0.025 m, respectively. The transverse distributions of deflections along the CS5 section are shown in Fig. 9(b) and the deflections change as a ��V�� shape under S5 condition, which reflect the excellent symmetry and stiffness of the bridge. The measured deflections of the upstream and downstream side are �C0.014 and �C0.037 m, respectively under E5 condition and the torsional deformation is very obvious, which reflects that the torsional rigidity of the wide girder decreases due to the super width. The reliability of the finite element model is verified through the anastomosis between the simulation and measurement, and the global static behaviors of Hunan Road Bridge can be accurately grasped assisted by the simulation model.
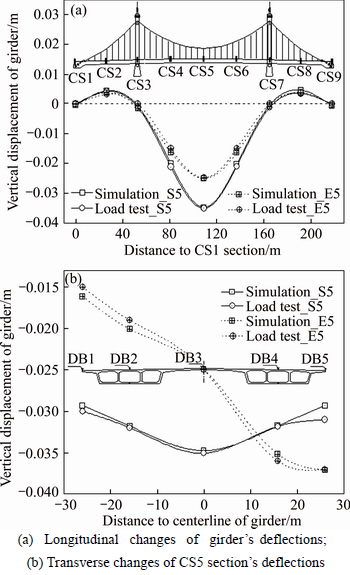
Fig. 9 Measured and simulated deflections of girder under S5 and E5 conditions:
The measured and simulated vertical deflections under the S2 and E2 condition are shown in Fig. 10(a) and the maximum values are located in CS2-DB3, which are �C0.012 m and �C0.007 m, respectively. The transverse distributions of deflections along the CS2 section are shown in Fig. 10(b) and the deflections also change as a ��V�� shape, yet the torsional deformations of the side span under E2 condition are weakened compared with the E5 condition due to the smaller span and different boundary conditions.
The measured displacements of the tops of east and west towers are relatively symmetrical under vehicle loads, the maximum value of the longitudinal and transverse displacements were 0.012 m and 0.015 m, respectively, and the transverse displacements are more obvious than the longitudinal ones, which had reached to 0.025 m at the end of construction due to the transverse deviation between the designed hanging positions and the shear centers of girder, and therefore the health monitoring for the stress state of the towers with only one transverse connection is worthy of attention during the operation period, especially for the extra-wide self-anchored suspension bridge such as Hunan Road Bridge.
5.2 Transverse distributions of girder��s stress increments
The uneven transverse distributions of the longitudinal compressive stress increments of the roof and floor of CS5 and CS2 section under the symmetrical and eccentric vehicle loads are shown in Figs. 11(a)�C(d), respectively. The stress increments of the upper plate change as an ��M�� shape under the S5 and S2 conditions, and the maximum values are located in the junctions with the inner webs, the spatial effects of the stress state under E5 and E2 conditions are also very obvious, firstly, the shear lag effect makes the stress increments of the cantilevered segments of the roof, which are relatively far away from the webs, smaller than the segments near the webs. Secondly, the cross slope of the roof makes the distances of the segments near the centerline of girder to the neutral axis of girder section farther than the other parts, and consequently the stress increments are bigger. Furthermore, the significant local effects of the wheels make the stress increments of the positions, which are directly affected by wheels, bigger than the other parts obviously under the eccentric vehicle loads. As for the bottom plate, although there are no direct actions from vehicles, the shear lag effect and the local effects of wheels are also quite obvious because of the force transmission by the webs.
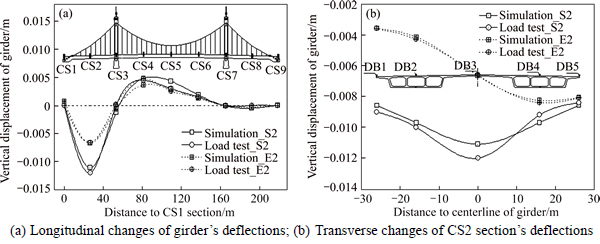
Fig. 10 Measured and simulated deflections of girder under S2 and E2 conditions:
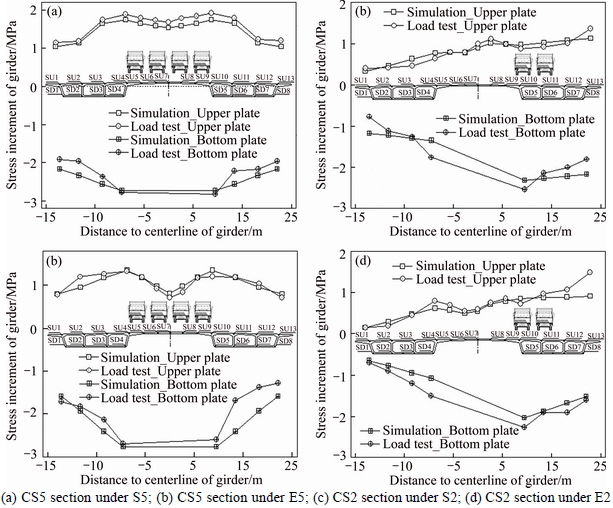
Fig. 11 Transverse distributions of stress increments of girder��s roof and floor:
The stress reserves of the upper and bottom plate under the test vehicle loads equivalent to the designed level well meet the provisions in Chinese codes, and considering the downward deflections of girder and the compressive stress loss of bottom plate caused by the overweight vehicles and the shrink and creep effect of concrete material during the operation period, the degree of demold should be appropriately improved by increasing the tensile forces at the end of system transformation in order to increase the compressive stress reserves of the bottom plate, while the precondition is to ensure that the compressive stress of the upper plate is within a reasonable range.
5.3 Internal force increments of hangers
The internal force increments of partial hangers under the S5 and E5 conditions were measured using the artificial excitation vibration method due to the relatively unfavorable stress states of the cable system under these conditions, and the measured and simulated results are shown in Figs. 12(a) and (b), respectively.
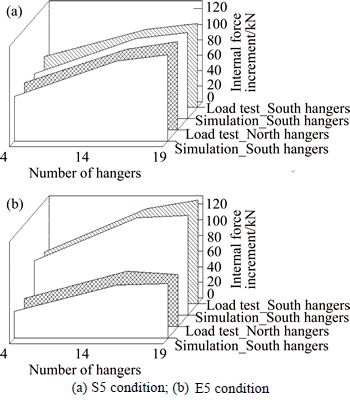
Fig. 12 Measured and simulated internal force increments of partial hangers under S5 and E5 conditions:
The force increments distribute evenly between the north and south cable plane under S5 condition, but the force increments of the south hangers under the direct action of E5 are significantly higher than those of the north ones, which indicates that the spatial effect of the extra-wide girder makes the inhomogeneity of the stress states between the two cable planes more obvious simultaneously. In addition, the influence degree caused by the dead load is much greater than the live load, and the latter has a maximum proportion of 3.9% of the total internal force of each hanger.
6 Results of dynamic test
6.1 Identification of damping ratio
In the most previous cases, the values of structural damping ratio ��, which represent the capacity of bridge to dissipate the vehicle-bridge vibration, were approximately taken as the empirical values. For instance, as for a simple structure such as the concrete continuous beam bridge, the value of �� can be taken between 0.03 and 0.08. However, the value of �� of a complicated bridge, such as the self-anchored suspension bridge, should be actually measured through the field test. The commonly used methods for the identification of the damping ratio include the logarithmic decrement method and the half-power bandwidth method, which are schematically shown in Fig. 13.
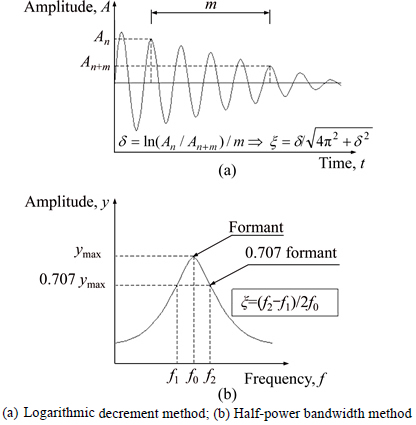
Fig. 13 Common identification methods of ��:
In addition, the measured vibration responses obtained by the dynamic test are composed by multiple models, yet the logarithmic decrement method is only suitable for the system of single freedom degree, whose vibration response is composed by single model. For this, the amplitude-frequency curves were obtained firstly by conducting the Fourier transform based on the measured vibration time-domain signals and the frequency bands were selected depending on the frequencies corresponding to the desired model orders, then the vibration curves only composed by the desired model order were obtained by conducting the band-pass filter against the measured vibration signals, finally the values of �� of the corresponding orders were identified using the logarithmic decrement method shown in Fig. 13(a).
Furthermore, the measured aftershock attenuation curves obtained through the driving test were adopted to identify the values of �� [19]. Firstly, several chunked vibration time-domain data were intercepted from the measured free vibration attenuation curves with an interval of ��T, then the respective amplitude-frequency curves were obtained by conducting the Fourier transform based on each data block, and the values of �� were calculated according to the schematic shown in Fig. 14.
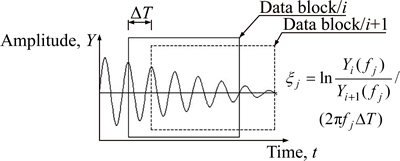
Fig. 14 Chunked truncation method
Wherein the Yi(fj) and Yi+1(fj) were the respective vibration amplitude of the two adjacent data blocks i and i+1 corresponding to the frequency fj.
The identified results of the vertical bending and torsional frequencies of the first order, the corresponding damping ratio �� and Rayleigh damping are shown in Table 3, which are identified by the damped model simulation analysis and the above identification methods based on the measured vibration signals obtained through the driving test using two 30 t trucks with a speed of 30 km/h.
As shown in Table 3, the results of the half-power bandwidth method and the logarithmic decrement method are in good agreement with the simulated results, yet the results of the chunked truncation method have larger errors, the reason is that the relatively larger damp makes the Hunan Road Bridge have a strong ability to dissipate the energy, and the free vibration can attenuate rapidly after the excitation of vehicles, which results in a shorter length of the measured signal and less points in the time-domain curves of the each data block, and therefore the chunked truncation method is suitable for the damping identification of the bridges with relatively smaller ��.
6.2 Natural vibration characteristics
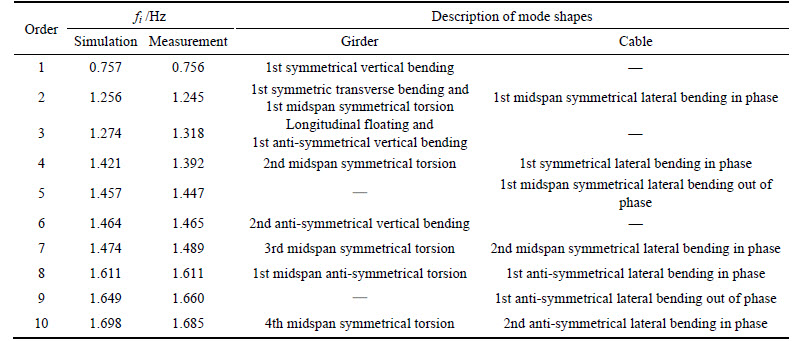
As for the natural frequencies and mode shapes of the first ten orders, the comparisons between the measured and simulated results are shown in Table 4, the simulated results were obtained by conducting the damped model analysis after inputting the measured Rayleigh damping, and the good coincidences indicate that the simulation models can accurately reflect the vibration characteristics of Hunan Road Bridge. The frequencies of the first ten orders are relatively intensive, and the mode shapes perform as the transverse bending and anti-symmetric torsion modes of the girder appear earlier, and there are relatively more coupled mode shapes of the transverse bending of the cable planes and torsion of the midspan girder, which reflect that the weakened torsional rigidity of the extra-wide girder, and the lower frequency ambient excitations can stimulate many torsional modes.
Table 3 Results of each identification method of ��
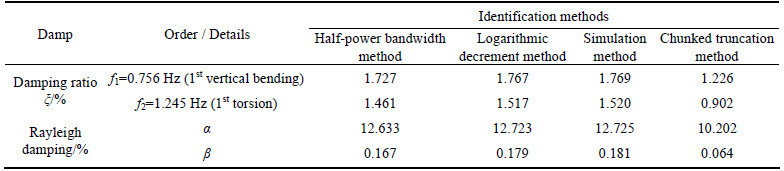
Table 4 Natural frequencies and mode shapes
6.3 Analysis of DIC
6.3.1 Calculation of DIC
Based on the absolute maximum value (��dmax) in the dynamic deflection curve and the absolute maximum static deflection (��smax) under the corresponding static vehicle loads, the dynamic impact coefficient (DIC) brought by the moving vehicle loads were calculated according to the schematic shown in Fig. 15,
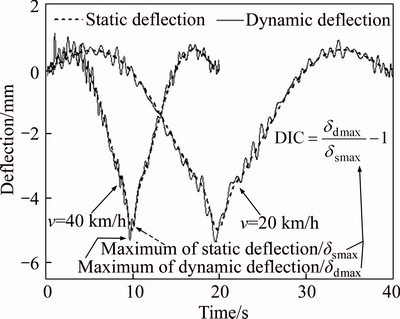
Fig. 15 Calculation schematic of DIC
6.3.2 Influences brought by speed and weight of vehicle
The measured and simulated values of the DIC of CS5-DT3 during the symmetrical and eccentric travel are shown in Figs. 16(a) and (b), respectively. The specific conditions were driving each two trucks with three kinds of mass and five kinds of constant speed through the deck, and the value of 0.05 was obtained according to the calculating methods in Chinese JTG D60�C2004 code [20]. As we can see from Fig. 16(a), the influences on DIC brought by the vehicles�� speed change with the different weights during the symmetrical travel, and the critical speed values corresponding to the extreme DIC value of each vehicle group are slightly different. As for the relatively light vehicles (15 t), the critical speed is 40 km/h and the DIC undulates along with the changes of speed. As for the relatively heavy vehicles (30 t, 45 t), the critical speed value is 30 km/h, and after exceeding this threshold, the DIC begins to decrease. On the other hand, the influences brought by vehicles�� weights also change with the speed, which performs as the DIC increase along with the increase in mass at the lower speed (30 km/h), and decrease at the higher speed(60 km/h). In summary, the general trend is that the heavier and faster the vehicles, the smaller the DIC values, the reason is that the vehicles�� static effect plays a major role due to the shorter coupled vibration duration. The influence laws during the eccentric travel are the same as previously described according to Fig. 16(b), but the values of DIC are smaller, which is caused by the spatial effect of the extra-wide girder, namely the farther distances from the vehicle load positions to the centerline of girder result in the decreases in DIC.
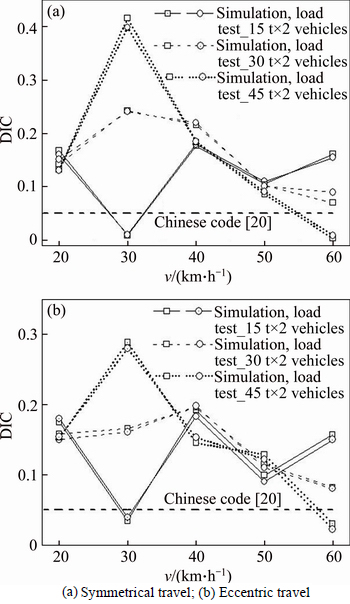
Fig. 16 Measured and simulated values of CS5-DT3��s DIC:
6.3.3 Influences brought by suspension stiffness and damp
The simulated results of the changes of CS5-DT3��s DIC along with the different changing multiples of the vehicles�� stiffness and damp during the symmetrical travel are shown in Figs. 17(a)�C(f), respectively. The influences brought by the stiffness also change with the different vehicle speeds, which perform as the DIC decreases with the increase in stiffness at lower speed (20�C30 km/h), and increase at higher speed (40�C60 km/h). However, as for the influences brought by the damp, the laws of different conditions are consistent, and the general trend is that the DIC decreases with the increase in damp, namely the impact effect on the bridge is weakened due to the excellent vehicle suspension damp. According to the comparison between Figs. 17(c) and (f), the influence degree caused by the stiffness is higher than the damp under the same changes multiples, for that the changes of damp only affect the dissipation capability of vehicles against the vehicle-bridge vibration, while the changes of stiffness, which has a larger radix, will affect the vehicles�� displacement Zv shown in the kinetic Eq. (1), and thereby generate a greater impact on the coupled force Pv at the contact points, thus the DIC is more sensitive to it.
6.3.4 Influences brought by road roughness
The simulated results of the changes of CS5-DT3��s DIC along with the different road roughness, which was great, middle and poor respectively during the symmetric driving, are shown in Fig. 18. The upper limit of the three roughness curves was 0.002, 0.015 and 0.03 m, respectively, and the lower limit was �C0.001, �C0.02 and �C0.04 m. As we can see from Fig. 18, the values of DIC increase with the deterioration of road roughness, and the trend becomes more obvious with the increase in vehicles�� weight. According to the comparison between the above parameters, the increase in road roughness is the main influential factor of the increase in DIC.
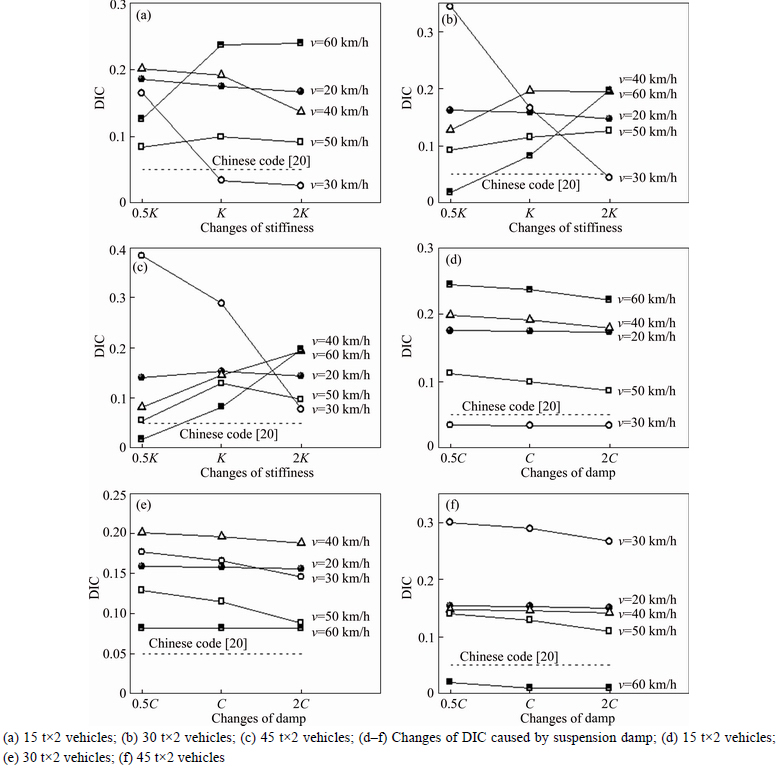
Fig. 17 Influences on CS5-DT3��s DIC brought by vehicles�� suspension systems: (a�Cc) Changes of DIC caused by suspension stiffness;
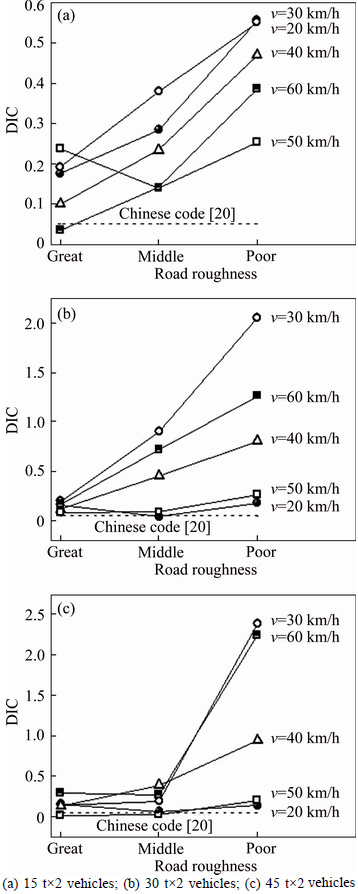
Fig. 18 Influences on CS5-DT3��s DIC brought by road roughness:
6.3.5 Transverse distributions of DIC
The simulated results of DIC��s distributions along the transverse direction of CS5 section under various conditions during the symmetrical and eccentric travel are shown in Figs. 19(a)�C(f), respectively. The values of DIC distribute symmetrically along the centerline of girder and change significantly during the symmetrical travel, which reflect the girder��s obvious spatial effect once again. As for the eccentric travel, the values of DIC in the vehicle-running side (DT1�C2 side) are significantly smaller than that of the vehicle-free side (DT4�C5 side), namely the static effect of the heavy trucks can limit the girder��s dynamic deflection responses in the vehicle-running side, and this law is in accordance with the actual phenomenon that the vibration sensation in the vehicle- free side is turned out to be significantly stronger than the vehicle-running side.
7 Conclusions
1) The spatial effect of the extra-wide girder is obvious, which performs as the deflections under the vehicle loads change obviously along the transverse direction of the analysis control sections, and the girder deflection changes as a ��V�� shape under the symmetrical vehicle loads, the torsional deformation is very obvious under the eccentric loads, which reflects that the torsional rigidity of girder has been weakened affected by the width. The transverse displacements of towers are relatively more obvious, and therefore the health monitoring of the stress state of the towers�� roots is worthy of attention.
2) The longitudinal compressive stresses of the girder��s roof and floor distribute unevenly along the transverse direction affected by the shear lag effect, cross slope and local effects of the wheels, the maximum of stress increments are located in the junction with inner webs, and the stress increment of the upper plate changes as an ��M�� shape under the symmetrical loads. The inhomogeneity of the hanger internal force between the two cable planes will become more obvious during the unidirectional traffic jams and commuting peaks due to the surging spatial effect caused by the eccentric vehicle loads.
3) The chunked truncation method is suitable for the damp identification of the bridge with a relative smaller damp. Affected by the weakened torsional rigidity of the extra-wide girder, the mode shapes such as the transverse bending and anti-symmetric torsion of girder appear earlier and there are many coupled mode shapes composed of the transverse bending of cable plane and torsion of midspan girder.
4) As for the influences on DIC, the general trend is that the heavier and faster the vehicles are, the smaller the DIC values are. The influence degree caused by stiffness��s changes is higher than that caused by damp. The static effects of vehicles in the vehicle-running side can significantly limit the dynamic deflection responses of the girder of vehicle-running side during the eccentric travel. The increase in road roughness is the dominant influential factor of the increase in DIC, and the regulations about DIC in Chinese 04 code for the special self-anchored suspension bridges such as the extra-wide Hunan Road Bridge are relatively broad and unconservative. The shear lag coefficients of extra-wide girder of Hunan Road Bridge will be studied during the future research, as well as the changes of static and dynamic performances during the long-time operation period affected by the concrete shrinkage and creep and temperature changes.
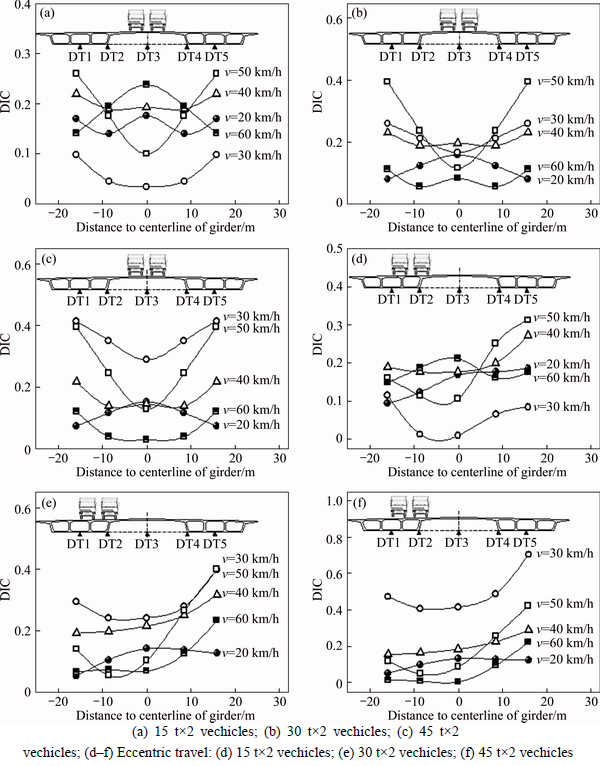
Fig. 19 Transverse distributions of CS5��s DIC (a�Cc) Symmetrical travel:
References
[1] LI Jian-hui, LI Ai-qun. Calculation, monitoring and assessment of spatial cable self-anchored suspension bridges [M]. Beijing: China Communication Press, 2011. (in Chinese)
[2] SUN J, MANZANAREZ R, NADER M. Suspension cable design of the new San Francisco Oakland Bay Bridge [J]. Journal of Bridge Engineering, 2004, 9(1): 101-106.
[3] KIM H K, LEE M J, CHANG S P. Determination of hanger installation procedure for a self-anchored suspension bridge [J]. Engineering Structures, 2006, 28(7): 959-976.
[4] WANG Hao, LI Ai-qun, GUO Tong, ZHAO Geng-wen. Experimental study of the steel box girder force state for a long-span suspension bridge under vehicle loads [J]. Journal of Experimental Mechanics, 2009, 24(1): 27-34. (in Chinese)
[5] LI Xiao-zhen, ZHANG Li-ming, ZHANG Jie. State-of-the-art review and trend of studies on coupling vibration for vehicle and highway bridge system [J]. Engineering Mechanics, 2008(3): 230-240. (in Chinese)
[6] LI Ai-qun, WANG Hao. Stress analysis on steel box girders of super-long-span suspension bridges with sub model method [J]. Engineering Mechanics, 2007, 24(2): 80-84. (in Chinese)
[7] DENG Lu, HE Wei, WANG Fang. Dynamic impact factors for simply supported bridges with different cross-section types [J]. Journal of Vibration and Shock, 2015, 34(14): 70-75. (in Chinese)
[8] WANG Gui-chun, ZHANG Chang-jiu, CHEN Huai. Mechanical analysis for long-span self-anchored suspension bridges [J]. Railway Engineering, 2011(9): 20-23. (in Chinese)
[9] LI Fang-yuan, WU Pei-feng. Dynamic behaviors of pretensioned cable AERORail structure [J]. Journal of Central South University, 2015, 22: 2267-2276.
[10] SONG Xu-ming, DAI Gong-lian, FANG Shu-jun. Total bridge model test of Sanchaji Xiangjiang Bridge [J]. China Journal of Highway and Transport, 2009, 22(1): 53-59. (in Chinese)
[11] HE Jun, LIU Yu-qing, PEI Bing-zhi. Experimental study of the steel-concrete connection in hybrid cable-stayed bridges [J]. Journal of Performance of Constructed Facilities, 2013, 28(3): 559�C570.
[12] ZHANG Jian-ren, PENG Hui, CAI C S. Destructive testing of a decommissioned reinforced concrete bridge [J]. Journal of Bridge Engineering, 2012, 18(6): 564�C569.
[13] YANG Jian-rong, BAI Yu, YANG Xiao-dong, FENG Yun. Dynamic amplification factor measuring of T-girder bridges [J]. Key Engineering Materials, 2013, 540: 29-36.
[14] LI Yuan-bing, ZHANG Qi-wei, JI Yun-feng. Mechanical behavior of kilometer-level cable-stayed bridge under static loads [J]. Journal of Tongji University, 2011, 39(4): 495-500. (in Chinese)
[15] CHOU C C, UANG C M, SEIBLE F. Experimental evaluation of compressive behavior of orthotropic steel plates for the new San Francisco Oakland bay bridge [J]. Journal of Bridge Engineering, 2006, 11(2): 140�C150.
[16] XIANG Yi-qiang, ZHU Lei, Zheng Jiang-min, et al. Analysis and test study of static and dynamic forces of self-anchored suspension bridge [J]. Highway Engineering, 2010, 35(2): 57-61. (in Chinese)
[17] CHEN Run-shui, HU Zhao-fang. Loading test of bridges on high-way [M]. Beijing: China Communications Press, 2003: 10-14. (in Chinese)
[18] LI Chuan-xi. A refined nonlinear analysis method for suspension bridge with hybrid beam and its application [D] .Changsha: Hunan University, 2006: 16�C51. (in Chinese)
[19] WANG Zong-lin, LI Wei-zhao, SHENG Ke-jian. Damping estimation of concrete girder bridge based on damped free vibration under vehicle-running experiment [J]. Journal of Vibration, Measurement & Diagnosis, 2012, 32(3): 414-418. (in Chinese)
[20] JTG D60�C2004, General code for design if highway bridges and culverts [S]. (in Chinese)
(Edited by HE Yun-bin)
Cite this article as: ZHOU Guang-pan, LI Ai-qun, LI Jian-hui, DUAN Mao-jun. Test and numerical investigations on static and dynamic characteristics of extra-wide concrete self-anchored suspension bridge under vehicle loads [J]. Journal of Central South University, 2017, 24(10): 2382�C2395. DOI:https://doi.org/10.1007/s11771-017-3650-2.
Foundation item: Project(51278104) supported by the National Natural Science Foundation of China; Project(2011Y03) supported by Jiangsu Province Transportation Scientific Research Programs, China; Project(20133204120015) supported by the Research Fund for the Doctoral Program of Higher Education of China; Project(12KJB560003) supported by Jiangsu Province Universities Natural Science Foundation, China
Received date: 2015-12-22; Accepted date: 2016-08-01
Corresponding author: LI Ai-qun, Professor, PhD; Tel: +86-25-83794901; E-mail: aiqunli@seu.edu.cn

