Numerical simulation on thermal accumulation of cemented tailings backfill
��Դ�ڿ������ϴ�ѧѧ��(Ӣ�İ�)2021���7��
�������ߣ����� ��С�� ���� ۨ�� SONG KI-IL ��Ľ�� �ĵ�
����ҳ�룺2221 - 2237
Key words��cemented tailings backfill; thermal accumulation; heat conduction; heat convection; total thermal accumulation capacity
Abstract: Based on the collaborative exploitation of deep mineral resources and geothermal resources, the thermal accumulation process of cemented tailings backfill (CTB) was studied by numerical simulation. The effects of thermal accumulation time, slurry proportions and temperature conditions on the thermal accumulation of backfill are analyzed, the influence of the heat conduction between backfill and surrounding rock, the heat convection between backfill and airflow on thermal accumulation were compared simultaneously. The results show that the total thermal accumulation capacity increases by approximately 85% within 10-90 d. The influence of surrounding rock temperature and initial temperature on total thermal accumulation capacity is more significant and it is approximately 2 times of the influence of slurry proportions under the conditions of this study. It is clear that the rise of surrounding rock temperature and the decrease of initial temperature can improve the thermal accumulation capacity more effectively. Moreover, the heat conduction accounts for a considerable proportion in the process of thermal accumulation, the average heat conduction capacity is approximately 25 times of the heat convection capacity. This study can provide the theoretical basis and application reference for the optimization of thermal accumulation process of CTB in the exploitation of geothermal resources.
Cite this article as: ZHANG Xiao-yan, ZHAO Min, LIU Lang, HUAN Chao, SONG KI-IL, XU Mu-yan, WEN De. Numerical simulation on thermal accumulation of cemented tailings backfill [J]. Journal of Central South University, 2021, 28(7): 2221-2237. DOI: https://doi.org/10.1007/s11771-021-4760-4.

J. Cent. South Univ. (2021) 28: 2221-2237
DOI: https://doi.org/10.1007/s11771-021-4760-4

ZHANG Xiao-yan(��С��)1, ZHAO Min(����)1, LIU Lang(����)1, 2,HUAN Chao(ۨ��)1, SONG KI-IL3, XU Mu-yan(��Ľ��)1, WEN De(�ĵ�)1
1. Energy School, Xi��an University of Science and Technology, Xi��an 710054, China;
2. Key Laboratory of Western Mines and Hazards Prevention, Ministry of Education of China,Xi��an 710054, China;
3. Department of Civil Engineering, Inha University, Incheon 402-751, Korea
 Central South University Press and Springer-Verlag GmbH Germany, part of Springer Nature 2021
Abstract: Based on the collaborative exploitation of deep mineral resources and geothermal resources, the thermal accumulation process of cemented tailings backfill (CTB) was studied by numerical simulation. The effects of thermal accumulation time, slurry proportions and temperature conditions on the thermal accumulation of backfill are analyzed, the influence of the heat conduction between backfill and surrounding rock, the heat convection between backfill and airflow on thermal accumulation were compared simultaneously. The results show that the total thermal accumulation capacity increases by approximately 85% within 10-90 d. The influence of surrounding rock temperature and initial temperature on total thermal accumulation capacity is more significant and it is approximately 2 times of the influence of slurry proportions under the conditions of this study. It is clear that the rise of surrounding rock temperature and the decrease of initial temperature can improve the thermal accumulation capacity more effectively. Moreover, the heat conduction accounts for a considerable proportion in the process of thermal accumulation, the average heat conduction capacity is approximately 25 times of the heat convection capacity. This study can provide the theoretical basis and application reference for the optimization of thermal accumulation process of CTB in the exploitation of geothermal resources.
Key words: cemented tailings backfill; thermal accumulation; heat conduction; heat convection; total thermal accumulation capacity
Cite this article as: ZHANG Xiao-yan, ZHAO Min, LIU Lang, HUAN Chao, SONG KI-IL, XU Mu-yan, WEN De. Numerical simulation on thermal accumulation of cemented tailings backfill [J]. Journal of Central South University, 2021, 28(7): 2221-2237. DOI: https://doi.org/10.1007/s11771-021-4760-4.
1 Introduction
The mines store abundant natural resources, over the years, owing to the economic development of the country and the daily needs of the citizens, the available mineral resources and energy substances have been significantly reduced and gradually transferred to the deep exploitation, at the same time, a large number of wastes have been produced accompanied with mining activities and have taken up a lot of ground space for stacking.
Therefore, the realization of deep mining and the conversion of wastes into valuable resources have become the focus of scholars [1, 2]. As one of the main types of solid wastes from mining activities, the comprehensive utilization of tailings has been less than 7% [3], however, the significant amount of space hidden deeply underground provides a favorable condition for storage of wastes. Cemented tailings backfill (CTB) technology not only effectively prevents a surface collapse and provides a safe working environment, but also allows the recycling of mining wastes and avoids the stacking of them, in line with the concept of green development [4-7]. WANG et al [8] and ERCIKDI et al [9] proved that the temperature, density and cement-tailings ratio of a backfill are important factors affecting the filling performance.
With an increase in mining depth, the surrounding rock temperature continuously increases, the problem of heat hazard occurring in a deep mine has thus gradually become a prominent issue and seriously endangers the safe production in the process of mining [10, 11]. However, the high temperature environment of deep mine provides a favorable condition for geothermal exploitation [12, 13]. NIU [14] and GUO et al [15] established a mine cooling and heating system to better realize the use of geothermal recycling. GUO et al [15], RODRIGUEZ et al [16] proved the feasibility of an underground heat exchanger to extract the geothermal energy of a mine and analyzed the heat exchange performance. LIU et al [12] considered the functional backfill of thermal accumulation to realize collaborative exploitation of geothermal energy and mineral resources, and further innovated the technology used in backfill mining. The research on the heat accumulation process of CTB is the premise of geothermal exploitation in mine. However, there are few researches on this aspect.
In the thermal accumulation functional backfill technology, the capacity of geothermal energy exploitation is directly impacted by the thermal accumulation performance of CTB with different thermal physical properties, also is significantly impacted by the temperature of surrounding rock and the initial temperature of CTB for thermal accumulation. The backfill slurry is poured into the goaf and solidifies to form the backfill, the side and bottom of CTB are connected with the surrounding rock and the heat transfer is realized by heat conduction, the top is adjacent to the stope and the heat transfer is realized by heat convection, the thermal accumulation of CTB is an unsteady heat transfer process. AHMAD et al [17] studied the performance change of the backfill heated by the cylindrical heater through experiments, the properties of filling materials under different working conditions were analyzed quantitatively.AL-AMEEN et al [18] compared the temperature distribution and thermal accumulation performance of different filling materials by experiment and numerical simulation. Many scholars did a lot of researches on the similar heat transfer process. KAYACI et al [19], TONG et al [20] and WU et al [21] conducted experiment and numerical simulation on the heat transfer process between the ground heat exchanger and the surrounding soil, and obtained the temperature distribution of soil. ZHANG et al [22] simulated and tested the thermal accumulation process of soil and the seasonal thermal accumulation capacity under heat convection of the sun, and solved the imbalance between partial heat supply and demand in winter and summer. BERNARDES [23] studied the transient heat transfer process of soil through conduction, convection and solar radiation. CHEN et al [24] established a one-dimensional soil thermal accumulation test-bed to study the heat transfer mechanism of soil thermal accumulation in the solar-ground source heat pump system. WANG et al [25] simulated the evolution characteristics of soil temperature with depth in surrounding rock thermal accumulation body in 17 years and pointed out the thermal accumulation and release characteristics of soil. LI et al [26] established a three-dimensional unsteady model of the thermal accumulation process in the soil around the buried heat exchanger and analyzed the thermal accumulation performance of three typical soils. ZHANG et al [27] established a three-dimensional unsteady heat transfer model of backfill and simulated the heat transfer process between heat transfer fluid and surrounding backfill under the different conditions of initial temperature and heat carrying fluid. Therefore, it is necessary to study the change law of thermal accumulation performance for CTB under different influence factors.
Focusing on a realization of the collaborative exploitation of deep mineral resources and geothermal energy, this study takes the backfill with the function of thermal accumulation in underground mines as the research subject and simulates the thermal accumulation process of CTB by using FLUENT. The thermal accumulation performance of CTB is analyzed under different slurry concentrations, cement-tailings ratios, the temperatures of surrounding rock and the initial temperatures of CTB for thermal accumulation (namely the temperature of CTB at the end of thermal release, approximately is the inlet temperature of heat carrying fluid). The results can provide the theoretical guidance for the exploitation of geothermal energy using CTB.
2 Model establishment
The huge empty space formed by the mining of mineral resources is filled with backfill slurry. The slurry solidifies to form a huge cemented tailing backfill, which is placed in a high-temperature environment of underground, and can absorb the heat from the surrounding rock and the airflow in stope by heat conduction and heat convection under the driving of temperature differences causing by heat carrying fluid. The temperature gradually increases to close to the temperature of surrounding rock and the thermal accumulation is accomplished, as shown in Figure 1.
2.1 Basic assumptions
The heat transfer existing in CTB, surrounding rock and the airflow in stope is a complex three-dimensional unsteady heat transfer process. In order to study this complex problem of thermal accumulation and simplify the calculation, the following assumptions are made in the process of thermal accumulation:
1) The thermal conductivity, specific heat capacity and density of CTB do not change with the temperature;
2) The backfill material is isotropic and the initial temperature of CTB in thermal accumulation process is uniform;
3) The temperature of surrounding rock, the temperature and velocity of airflow maintain are constant in the process of thermal accumulation;
4) The third kind of boundary condition is adopted to solve the problem on the boundary between stope region and backfill region;
5) The fluid in heat transfer tube is static in the process of thermal accumulation, and the influence of heat transfer tube and heat carrying fluid on thermal accumulation is ignored;
6) Heat is only transferred into the backfill along the normal direction of the interface between backfill and surrounding rock, and the interface between backfill and airflow in stope.
2.2 Mathematical model
2.2.1 Governing equation
A three-dimensional unsteady heat transfer model of CTB was established in this paper. The differential equation of heat conduction in CTB was expressed as follows:
 (1)
(1)
where l is the thermal conductivity, r is the density and cp is the specific heat at constant pressure of CTB.
2.2.2 Boundary condition
The side and bottom of CTB are connected with surrounding rock, the heat transfer between them is heat conduction. The top of CTB is adjacent to the stope, and the heat transfer between backfill and airflow is heat convection, the airflow temperature was set as 26 ��C and the airflow velocity was set as 2 m/s.
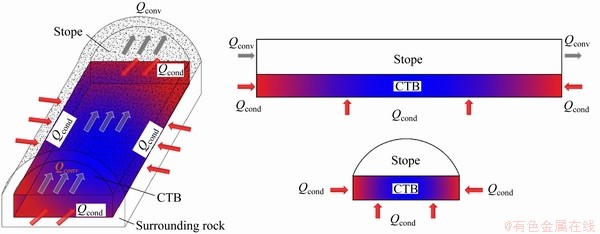
Figure 1 Schematic diagram of thermal accumulation for CTB
Boundary condition of surrounding rock:
 (2)
(2)
Boundary conditions of stope:
 (3)
(3)
where subscript s is the boundary between CTB and surrounding rock, subscript w is the boundary between CTB and stope, Tb is the temperature of surrounding rock, n is the normal direction of w boundary, T0 is the initial temperature of CTB in thermal accumulation process, Ta is the temperature of airflow in stope, h is the surface convective heat transfer coefficient.
2.2.3 Initial condition
At the beginning of thermal accumulation process, the temperature of CTB is the initial temperature.
 (4)
(4)
where Tbf is the temperature of CTB.
2.2.4 Physical parameters and variables
The paper is aimed at the thermal accumulation of CTB, on the one hand, the thermal physical parameters such as thermal conductivity, and specific heat capacity are changed by different slurry concentrations and cement-to-tailing ratios (mass), which has a significant effect on the thermal accumulation process of CTB. The thermal physical parameters affecting the thermal accumulation of backfill are shown in Table 1. On the other hand, when the conditions of airflow are set, the temperature of surrounding rock and the initial temperature of CTB also have an important impact on thermal accumulation process. The surrounding rock temperature of 35, 40 and 45 ��C, and the initial temperature of 15, 18 and 21 ��C are adopted in this study.
2.3 Geometric model and meshing
As shown in Figure 2, a three-dimensional geometric model established in the integrated computer engineering and manufacturing code is a regular cuboid (15 m��3 m��100 m). The structural grid is adopted and the high-quality grid that meets the calculation requirement is obtained. In this three-dimensional unsteady thermal accumulation process, the internal temperature of CTB can present heat transfer characteristics, therefore, the most representative temperature measuring points are selected, as shown in Figure 3. Figure 3(a) shows the distribution of measuring points on the section of z=50 m with the coordinates of A (7.5, 0.5),B (7.5, 1), C (7.5, 1.5), D (7.5, 2) and E (7.5, 2.5).Figure 3(b) shows the distribution of measuring points on the section of x=7.5 m with the coordinates of F (1, 1.5), G (2, 1.5), H (3, 1.5), I (4, 1.5) and J (5, 1.5).
2.4 Grid independence analysis
In order to obtain the highest calculation accuracy in the shortest calculation time, the quadrilateral structure grid with the grid sizes of 0.15, 0.20, 0.25, 0.30 and 0.35 m was selected for simulation and the corresponding grid numbers were 1334000, 562500, 288000, 167000 and 110682. As shown in Figure 4, the temperature change of point c in the center of CTB with time was taken as the reference. It can be concluded that the grid is regular quadrilateral and thus the influence of grid number on the calculation accuracy is not significant. The correlation coefficients of the curves with the grid sizes of 0.20, 0.25, 0.30 and 0.35 m were 0.99998546, 0.99997655, 0.99995952 and 0.9999148, respectively, compared to that of the 0.15 m grid size. The analysis shows that the calculation requirements have been met when the grid size is 0.20 m (the grid number is 562500).
Table 1 Thermal physical parameters of CTB [28-30]
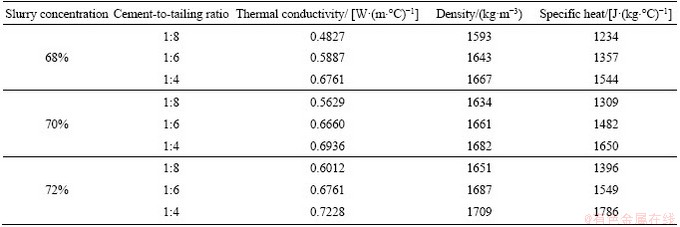
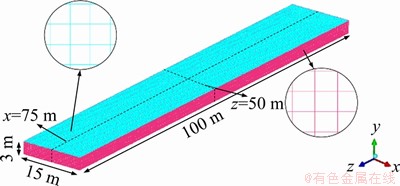
Figure 2 Geometry model and mesh generation of CTB
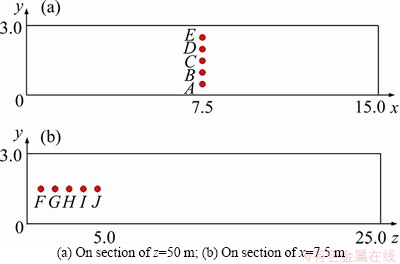
Figure 3 Distribution of temperature measuring points in CTB:
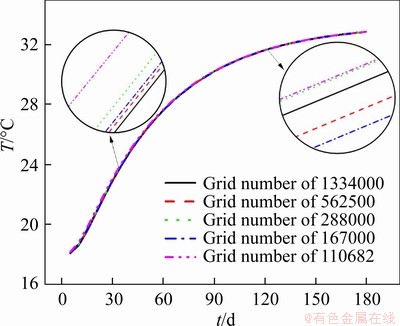
Figure 4 Analysis on influence of different grid numbers on calculation results
2.5 Parameters and solution settings
This paper mainly studies the change rule of thermal accumulation with time for CTB, thus the time characteristic is transient and the velocity characteristic is absolute. It is necessary to open the energy equation because of the heat transfer in thermal accumulation process, and it is necessary to open the k-e turbulence model because of the airflow in stope is turbulent. The global initialization is used for calculation and the relaxation factor remains the default value. Owing to the simulation on thermal accumulation of 180 d, the time step is set as 1200 s.
2.6 Model verification
In order to verify the rationality of the simulation, the temperature changes of the CTB are compared in the heating process. As shown in Figure 5, the test block of CTB (38 cm��12 cm��50 cm) used in the experiment has embedded copper tubes and thermocouples. Tailings and cement were used as aggregate to prepare filling slurry, in which the slurry concentration was 70% and the cement-to-tailing ratio was 1:4. After the filling slurry was cured, it was taken out and placed in the simulation box with heating plates at the bottom and sides. The temperature of surrounding rock simulated by heating plates was 35 ��C. The initial temperature of heat storage of CTB was 20 ��C and this temperature was realized by passing low-temperature water in water tank into embedded copper pipes.
Taking the central point of CTB as the research object, the temperature value of experimental test is compared with the simulation result. Figure 6 shows that the temperature values of the measured points are generally lower than the simulation results, and the error is 8.4%, which is within the acceptable range. The main reasons for the error are the heat-to- dissipation of the specimen and the contact thermal resistance between the specimen and the heating plates.
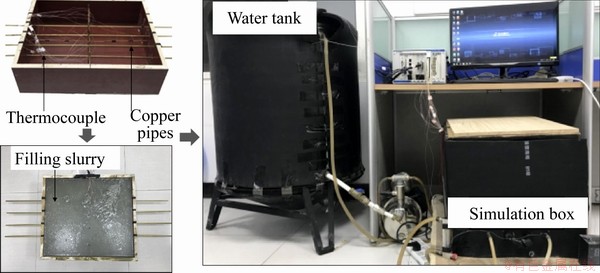
Figure 5 Heat storage experiment of CTB
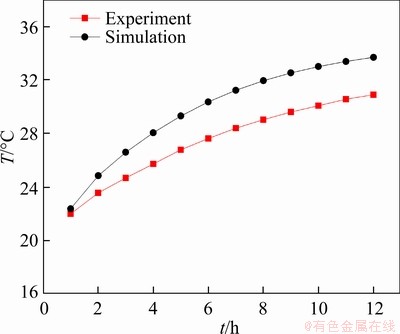
Figure 6 Comparison between experiment and simulation of central point temperature in CTB
3 Simulation results and analysis
3.1 Effect of time on thermal accumulation of CTB
As a slurry concentration of 72%, cement-to-tailing ratio of 1:4, surrounding rock temperature of 40 ��C and initial temperature of 18 ��C, the influence of time on the thermal accumulation of CTB was analyzed.
As shown in Figure 7, the temperature distribution cloud chart of CTB on the section of z=50 m is recorded. It can be seen that the temperature of backfill rises with the proceeding of thermal accumulation. On this section, the average temperature rises from 18.0 to 32.4 ��C within 0-90 d, rises from 32.4 to 33.9 ��C within 90-180 d, and the temperature increment is 14.4 and 1.5 ��C, successively. It is thus clear that the thermal accumulation of backfill mainly occurs within 0-90 d while the rate of thermal accumulation decreases significantly within 90-180 d.
Figure 8 shows the variation in temperature with time at different measuring points in CTB. Figure 8(a) shows that the temperatures of measuring points A-E rise rapidly within 5-60 d, slowly within 65-120 d, and without a clear change within 125-180 d. For example, at measuring point A, the temperature rises from 23.8 to 35.0 ��C within 5-60 d, from 35.3 to 37.0 ��C within 65-120 d and from 37.0 to 37.6 ��C within 125-180 d, the temperature increment is 11.2, 1.7 and 0.6 ��C, successively. This is mainly because, within the initial stage of thermal accumulation, the temperature of backfill is lower and the temperature difference between backfill and surrounding rock, between backfill and airflow is larger, so the thermal accumulation rate is faster. With the proceeding of thermal accumulation, the temperature of backfill gradually rises, the heat transfer temperature difference decreases and the thermal accumulation rate gradually slows down. It is also shown in Figure 8(a) that the temperatures of measuring points A-E decrease successively as a whole, the average temperatures of measuring points A-E are 37.1, 34.3, 31.9, 29.8 and 28.0 ��C, respectively. This is because that the temperature of backfill is significantly affected by the heat conduction of surrounding rock in longitudinal direction, the measuring points A-E are from near to far from the surrounding rock of backfill bottom, so the temperature decreases in turn. However, the temperatures of measuring points E and D are higher than that of point C or even B within 0-45 d. This is because that measuring points E and D are close to the stope, the temperature difference between backfill and airflow is larger and the backfill also absorbs heat from airflow in the early stage of thermal accumulation, afterwards the temperature of backfill gradually approaches that of airflow and the heat absorption mainly comes from surrounding rock.
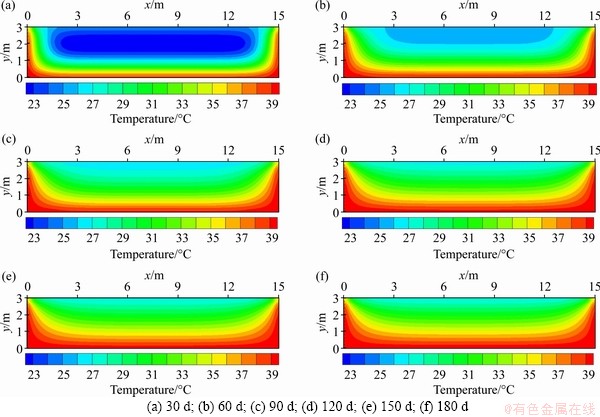
Figure 7 Cloud chart of temperature distribution of backfill on section of z=50 m:
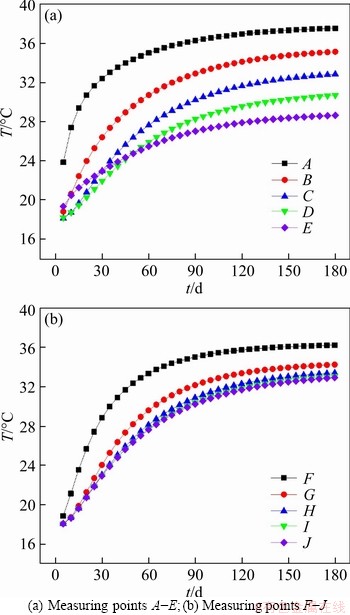
Figure 8 Variation in temperature with time at different measuring points in backfill:
Figure 8(b) shows that the temperatures of measuring points F-J decrease successively, the average temperatures of measuring points F-J are 35.8, 33.6, 32.5, 32.1 and 32.0 ��C, respectively. This is mainly owing to the fact that the temperature of backfill is significantly affected by the heat conduction of surrounding rock in horizontal direction, the measuring points F-J are from near to far from the surrounding rock of backfill side, so the temperature decreases in turn. It also can be seen that the temperatures of measuring points I and J are similar, thus, the influence range of the temperature of surrounding rock along the z-axis is approximately 4 m from the side, at the range from 4 to 50 m on z-axis, the heat inside backfill is mainly provided by heat conduction along the y-axis.
Figure 9 shows the changes of the heat transfer rate and thermal accumulation capacity of CTB with time. It can be seen from Figure 9(a) that the heat conduction rate gradually decreases and tends to become stable with thermal accumulation time, it decreases by 27.62, 3.40 and 0.88 kW respectively within 10-60, 70-120 and 130-180 d, and decreases by approximately 92% within 10-90 d. With an increase of thermal accumulation time, the heat convective rate gradually decreases to zero, then increases reversely and finally tends to be stable, it decreases by 5.78 kW within 10-30 d, while increases reversely by 6.27 kW within 40-120 d and only by 0.75 kW within 130-180 d. In addition, Figure 9(a) also shows that the total heat transfer rate (i.e., the sum of the heat conduction rate and the heat convection rate) decreases and tends to become stable with an increase of thermal accumulation time,it decreases by 37.67, 6.10 and 1.63 kW within 10-60, 70-120 and 130-180 d respectively and decreases by approximately 90% within 10-90 d. This is mainly due to the fact that the lower the temperature of backfill, the larger the temperature difference between backfill and surrounding rock, and between backfill and airflow within the initial stage of thermal accumulation, so the heat conduction rate and heat convection rate both are larger. With the proceeding of thermal accumulation, the temperature of backfill rises gradually and the heat transfer temperature difference decreases, the heat conduction rate and heat convection rate decrease gradually and tend to become stable. The negative value of heat convection rate is due to that the airflow begins to carry away the heat stored in backfill when the temperature of backfill is higher than that of airflow, the temperature of backfill rises with thermal accumulation, the temperature difference between backfill and airflow increases, and the heat convection rate for heat release also increases.
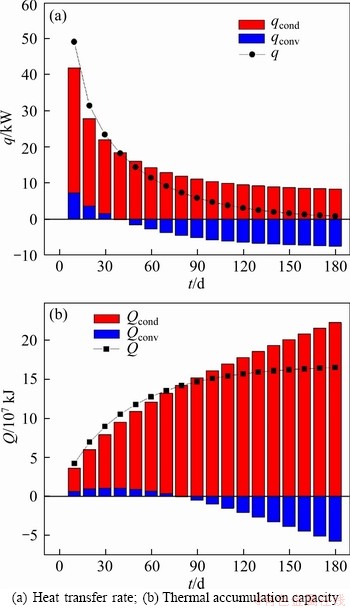
Figure 9 Variation in heat transfer rate and thermal accumulation capacity with time:
Figure 9(b) shows that the heat conduction capacity increases with thermal accumulation time and it is 12.81��107, 15.75��107 and 16.56��107 kJ at 60, 120 and 180 d, respectively. The average heat convection capacity is 0.81��107 kJ within 10-70 d, and it increases reversely with an increase of 5.72��107 kJ within 80-180 d. In addition, the total thermal accumulation capacity (i.e., the sum of the heat conduction and heat convection capacities) gradually increases with time, and finally tends to become stable, it increases by 8.55��107, 2.15��107 and 0.59��107 kJ within 10-60, 70-120 and 130-180 d respectively and increases by approximately 85% within 10-90 d. This is mainly due to the influence of the temperature difference between backfill and surrounding rock, the temperature of surrounding rock is always higher than that of backfill, so the heat conduction capacity increases. Similarly, the heat convection capacity is also affected by the temperature difference between backfill and airflow. In the early stage, the temperature of airflow is higher than that of backfill, the heat convection capacity is positive and continues increasing. With the proceeding of thermal accumulation, the temperature of backfill gradually rises and is higher than that of airflow, so the heat convection capacity gradually decreases and becomes a negative value, the heat loss occurs. The temperature of backfill rises with thermal accumulation, and the higher the temperature difference between backfill and airflow, the greater the heat carried away by airflow.
Figure 9 also shows that the contribution of heat conduction rate and heat conduction capacity on the thermal accumulation of backfill is much higher than that of heat convection rate and heat convection capacity. That is, the influence of surrounding rock is far greater than that of airflow during thermal accumulation. Moreover, owing to the reverse effect of two types of heat transfer, the backfill gradually tends to dynamic heat transfer equilibrium within 120-180 d, the total heat transfer rate and total thermal accumulation capacity also tend to be stable, namely the thermal accumulation process is completed.
3.2 Effect of slurry concentration on thermal accumulation of CTB
Figure 10 shows the variation of thermal accumulation parameters with time under different slurry concentrations for CTB. Figure 10(a) shows the temperature of the central point in backfill slightly decreases with an increase of slurry concentration. When slurry concentration increases from 68% to 72%, the temperature of the central point decreases from 28.4 to 27.7 ��C, from 32.0 to 31.6 ��C and from 33.0 to 32.9 ��C, respectively at 60, 120 and 180 d, the decrement is 0.7, 0.4 and 0.1 ��C, successively, and the decrease is more obvious within 30-120 d with an average decrement of 0.6 ��C. This is mainly because that the higher the slurry concentration, the greater the specific heat capacity and density, the more heat can be accumulated for a certain volume of backfill, so the slower the rise of the temperature of the central point.
Figure 10(b) shows that the heat conduction rate increases with an increase of slurry concentration, and the increment gradually decreases with thermal accumulation time. When slurry concentration increases from 68% to 72%, the increment of heat conduction rate is 2.60, 0.94 and 0.61 kW, respectively at 30, 120 and 180 d. With an increase of slurry concentration, the heat convection rate also shows the different laws during different periods of thermal accumulation and the average variation is 0.36 kW. Moreover, the total heat transfer rate increases with an increase of slurry concentration,the increment decreases with thermal accumulation time and it is 3.29, 0.93 and 0.34 kW, respectively at 30, 120 and 180 d for slurry concentration from 68% to 72%. This is mainly because the higher the slurry concentration, the greater the thermal conductivity, so the faster the heat transfer. The heat conduction rate and heat convection rate increase at the same direction in the early stage and increase reversely in the later stage with an increase of slurry concentration, so the increment of total heat transfer rate gradually decreases with thermal accumulation time.
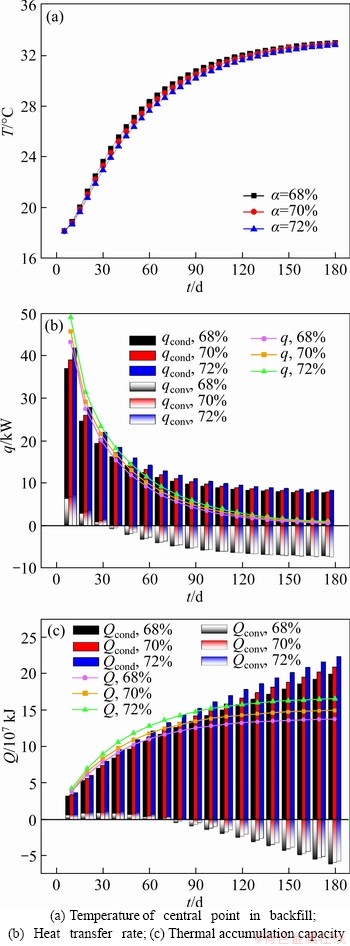
Figure 10 Variation of thermal accumulation parameters with time under different slurry concentrations (Cement-tailings ratio of 1:4, surrounding rock temperature of 40 ��C and initial temperature of 18 ��C):
Figure 10(c) shows the heat conduction capacity increases with an increase of slurry concentration, the increment increases with thermal accumulation time. When slurry concentration increases from 68% to 72%, the increment of heat conduction capacity is 0.92��107, 2.06��107 and 2.43��107 kJ, respectively at 30, 120 and 180 d. The heat convection capacity increases within the initial 70 d and decreases reversely after 70 d of thermal accumulation with an increase of slurry concentration. When slurry concentration increases from 68% to 72%, the average increment is 0.26�� 107 kJ within the initial 70 d and the average decrement is 0.44��107 kJ after 70 d. Moreover, the total thermal accumulation capacity increases with an increase of slurry concentration, the increment increases with thermal accumulation time and finally tends to become stable. When slurry concentration increases from 68% to 72%, the increment of total thermal accumulation capacity is 1.13��107, 2.53��107 and 2.81��107 kJ, respectively at 30, 120 and 180 d. This is mainly because the higher the slurry concentration, the greater the specific heat capacity and density, so the more the heat stored in a certain volume of backfill, and with the extension of thermal accumulation time, the more significant the difference of thermal accumulation capacity. Moreover, a heat loss of backfill occurs during heat convection after 70 d, and the temperature difference between backfill and airflow decreases with an increase of slurry concentration, so the heat loss of backfill also decreases, this is also favorable for thermal accumulation.
3.3 Effect of cement-tailings ratio on thermal accumulation of CTB
Figure 11 shows the variation of thermal accumulation parameters with time under different cement-to-tailing ratios for CTB. Figure 11(a) shows the temperature of the central point in backfill slightly rises with a decrease of cement-to-tailing ratio. When cement-to-tailing ratio decreases from 1:4 to 1:8, the temperature of the central point rises from 27.7 to 28.3 ��C, from 31.6 to 32.0 ��C and from 32.9 to 33.0 ��C, respectively at 60, 120 and 180 d, the increment is 0.6, 0.4 and 0.1 ��C, successively, and the rise also is more obvious within 30-120 d with an average increment of 0.6 ��C. This is mainly because the smaller the cement-to-tailing ratio, the smaller the specific heat capacity and and density, the less heat can be accumulated for a certain volume of backfill, so the faster the rise of the temperature of the central point.
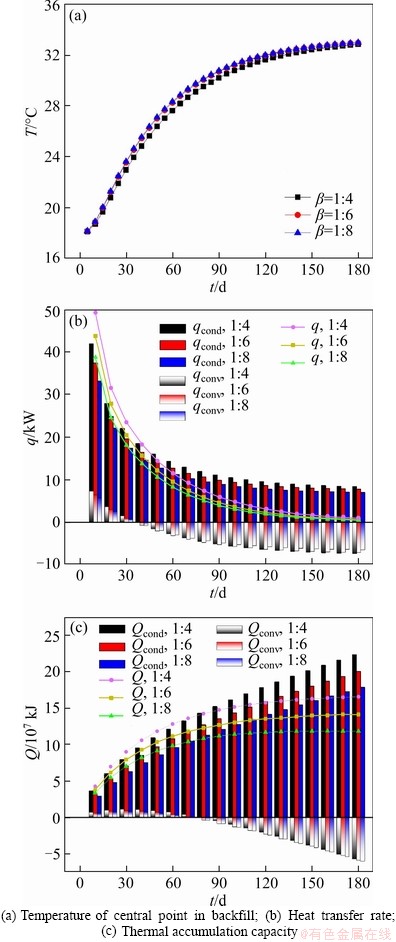
Figure 11 Variation of thermal accumulation parameters with time under different cement-to-tailings ratios (Slurry concentration of 72%, surrounding rock temperature of 40 ��C and initial temperature of 18 ��C):
Figure 11(b) shows the heat conduction rate decreases with a decrease of cement-to-tailings ratio, and the decrement gradually decreases with thermal accumulation time. When cement-to-tailings ratio decreases from 1:4 to 1:8, the decrement of heat conduction rate is 4.61, 1.78 and 1.36 kW respectively at 30, 120 and 180 d. With a decrease of cement-to-tailings ratio, the heat convection rate tends to decrease in general, however, it is slightly different and shows a transitional state within 40-110 d. When cement-to-tailings ratio decreases from 1:4 to 1:8, the average decrement of heat convection rate is 1.21 kW and the decrement decreases with thermal accumulation time within the initial 30 d, while the heat convection rate decreases in reverse direction with an average decrement of 0.81 kW and the decrement increases with thermal accumulation time within 120-180 d. Moreover, the total heat transfer rate also decreases with a decrease of cement-to-tailings ratio and the decrement decreases with thermal accumulation time. When cement-to-tailings ratio decreases from 1:4 to 1:8, the decrement of total heat transfer rate is 5.46, 1.17 and 0.40 kW, respectively at 30, 120 and 180 d. The decrease of heat transfer rate is also caused by the decrease of thermal conductivity caused by decreasing cement-tailings ratio. The heat conduction rate and heat convection rate decrease at the same direction in the early stage and decrease reversely in the later stage with an decrease of cement-to-tailings ratio, so the increment of total heat transfer rate gradually decreases with thermal accumulation time.
Figure 12(c) shows the heat conduction capacity obviously decreases with a decrease of cement-to-tailings ratio and the decrement obviously increases with thermal accumulation time. When cement-to-tailings ratio decreases from 1:4 to 1:8, the decrement of heat conduction capacity is 1.66��107, 3.68��107 and 4.45��107 kJ, respectively at 30, 120 and 180 d.
The heat convection capacity decreases within the initial 70 d and increases reversely after 70 d with a decrease of cement-to-tailings ratio. When cement-to-tailings ratio decreases from 1:4 to 1:8, the average decrement is 0.33��107 kJ within the initial 70 d and the average increment is 0.37��107 kJ after 70 d. Moreover, the total thermal accumulation capacity also decreases obviously with a decrease of cement-to-tailings ratio, the decrement increases with thermal accumulation time and finally tends to become stable. When cement-to-tailings ratio decreases from 1:4 to 1:8, the decrement of total thermal accumulation capacity is 1.97��107, 4.07��107 and 4.74��107 kJ, respectively at 30, 120 and 180 d. The decrease of thermal accumulation capacity is also caused by the decrease of specific heat capacity and density caused by decreasing cement-to-tailings ratio, and with an increase of thermal accumulation time, the difference of thermal accumulation capacity becomes more significant. Moreover, a heat loss of backfill also occurs during heat convection after 70 d, and the temperature difference between backfill and airflow increases with a decrease of cement-to-tailings ratio, so the heat loss of backfill also increases, this makes the increment of total thermal accumulation capacity gradually stable in the later stage.
Figure 12 shows the total thermal accumulation capacity of backfill for 180 d under different slurry proportions. The maximum of total thermal accumulation capacity occurs and it is 16.56��107 kJ when the cement-to-tailings ratio is 1:4 and the slurry concentration is 72%, while the minimum of total thermal accumulation capacity occurs and it is 10.09��107 kJ when the cement-to-tailings ratio is 1:8 and the slurry concentration is 68%. It is thus clear that the increase of cement-to-tailings ratio and slurry concentration can effectively improve the thermal accumulation capacity of CTB. Moreover, Figure 12 also shows that the influence of cement-to-tailings ratio on thermal accumulation capacity is more greater than that of slurry concentration under the slurry proportions of this study.
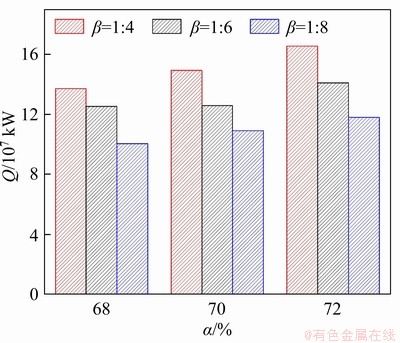
Figure 12 Total thermal accumulation capacity of CTB under different proportions (Surrounding rock temperature of 40 ��C and initial temperature of 18 ��C)
3.4 Effect of surrounding rock temperature on thermal accumulation of CTB
Figure 13 shows the variation of thermal accumulation parameters with time under different surrounding rock temperatures for CTB.Figure 13(a) shows the temperature of the central point in backfill rises significantly with a rise of surrounding rock temperature, the increment gradually increases with thermal accumulation time and finally tends to become stable. When the temperature of surrounding rock rises from 35 to 45 ��C, the temperature of the central point rises from 26.0 to 29.3 ��C, from 29.3 to 34.0 ��C and from 30.3 to 35.4 ��C, respectively at 60, 120 and 180 d, the increment is 3.3, 4.7 and 5.1 ��C, successively. This is mainly because the temperature of surrounding rock determines the temperature difference between backfill and surrounding rock at the initial time of thermal accumulation. The higher the temperature of surrounding rock, the greater the initial heat transfer temperature difference of thermal accumulation and the faster the temperature of the central point in backfill rises.
Figure 13(b) shows the heat conduction rate increases significantly with a rise of surrounding rock temperature, the increment gradually decreases with thermal accumulation time and tends to become stable. When the temperature of surrounding rock rises from 35 to 45 ��C, the increment of heat conduction rate is 10.94, 6.19 and 5.77 kW, respectively at 30, 120 and 180 d. With a rise of surrounding rock temperature, the heat convection rate decreases in the early stage of thermal accumulation, afterwards, it increases reversely. When the temperature of surrounding rock rises from 35 to 45 ��C, the heat convection rate decreases within the initial 30 d with an average decrement of 2.21 kW, while it increases reversely within 40-180 d with an average increment of 4.73 kW and the increment increases with thermal accumulation time. Moreover, the total heat transfer rate increases with a rise of surrounding rock temperature and the increment decreases with thermal accumulation time. When the temperature of surrounding rock rises from 35 to 45 ��C, the increment of total heat transfer rate is 8.31, 1.07 and 0.29 kW, respectively at 30, 120 and 180 d. The temperature difference between backfill and surrounding rock increases when the temperature of surrounding rock rises, so the heat conduction rate increases, and with the proceeding of thermal accumulation, the heat transfer temperature difference gradually decreases, the increment of heat conduction rate becomes smaller. In the early stage, the backfill absorbs heat from airflow, so the higher the temperature of surrounding rock, the higher the temperature of backfill, the smaller the heat convection rate. Afterwards, the backfill will release heat to airflow when the temperature of backfill is higher than that of airflow, so the higher the temperature of surrounding rock, the higher the temperature of backfill, the greater the heat convection rate. Moreover, in the later stage, the increment of heat conduction rate and the reverse increment of heat convective rate, which both are caused by the rising temperature of surrounding rock, are almost equal, so the increment of total heat transfer rate basically disappears.
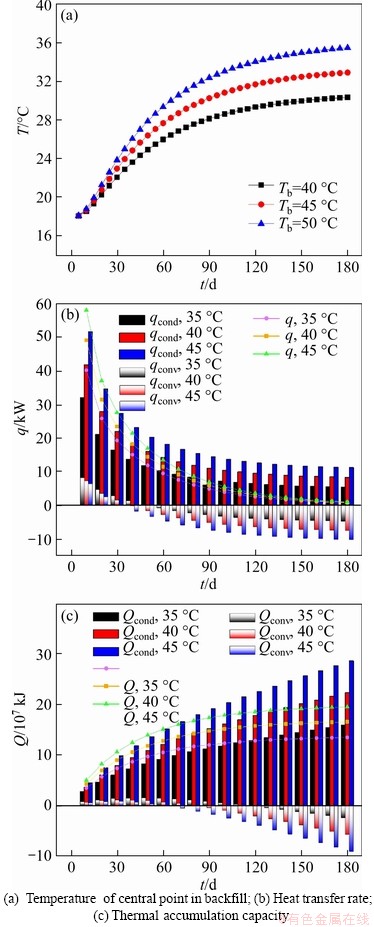
Figure 13 Variation of thermal accumulation parameters with time under different surrounding rock temperatures (Slurry concentration of 72%, cement-tailings ratio of 1:4 and initial temperature of 18 ��C):
Figure 13(c) shows the heat conduction capacity increases with a rise of surrounding rock temperature and the increment increases continuously with thermal accumulation time. When the temperature of surrounding rock rises from 35 to 45 ��C, the increment of heat conduction capacity is 3.81��107, 9.67��107 and 12.73��107 kJ, respectively at 30, 120 and 180 d. The heat convection capacity decreases within the initial 70 d and increases reversely after 70 d with a rise of surrounding rock temperature, the average decrement is 0.91��107 kJ within the initial 70 d and the average increment is 4.41��107 kJ after 70 d when the temperature of surrounding rock rises from 35 to 45 ��C. Moreover, the total thermal accumulation capacity increases significantly with a rise of surrounding rock temperature, the increment increases with thermal accumulation time and finally tends to become stable. When the temperature of surrounding rock rises from 35 to 45 ��C, the increment of total thermal accumulation capacity is 3.24��107, 5.74��107 and 6.02��107 kJ, respectively at 30, 120 and 180 d. This is also because the higher the temperature of surrounding rock, the greater the temperature difference between backfill and surrounding rock, and the greater the heat conduction capacity. Moreover, with the proceeding of thermal accumulation, the difference of accumulated value for heat conduction capacity becomes more obvious, namely the increment of heat conduction capacity becomes larger and larger. When the backfill releases heat to airflow, the higher the temperature of surrounding rock, the higher the temperature of backfill, and the greater the temperature difference between backfill and airflow, so the greater the heat convection capacity, and the difference of accumulated value for heat convection capacity also becomes more obvious with thermal accumulation. Moreover, the increment of total thermal accumulation capacity tends to become stable in the later stage because the increment of heat conduction capacity and the reverse increment of heat convection capacity increase simultaneously.
3.5 Effect of initial temperature on thermal accumulation of CTB
Figure 14 shows the variation of thermal accumulation parameters with time under different initial temperatures for CTB. Figure 14(a) shows the temperature of the central point in backfill rises significantly with a rise of initial temperature and the increment gradually decreases with thermal accumulation time. When the initial temperature rises from 15 to 21 ��C, the temperature of the central point rises from 26.5 to 28.8 ��C, from 31.3 to 32.0 ��C and from 32.8 to 33.0 ��C, respectively at 60, 120 and 180 d, the increment is 2.3, 0.7 and 0.2 ��C, successively. This is mainly because the higher the initial temperature of backfill, the higher the initial temperature of each measuring point. With the proceeding of thermal accumulation, the temperature of backfill gradually rises, which decreases the heat transfer temperature difference, so the temperature increment of the central point also decreases.
Figure 14(b) shows the heat conduction rate decreases with a rise of initial temperature and the decrement gradually decreases with thermal accumulation time. When the initial temperature rises from 15 to 21 ��C, the decrement of heat conduction rate is 4.99, 2.41 and 0.18 kW, respectively at 30, 120 and 180 d. With a rise of initial temperature, the heat convection rate obviously decreases when the backfill absorbs heat from airflow, while it slightly increases when the backfill releases heat to airflow, the average decrement of heat convection rate is 5.42 kW within the initial 30 d and the average increment is 1.01 kW within 40-180 d when the initial temperature rises from 15 to 21 ��C. Moreover, the total heat transfer rate decreases with a rise of initial temperature, the decrement gradually decreases with thermal accumulation time and it is 8.87, 4.40 and 0.33 kW, respectively at 30, 120 and 180 d when the initial temperature rises from 15 to 21 ��C. This is mainly because the temperature difference between backfill and surrounding rock decreases when the initial temperature of backfill rises, so the heat conduction rate also decreases, and with the proceeding of thermal accumulation, the heat transfer temperature difference further decreases, the increment of heat conduction rate becomes smaller. With a rise of initial temperature, the heat convection rate decreases in the early stage and reversely increases in the later stage because the temperature difference decreases for the backfill absorbing heat from airflow and increases for the backfill releasing heat to airflow. Moreover, in the early stage, the heat conduction rate and heat convection rate obviously decrease at the same direction, so the decrement of total heat transfer rate is greater, while in the later stage, the decrement of heat conduction rate and the reverse increment of heat convection rate are both very small, so the increment of total heat transfer rate almost disappears.
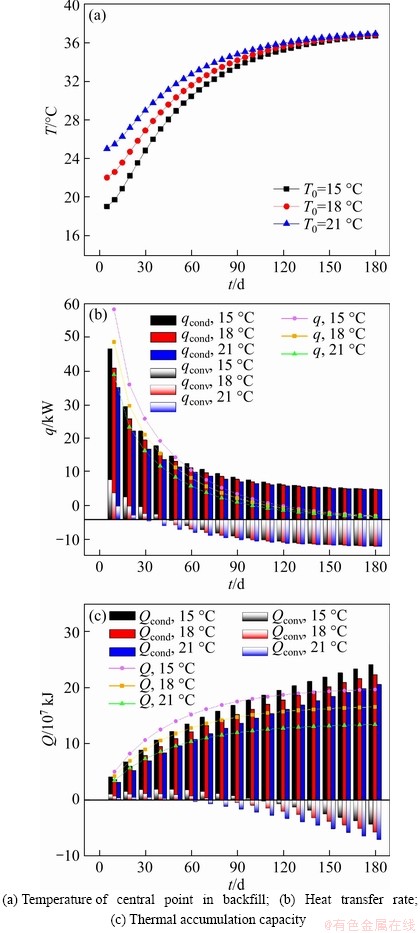
Figure 14 Variation of thermal accumulation parameters with time under different initial temperatures (Slurry concentration of 72%, cement-to-tailings of 1:4 and surrounding rock temperature of 40 ��C):
Figure 14(c) shows the heat conduction capacity decreases significantly with a rise in initial temperature, the decrement gradually increases with thermal accumulation time and it is 1.94��107, 3.15��107 and 3.53��107 kJ, respectively at 30, 120 and 180 d when the initial temperature increases from 15 to 21 ��C. The influence results of initial temperature on heat convection capacity are similar to that of surrounding rock temperature, the average decrement is 1.56��107 kJ within the initial 70 d and the average increment is 2.57��107 kJ after 70 d when the initial temperature increases from 15 to 21 ��C. Moreover, the total thermal accumulation capacity decreases significantly with a rise of initial temperature, the decrement gradually increases and finally tends to become stable with thermal accumulation time. The decrement of total thermal accumulation capacity is 3.35��107, 5.55��107 and 6.24��107 kJ, respectively at 30, 120 and 180 d when the initial temperature increases from 15 to 21 ��C. This is mainly because the higher the initial temperature, the smaller the temperature difference between backfill and surrounding rock, so the smaller the heat conduction capacity. Moreover, with the proceeding of thermal accumulation, the difference of accumulated value for heat conduction capacity becomes more obvious, namely the decrement of heat conduction capacity becomes larger and larger. When the backfill releases heat to airflow, the higher the initial temperature, the greater the temperature difference between backfill and airflow, so the greater the heat convection capacity, and the difference of accumulated value for heat convection capacity also becomes more obvious with thermal accumulation. Moreover, the decrement of total thermal accumulation capacity is ever greater in the later stage because the decrement of heat conduction capacity and the reverse increment of heat convection capacity increase simultaneously.
Figure 15 shows the total thermal accumulation capacity of backfill for 180 d under different surrounding rock temperatures and initial temperatures. The maximum of total thermal accumulation capacity occurs and it is 22.66��107 kJ when the surrounding rock temperature is 45 ��C and the initial temperature is 15 ��C, while the minimum of total thermal accumulation capacity occurs and it is 10.15��107 kJ when the surrounding rock temperature is 35 ��C and the initial temperature is 21 ��C. It is clear that the rise of surrounding rock temperature and the decrease of initial temperature can effectively improve the total thermal accumulation capacity of CTB, and the increment of total thermal accumulation capacity can reach 12.51��107 kJ. The influence of surrounding rock temperature and initial temperature on the total thermal accumulation capacity is more significant than that of slurry proportions, which is approximately 2 times of the influence of slurry proportions under the conditions of this study. Moreover, Figure 15 also shows that the higher the surrounding rock temperature, the more obvious the influence of initial temperature on the total thermal accumulation capacity.
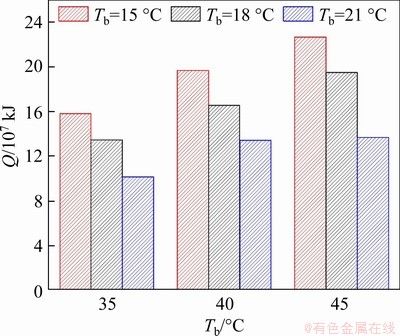
Figure 15 Total thermal accumulation capacity of CTB under different surrounding rock temperatures and initial temperatures (slurry concentration of 72% and cement-to-tailings ratio of 1:4)
4 Conclusions
The thermal accumulation process of CTB is studied by numerical simulation, and the influence of thermal accumulation time, slurry concentration, cement-to-tailings ratio, surrounding rock temperature and initial temperature on the thermal accumulation of backfill is analyzed, the following conclusions are drawn.
1) Under condition of slurry concentration of 72%, cement-to-tailings ratio of 1:4, surrounding rock temperature of 40 ��C and initial temperature of 18 ��C, with the proceeding of thermal accumulation, the temperature of backfill gradually increases, the total heat transfer rate decreases, the total thermal accumulation capacity increases and all of them tend to be stable finally. The thermal accumulation mainly occurs within the initial 90 d, the increment of average temperature on the section of z=50 m is 14.4 ��C within 0-90 d and 1.5 ��C within 90-180 d. The total heat transfer rate decreases by approximately 90% and the total thermal accumulation capacity increases by approximately 85% within the initial 90 d.
2) At surrounding rock temperature of 40 ��C and initial temperature of 18 ��C, with the increase of slurry concentration and cement-to-tailings ratio, the total heat transfer rate and total thermal accumulation capacity both increase. When the slurry concentration increases from 68% to 72%, the increment of total heat transfer rate is 3.29, 0.93 and 0.34 kW, and the increment of total thermal accumulation capacity is 1.13��107, 2.53��107 and 2.81��107 kJ, respectively at the thermal accumulation of 30, 120 and 180 d. When the cement-to-tailings ratio decreases from 1:4 to 1:8, the decrement of total heat transfer rate is 5.46, 1.17 and 0.40 kW, and the decrement of total thermal accumulation capacity is 1.97��107, 4.07��107 and 4.74��107 kJ, respectively at the thermal accumulation of 30, 120 and 180 d.
3) With a slurry concentration of 72%, cement-to-tailings ratio of 1:4, with an increase of surrounding rock temperature and a decrease of initial temperature, the total heat transfer rate and total thermal accumulation capacity both increase. When the surrounding rock temperature rises from 35 to 45 ��C, the increment of total heat transfer rate is 8.31, 1.07 and 0.29 kW, and the increment of total thermal accumulation capacity is 3.24��107, 5.74��107 and 6.02��107 kJ, respectively at the thermal accumulation of 30, 120 and 180 d. When the initial temperature rises from 15 to 21 ��C, the decrement of total heat transfer rate is 8.87, 4.40 and 0.33 kW, and the decrement of total thermal accumulation capacity is 3.35��107, 5.55��107 and 6.24��107 kJ, respectively at the thermal accumulation of 30, 120 and 180 d.
4) The rise of surrounding rock temperature from 35 to 45 ��C, the decrease of initial temperature from 21 to 15 ��C and the increase of slurry concentration from 68% to 72%, and cement-tailing ratio from 1:8 to 1:4 can effectively improve the total heat transfer rate and total thermal accumulation capacity. The influence of the former two is more significant, which is approximately 2 times of the influence of slurry proportions. Moreover, the heat conduction between backfill and surrounding rock accounts for a considerable proportion in the process of thermal accumulation, the average heat conduction rate is approximately 7 times of the average heat convection rate and the average heat conduction capacity is approximately 25 times of the heat convection capacity.
Nomenclatures
T
Temperature, ��C
cp
Specific heat at constant pressure, (kJ��kg����C-1)
h
Surface convective heat transfer coefficient, (w��m-2����C-1)
q
Heat transfer rate, kW
Q
Total thermal accumulation capacity, kJ
d
Time, d
l
Thermal conductivity, (W��m-1����C-1)
r
Density, (g��cm-3)
a
Slurry concentration
b
Cement-to-tailings ratio
s
Boundary between CTB and surrounding rock
w
Boundary between CTB and stope
Subscripts
b
Surrounding rock
a
Airflow
bf
CTB
0
Initial
n
Normal direction
cond
Heat conduction
conv
Heat convection
Contributors
ZHANG Xiao-yan performed the data curation, supervision and writing-review and editing. ZHAO Min performed the formal analysis, investigation, methodology and validation. LIU Lang provided the concept and wrote the original draft. HUAN Chao and SONG KI-IL conducted the formal analysis and validation. XU Mu-yan provided the software supporting. WEN De provided the investigation supporting.
Conflict of interest
ZHANG Xiao-yan, ZHAO Min, LIU Lang, HUAN Chao, SONG KI-IL, XU Mu-yan and WEN De declare that they have no conflict of interest.
References
[1] DUDKA A, ADRIANO D A. Environmental impacts of metal ore mining and processing: A Review [J]. Jounal of Environmental Quality, 1997, 25: 590-602. DOI: 10.2134/jeq1997.00472425002600030003x.
[2] RANJITH P G, ZHAO J, JU M H, DE SILVA R V S, RATHNAWEERA T D, BANDARA A K M S. Opportunities and challenges in deep mining: A brief review [J]. Engineering, 2017, 3: 546-551. DOI: http://dx.doi.org/10.1016/J.ENG. 2017.04.024.
[3] LUO Li-qun, LI Ke-yao, WENG Fu, LIU Cheng, YANG Si-yuan. Preparation, characteristics and mechanisms of the composite sintered bricks produced from shale, sewage sludge, coal gangue powder and iron ore tailings [J]. Construction and Building Materials, 2020, 232: 117250. DOI: https://doi.org/ 10.1016/ j.conbuildmat.2019.117250.
[4] CUI Liang, FALL M. An evolutive elasto-plastic model for cemented paste backfill [J]. Computers and Geotechnics, 2016, 71: 19-29. DOI: http://dx.doi.org/10.1016/j.compgeo.2015. 08.013.
[5] LI Li. A generalized solution for mining backfill design [J]. International Jounal of Geomechanics, 2014, 14(3): 1-11. DOI: 10.1061/(ASCE)GM.1943-5622.0000329.
[6] YIN Sheng-hua, WU Ai-xiang, HU Kai-jian, WANG Yong, ZHANG Yan-kai. The effect of solid components on the rheological and mechanical properties of cemented paste backfill [J]. Minerals Engineering, 2012, 35: 61-66. DOI: http://dx.doi.org/10.1016/j.mineng.2012.04.008.
[7] YIN Sheng-hua, SHAO Ya-jian, WU Ai-xiang, WANG Hong-jiang, LIU Xiao-hui, WANG Yong. A systematic review of paste technology in metal mines for cleaner production in China [J]. Jounal of Cleaner Production, 2020, 247: 119590. DOI: https://doi.org/10. 1016/j.jclepro.2019.119590.
[8] WANG Yong, FALL M, WU Ai-xiang. Initial temperature-dependence of strength development and self-desiccation in cemented paste backfill that contains sodium silicate [J]. Cement and Concrete Composites, 2016, 67: 101-110. DOI: http://dx.doi.org/10.1016/ j.cemconcomp.2016.01.005.
[9] ERCIKDI B, KESIMAL A, CIHANGIR F, DEVECI H, ALP I. Cemented paste backfill of sulphide-rich tailings: Importance of binder type and dosage [J]. Cement and Concrete Composites, 2009, 31: 268-274. DOI: https:// doi.org/10.1016/j.cemconcomp.2009.01.008.
[10] XIE Zhong-peng. Distribution law of high temperature mine��s thermal environment parameters and study of heat damage��s causes [J]. Procedia Engineering, 2012, 43: 588-593. DOI: https://doi.org/10.1016/ j.proeng.2012.08.104.
[11] GAO Yong-ge, LIU Fu-ming. The study of thermal pollution disposal on the deep coal mine working face [C]// PACIIA 2009, 2009: 304-307. DOI: 10.1109/PACIIA. 2009.5406598.
[12] LIU Lang, XIN Jie, ZHANG Bo, ZHANG Xiao-yan, WANG Mei, QIU Huan-fu, CHEN Liu. Basic theories and applied exploration of functional backfill in mines [J]. Jounal of China Coal Society, 2018, 43: 1811-1820. DOI: 10.13225/ j.cnki.jccs.2017.1626.
[13] GHOREISHI-MADISEH S A, HASSANI F, ABBASY F. Numerical and experimental study of geothermal heat extraction from backfilled mine stopes [J]. Applied Thermal Engineering, 2015, 90: 1119-1130. DOI: http://dx.doi. org/10.1016/j.applthermaleng.2014.11.023.
[14] NIU Yong-sheng. Research on thermal energy recycling utilization in high temperature mines [J]. Procedia Engineering, 2015, 21: 389-395. DOI: https://doi.org/10. 1016/j.proeng.2015.08.1083.
[15] GUO Ping-ye, HE Man-chao, ZHENG Lian-ge, ZHANG Na. A geothermal recycling system for cooling and heating in deep mines [J]. Applied Thermal Engineering, 2017, 116: 833-839. DOI: http://dx.doi.org/10.1016/j.applthermaleng.2017.01.116.
[16] RODRIGUEZ R, DIAZ M B. Analysis of the utilization of mine galleries as geothermal heat exchangers by means a semi-empirical prediction method [J]. Renewable Energy, 2009, 34: 1716-1725. DOI: https://doi.org/10.1016/j.renene. 2008.12.036.
[17] AHMAD S, RIZVI Z, KHAN M A, AHMAD J, WUTTKE F. Experimental study of thermal performance of the backfill material around underground power cable under steady and cyclic thermal loading [J]. Materials Today: Proceedings, 2019, 17: 85-95. DOI: https://doi.org/10.1016/j.matpr.2019. 06.404.
[18] AL-AMEEN Y, IANAKIEV A, EVANS R. Recycling construction and industrial landfill waste material for backfill in horizontal ground heat exchanger systems [J]. Energy, 2018, 151: 556-568. DOI: https://doi.org/10.1016/j.energy. 2018.03.095.
[19] KAYACI N, DEMIR H. Numerical modelling of transient soil temperature distribution for horizontal ground heat exchanger of ground source heat pump [J]. Geothermics, 2018, 73: 33-47. DOI: https://doi.org/10.1016/j.geothermics.2018.01. 009.
[20] TONG Cang, LI Xiang-li, DUANMU Lin, WANG Zong-shan. Research on heat transfer characteristics of soil thermal storage in the non-heating Season [J]. Procedia Engineering, 2017, 205: 3293-3300. DOI: https://doi.org/10.1016/j.proeng. 2017.10.338.
[21] WU Xuan, LIU Wei, LU Zi-ye, LIANG Pan-long, JIN Guang. Simulation on temperature variation characteristics of soil around buried pipe in process of heat storage and release [J]. Transactions of CASE, 2017, 33: 204-213. DOI: 10.11975/j.issn.1002-6819.2017.03.028.
[22] ZHANG Liang, XU Peng, MAO Jia-chen, TANG Xu, LI Zheng-wei, SHI Jian-guo. A low cost seasonal solar soil heat storage system for greenhouse heating: Design and pilot study [J]. Applied Thermal Engineering, 2015, 156: 213-222. DOI: http://dx.doi.org/10.1016/j. apenergy.2015.07.036.
[23] BERNARDES M A D S. On the heat storage in solar updraft tower collectors�CInfluence of soil thermal properties [J]. Solar Energy 2013, 98: 49-57. DOI: http://dx.doi.org/10.1016/ j.solener.2013.07.014.
[24] CHEN Hong-bing, DING Han-wan, LIU Song-yu, WU Wei, ZHANG Lei. Comparative study on heat and moisture transfer in soil heat charging at high temperature for various soils [J]. Energy Procedia, 2015, 75: 3148-3153. DOI: https:// doi.org/10.1016/j.egypro. 2015.07.649.
[25] WANG Li-hui, ZOU Xue-cheng, TAO Hui, SONG Jie, ZHENG Yi. Experimental study on evolution characteristics of the heat storage of surrounding soil in subway tunnels [J]. Procedia Engineering, 2017, 205: 2728-2735. DOI: https://doi.org/10.1016/j.proeng.2017.10.191.
[26] LI Wei, LI Xin-guo, ZHAO Jun, HAN Min-xia. Study on heat storage characteristics of soil and simulation [J]. Acta Energiae Solaris Sinica, 2009, 30: 1491-1495.
[27] ZHANG Xiao-yan, LIU Li, LIU Lang, LIU Lu, JIA Yu-hang. Numerical simulation of heat release performance of filling body under condition of heat extracted by fluid flowing in buried tube [J]. Journal of Central South University, 2019, 26: 2160-2174. DOI: https://doi.org/10.1007/s11771-019-4163-y.
[28] ZHANG Xiao-yan, XU Mu-yan, LIU Lang, HUAN Chao, ZHAO Yu-jiao, Qi Chong-chong, SONG KI-IL. Experimental study on thermal and mechanical properties of cemented paste backfill with phase change material [J]. Journal of Materials Research Technology, 2019, 9: 2164-2175. DOI: https:// doi.org/10.1016/ j.jmrt.2019.12.047.
[29] ZHANG Xiao-yan, ZHAO Min, LIU Lang, HUAN Chao, ZHAO Yu-jiao, QI Chong-chong, SONG KI-IL. Numerical sumulation on heat storage performance of backfill body based on tube-in-tube heat exchanger [J]. Construction and Building Materials, 2020, 265: 120340. DOI: https://doi. org/10.1016/ j.conbulidmat.2020.120340.
[30] ZHANG Xiao-yan, XU Muyan, LIU Li, LIU Lang, WANG Mei, LI Hai-wei, SONG KI-IL. Numerical sumulation on heat storage performance of backfill body based on tube-in-tube heat exchanger [J]. Energies, 2020, 13. DOI: 10.3390/ en13184755.
(Edited by FANG Jing-hua)
���ĵ���
βɰ����������������ܵ���ֵģ��
ժҪ��������ʵ��������Դ�����Эͬ����Ϊ���۵㣬��βɰ������������ۻ����̽�����ֵģ���о�������������ʱ�䡢�Ͻ���ȼ��Ȼ����Գ������������ܵ�Ӱ�죬ͬʱ�Ա���Χ�ҵ�����ɳ������������ȶԳ��������ۻ����̵�Ӱ�졣����������������ܴ�����������10~90������Լ85%���ڱ���ģ����£�Χ���¶Ⱥͳ�ʼ�¶ȶ��ܴ�������Ӱ���Ϊ��������Ӱ��ԼΪ������ȵ�2�����ɼ���Χ���¶ȵ����ߺͳ�ʼ�¶ȵĽ����ܸ���Ч����ߴ����������⣬�ȴ����ڳ������Ȼ��۹�����ռ���൱��ı��أ�ƽ��������ԼΪ�ȶ�������25�������о���Ϊ������Դ�����г��������ۻ����̵��Ż��ṩ�������ݺ�Ӧ�òο���
�ؼ��ʣ������壻���ۻ����ȴ������ȶ������ܴ�����
Foundation item: Projects(51974225, 51674188, 51874229, 51904224, 51904225, 51704229) supported by the National Natural Science Foundation of China; Project(2018KJXX-083) supported by the Shaanxi Innovative Talents Cultivate Program-New-Star Plan of Science and Technology, China; Projects(2018JM5161, 2018JQ5183, 2015JM-074) supported by the Natural Science Basic Research Plan of Shaanxi Province, China; Project(19JK0543) supported by the Scientific Research Program funded by Education Department of Shaanxi Province, China; Project(2018YQ201) supported by the Outstanding Youth Science Fund of Xi��an University of Science and Technology, China
Received date: 2020-04-26; Accepted date: 2020-11-10
Corresponding author: LIU Lang, PhD, Professor; Tel: +86-29-85583143; E-mail: liulang@xust.edu.cn; ORCID: https://orcid.org/0000-0001-9536-0508

