行业整合背景下的中国有色金属企业技术效率评价
来源期刊:中国有色金属学报(英文版)2013年第9期
论文作者:危 平 唐慧泉 陈 瑶 陈晓红
文章页码:2797 - 2806
关键词:行业整合;有色金属企业;数据包络分析法;技术效率;规模效率;企业集团
Key words:industry consolidation; nonferrous metals firms; data envelopment analysis (DEA); technical efficiency; scale efficiency; conglomerate
摘 要:自2009年以来,我国有色金属产业在政府推动下开展了行业整合。在此,对我国2007-2011年间有色金属企业的技术效率及其变动进行研究。在以有色金属上市公司作为研究样本的基础上,采用DEA的方法分别测算有色金属矿釆选企业和有色金属冶炼及压延加工企业的技术效率。研究发现,两个行业,无论是纯技术效率还是规模效率,无效企业居多。行业纯技术效率和规模效率均值在2009年之后偏低。其中,有色金属冶炼及压延加工企业效率值的波动较大。少数龙头企业保持着行业内相对有效的纯技术效率和规模效率,但大多数龙头企业的技术效率值则在2009年之后出现了大幅度的下降。
Abstract: Since 2009, Chinese nonferrous metals industry has been carried out industry consolidation with strong support by the central government. This work examined technical efficiency of Chinese nonferrous metals firms and its change during the period of 2007 and 2011. Based on financial data from nonferrous metals listed companies, technical efficiency of nonferrous metal minerals mining firms and nonferrous metal smelting, pressing and processing firms was estimated respectively using the data envelopment analysis (DEA) method. It was found that, in both sectors, number of pure technical and scale inefficient firms dominated over efficient ones. Overall, their technical and scale efficiency tended to be very low after 2009. In particular, efficiency scores of nonferrous metal smelting, pressing and processing firms fluctuated greatly during the research period. And a limited number of large leading firms were able to maintain 100% efficiency score in the industry, while efficiency of most of other leading firms has declined since 2009.
Trans. Nonferrous Met. Soc. China 23(2013) 2797-2806
Ping WEI1,2, Hui-quan TANG1, Yao CHEN1, Xiao-hong CHEN1
1. Business School, Central South University, Changsha 410083, China;
2. Institute of Metal Resources Strategy, Central South University, Changsha 410083, China
Received 10 May 2013; accepted 19 August 2013
Abstract: Since 2009, Chinese nonferrous metals industry has been carried out industry consolidation with strong support by the central government. This work examined technical efficiency of Chinese nonferrous metals firms and its change during the period of 2007 and 2011. Based on financial data from nonferrous metals listed companies, technical efficiency of nonferrous metal minerals mining firms and nonferrous metal smelting, pressing and processing firms was estimated respectively using the data envelopment analysis (DEA) method. It was found that, in both sectors, number of pure technical and scale inefficient firms dominated over efficient ones. Overall, their technical and scale efficiency tended to be very low after 2009. In particular, efficiency scores of nonferrous metal smelting, pressing and processing firms fluctuated greatly during the research period. And a limited number of large leading firms were able to maintain 100% efficiency score in the industry, while efficiency of most of other leading firms has declined since 2009.
Key words: industry consolidation; nonferrous metals firms; data envelopment analysis (DEA); technical efficiency; scale efficiency; conglomerate
1 Introduction
It is well known that nonferrous metals are essential raw materials and strategic resources in the development of national economy, the construction of national defense and the progress of science and technology. Therefore, nowadays many countries are actively promoting the development of nonferrous metals industry and increasing nonferrous metals’ strategic reserve. Although Chinese nonferrous metals industry has developed very rapidly since the reform of 1979, there are many problems revealed from the process. For example, in the upstream chains of the nonferrous metals industry, price of raw materials of nonferrous metals has remained on a rising trend and has fluctuated frequently. Some small enterprises disorderly exploit mines, and the level of resource protection is not high; in the middle chains, productive capacity has expanded at a high speed, but mostly is low-end production with dispersed operation, high level of energy consumption, serious destruction of ecological environment and resources waste; for the downstream chains, many productions are in small scale, leading to a low degree of industry concentration and high level of energy consumption. Aluminum, copper, and lead are claimed as products of overcapacity [1].
In order to solve above problems, the Chinese government has issued a series of governance policies since 2009, including “the Nonferrous Metals Industry Revitalization Plan” (2009), “the Nonferrous Metals 12th Five-Year Plan” (2010) and “Renewable Nonferrous Metals Industry Development Promotion Plan” (2011), etc. The core of policies is to carry on industrial consolidation in the nonferrous metals industry. Consolidation occurs when firms serving one particular market merge together for the purpose of seeking long-term competitive advantage [2]. In “the Nonferrous Metals Industry Revitalization Plan” (2009), it has been targeted to form 3-5 strong and integrated conglomerates. By 2011, proportions of the top ten domestic copper, aluminum, lead and zinc enterprises in the national total production were increased to 90%, 70%, 60% and 60%respectively. And in “China’s Rare Earths Situation and Policy White Paper” (2012), it has been proposed to do industrial integration and foster large, efficient and clean companies.
The central government promotes industrial consolidation, aiming at not only improving efficiency of resources use and production, but also protection of ecological environment, development of industrial technology and resource security [3]. The government tends to rely on large enterprises or conglomerates to agglomerate advantage resources. The process of industrial consolidation is thus targeted as a process led by a number of large enterprise groups and to achieve structural adjustment and efficiency optimization in the nonferrous metals industry [1].
Because, first of all, it is usually assumed that large conglomerates are able to gain economies of scale and scope, reducing long-term average cost, so as to optimize resource allocation and productive efficiency. In the meanwhile, expansion of the scale of enterprises can greatly enhance the competitiveness in the market and the ability of bearing losses and risk-taking. Secondly, being specialized and relatively abundant in capital, large enterprises groups could have more input in research and development (R&D), and achieve a leading position in the industry as regards technological progress and innovation. After all, technological cost and risk are high, which can be borne by large enterprises. In the meanwhile, scale economies in technological research also require a high level of investment in R&D. Moreover, due to relatively complete structure of corporate governance, there is more pressure for leading enterprises’ corporate social responsibility. Therefore, those firms have to pay more attention to environmental protection. They are also more likely to invest funds and resources in energy saving for cost incentives.
One way to evaluate market performance of industrial consolidation is to examine firms’ efficiency from a micro perspective. In the economics literature, “efficiency” usually refers to “Pareto optimality” or “Pareto efficiency”, i.e. an economic state where resources are allocated in the most efficient manner. Efficiency of a particular firm then is more specifically to refer to the business’s productive efficiency, indicating the firm’s input-output relation [4]. FARRELL [5] distinguished between “technical efficiency” and “allocative efficiency”. Assuming that input is fixed, the ratio of a particular firm’s actual output and the potential maximum output is defined as technical efficiency; allocative efficiency addresses the issue of distributing given resources to achieve the right mixture to maximize the benefits and minimize the cost. Because measurement of technical efficiency doesn’t require data on price of each production input, it is practically useful and most research concentrates mainly on technical efficiency to undertake efficiency analysis.
In the exiting literatures, there is limited research on measuring technical efficiency of nonferrous metals firms. Current research has evaluated efficiency from the aggregate sector and regional level. For example, ZHENG and XIE [6] used the industrial aggregate input and output data and the data envelopment analysis (DEA) model to estimate the effectiveness of decision making units and returns to scale, and then carried out an overall evaluation and analysis of Chinese nonferrous metals industry. They pointed out that, currently China’s metal industry was in a stage of diminishing returns to scale, therefore metal enterprises cannot merely rely on labor, capital and other production factors to improve yield. ZHENG and CHAI [7] used BCC model to analyze nonferrous metals industries in 29 provinces in 2008. They found that, DEA efficiency score of nonferrous industries reaches 100% only in five provinces and cities including Beijing and Shanghai. They claimed that it is likely caused by generally low scale efficiency and technical efficiency across regions. On the whole, efficiency study using aggregate data at industry and regional levels can be useful in demonstrating how Chinese nonferrous metals industry has improved efficiency in recent decades. However, it ignored differences between enterprises. We argue that efficiency analysis based on enterprise data is more precise in reflecting how various enterprises have used inputs to produce outputs.
This work is to estimate technical efficiency of China’s nonferrous metals firms and its change from 2007 to 2011 when the industry was undertaking industrial consolidation. Based on financial data from nonferrous metals listed companies, we estimate technical efficiency of nonferrous metal minerals mining enterprises and nonferrous metal smelting, pressing and processing enterprises respectively by using DEA method. We pay particular attention to leading firms’ technical efficiency change during the period. By doing so, we aim to contribute to literatures by evaluating market performance of industrial consolidation from a micro-level and presenting suggestions for efficiency improvement.
2 Method and model
2.1 Methods of efficiency analysis
Based on FARRELL’s [5] definition of technical efficiency, the frontier production function has been developed as the dominant method to measure technical efficiency of firms [4,8]. Depending on estimating parameters in the frontier production function, this method can be subdivided into parametric and nonparametric approaches. 1) The parametric approach needs to specify the efficiency frontier function before computation. It takes account of interference from random error and therefore has a small degree of dispersion. However, it also requires good size of samples, and has complex computation [9,10]. The most commonly used parameter estimation method is Stochastic Frontier analysis (SFA), developed by AIGNER et al [11] from 1970s. 2) The nonparametric approach uses linear programming to calculate efficiency. Its efficiency value is a relative term, measuring the gap between inefficient firms and reference sets. The approach is weak in distinguishing various ways of deviation from efficient frontiers, thus can not separate random error from others. But it has advantage in avoiding the setting error, namely it does not need to specify the frontier production function for a studied industry, so as to avoid bias caused by subjective specification. In the meanwhile, it can be well applied to production of multiple inputs and multiple outputs. Among nonparametric approaches, the DEA method developed by CHARNES et al [12] is the mostly applied in recent studies.
This work used DEA model to estimate Chinese nonferrous metals firms’ technical efficiency for the following reasons: 1) Existing studies on technical efficiency of Chinese nonferrous metals enterprises are very limited, resulting in a limited understanding on relationships between inputs and outputs in the industry. The DEA method can overcome specification problems associated with the statistical frontier methods. 2) The DEA method can well serve cases where production is in multiple inputs and outputs, while the parametric approach is very complex in computation when applied to same cases. If there is any bias on the error term probability distribution hypothesis, it will influence accuracy of efficiency evaluation. 3) BANKER et al [13] suggested that the DEA model is suitable for estimating efficiency of small size of samples, and is stable in measuring efficiency frontiers.
2.2 DEA model
FARE and LOVELL [14] claimed that under the condition of variable returns to scale, technical efficiency (i. e. total technical efficiency) of a particular firm can be measured by two multiplicative components: one is pure technical efficiency, and the other component is scale efficiency. Pure technical efficiency measures levels of production technology using feasible sets of efficient inputs to produce maximum outputs, as well as management capacity within an organization. Therefore, it could reflect resource inefficiency caused by lag in technology, poor management or mistakes in strategic decision-makings. Scale efficiency, on the other end, is usually used to judge whether the company is in the optimal production scale.
A firm’s technical efficiency can be calculated through the CCR model [12]. CCR model is suitable for efficiency evaluation of a DMU (decision making unit) under the assumption of constant returns to scale. An efficient DMU specifically means its production scale is efficient and technical level is high relative to other units under studied. The CCR model to evaluate a DMU technology efficiency is shown in Eq. (1):
 (1)
(1)
where the all input vector of DMU can be expressed with Xj=(x1j, x2j, …, xij)T, and xij is defined as input i in DMU; all output vector of DMU can be expressed with Yj=(y1j, y2j, …, yij)T, and yij is defined as output i in DMU; ε is an Archimedes infinitesimal; S+ and S- are slack variables; δ, λj, S+, S - are the optimal solution. 1) When δ=1 and S+=S -=0, it means that DMU is efficient; 2) When δ=1, S+ and S - are not 0 at the same time, it suggests DMU is not efficient for both pure technical efficiency and scale efficiency, therefore DMU is weakly efficient; 3) When δ=1, it means that DMU is not efficient. If  =1, DMU is in constant returns to scale; if >1, DMU is in decreasing returns to scale; if <1, DMU is in increasing returns to scale [15,16].
The above equation is used to estimate technical efficiency. To get pure technical efficiency, we need to use the BCC model. The BCC model was developed further from the CCR model by BANKER et al [12]. The model is without the assumption of constant returns to scale, its equation is shown as
 (2)
(2)
where the all input vector of DMU can be expressed with Xj=(x1j, x2j, …, xij)T, and xij is defined as input i in DMU; all output vector of DMU can be expressed with Yj=(y1j, y2j, …, yij)T, and yij is defined as output i in DMU; ε is an Archimedes infinitesimal; λ is the coefficient to make linear combination; S+ and S- are slack variables; θ is the optimal solution to evaluate DMU’s pure technical efficiency. 1) When θ=1, S+=S-=0, it means that DMU is efficient; 2) When θ=1, S+ and S- are not 0 at the same time, DMU is weakly efficient; 3) When θ=1, DMU is not efficient.
Scale efficiency can be measured by technical efficiency dividing pure technical efficiency. If S is scale efficiency score of a DMU, we can use the above two equations to get S=δ/θ. When S=1, it is suggested that DMU is efficient in scale economy; when S<1, it is inefficient, possibly in increasing or decreasing returns to scale.
2.3 Main input/output variables
One important issue of DEA analysis is to define inputs and outputs. Like other industries, nonferrous metals firms use materials, capital and labor to produce products. Therefore, we use total asset, operational cost and number of employees as input indicators, and use operational revenue, asset turnover and net return on equity (ROE) as output measurement.
Because ROEs of some sampled firms are negative and different input and output variables have different measurement dimensions, we cannot use those financial data directly with DEA computation. Therefore, following WANG et al [17], we use Eq. (3) to do dimensionless transition for input data and use Eq. (4) to do dimensionless transition for output data.
 (3)
(3)
 (4)
(4)
2.4 Data description
Our dataset consists of nonferrous metals listed companies between 2007 and 2011. According to the category standards published by China Securities Regulatory Commission, the main business of sampled firms is limited to nonferrous metal business only. To examine further, we distinguish between the nonferrous metal minerals mining group and the nonferrous metal smelting, pressing and processing group and have computed efficiency score respectively. The subdivision is to reflect differences in input endowments and technology among production processes for those two groups of firms. We have excluded firms which have incomplete financial data and eventually our sample consists of 12 representative firms in the nonferrous metal minerals mining group and 30 firms in the nonferrous metal smelting, pressing and processing group. Tables 1 and 2 give summary statistics on main input and output variables.
The financial data used in our study are drawn from the GTA database and Tencent finance. We use DEAP 2.1 to estimate DEA efficiency score.
3 Results and discussion
3.1 Nonferrous metal minerals mining firms
Table 3 presents pure technical efficiency and scale efficiency of nonferrous metal minerals mining firms. Only three firms maintained 100% efficiency score over five years and dominate other firms. They are Shandong Gold (Shandong Huangjin), Zhongjin Gold (Zhongjin Huangjin) and Zijin Mining (Zijin Kuangye). The 100% efficiency score indicates that those firms are at least the best performer on one particular dimension. Except 2007, number of firms inefficient in pure technical and scale efficiency dominated over efficient ones during the research period. This indicates that technical efficiency levels of Chinese nonferrous metal minerals mining firms need to be further improved. It is worth pointing out that, after 2007, the average score of pure technical efficiency of sample firms has declined greatly, while the value of scale efficiency has slightly decreased. The results imply that industrial consolidation carried out from 2009 seems not to generate expected industrial optimization effect.
Table 1 Summary statistics on nonferrous metal minerals mining firms
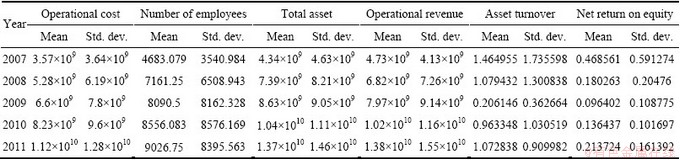
Table 2 Summary statistics on nonferrous metal smelting, pressing and processing firms
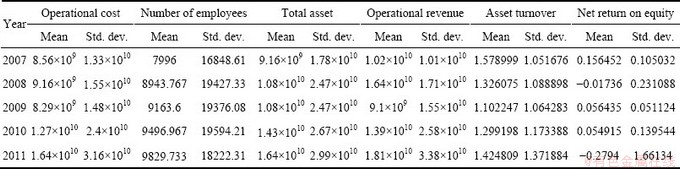
Table 3 Estimated pure technical efficiency and scale efficiency of nonferrous metal minerals mining firms
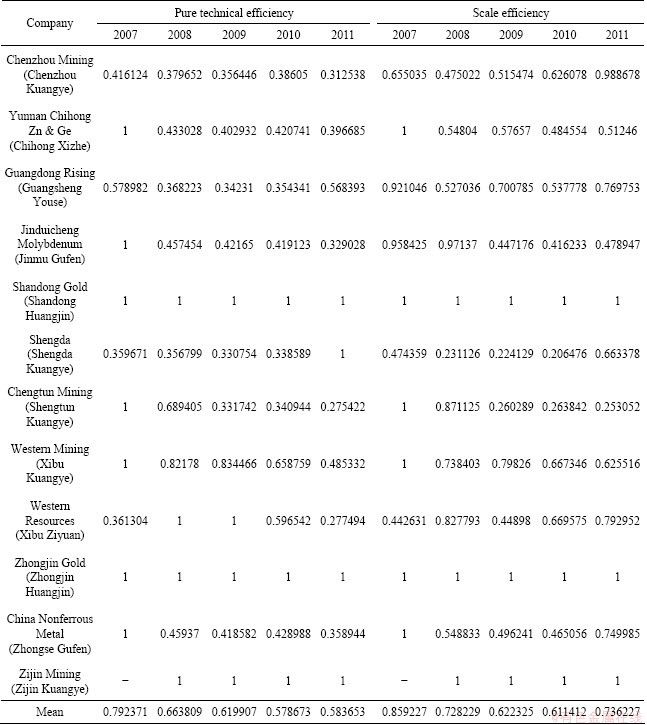
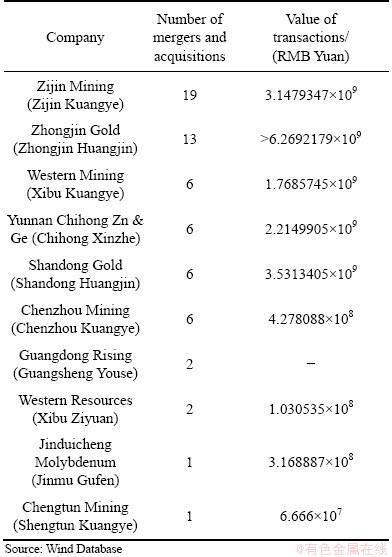
According to total asset size in 2011, the top five leading companies are Zijin Mining (Zijin Kuangye), Western Mining (Xibu Kuangye), Zhongjin Gold (Zhongjin Huangjin), Yunnan Chihong Zn & Ge (Chihong Xinzhe) and Jinduicheng Molybdenum (Jinmu Gufen). Figures 1 and 2 provide the top five leading firms’ efficiency score over 2007-2011. And Table 4 presents the number of mergers and acquisitions for part of sampled firms. In Table 4, Zijin Mining (Zijin Kuangye) and Zhongjin Gold (Zhongjin Huangjin) dominate other firms with regard to both numbers of mergers and acquisitions and value of transactions. These two firms were also technical efficient over five years, while the other three firms were inefficient with declined value from 2007. In particular, three firms’ efficiency scores have decreased significantly between 2007-2008.
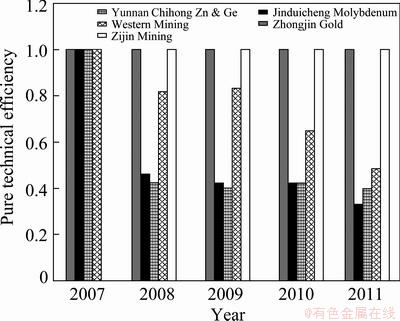
Fig. 1 Pure technical efficiency of 5 leading enterprises from 2007 to 2011
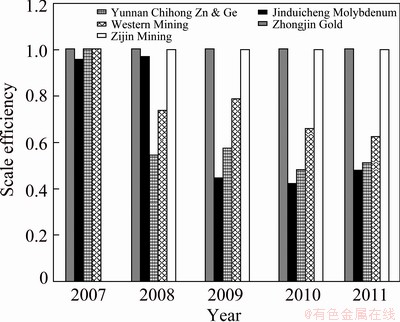
Fig. 2 Scale technical efficiency of 5 leading enterprises from 2007 to 2011
Table 4 Mergers and acquisitions from 2007 to 2011
3.2 Nonferrous metal smelting, pressing and processing firms
According to their total asset size in 2011, the top five leading companies in the nonferrous metal smelting, pressing and processing sector are Chinalco (Zhongguo Lvye), Jiangxi Copper (Jiangxi Tongye), Yunnan Copper (Yunnan Tongye), Zhongfu (Zhongfu Shiye) and Nanshan Aluminum (Nanshen Lvye).
Estimated pure technical efficiency and scale efficiency of nonferrous metal minerals mining firms are demonstrated in Table 5. As shown in Table 5, from 2007 to 2011, the average value of both pure technical efficiency and scale efficiency has experienced a dramatically fluctuation. Efficiency scores reached a peak in 2009 with a mean value of 0.707831 (pure technical efficiency) and 0.9999102 (scale efficiency) respectively, and then declined to a level slightly lower than that in 2007. Among the sampled firms, Chinalco (Zhongguo Lvye) as the largest firm by asset size has been efficient through 2007-2011. Chinalco is very active in asset restructure. The company has taken on a number of vertical integration activities along upstream and downstream chains since 2004. In the meanwhile, the company has engaged into the copper and rare earth market to operate horizontal and conglomerate mergers and acquisitions. As shown in Table 6, Chinalco has carried out 22 mergers and acquisitions between 2007 and 2011, involving over 415 million RMB. Yuan Jiangxi Copper (Jiangxi Tongye) has been efficient in pure technical efficiency after 2009, but it is offset by its inefficiency in scale efficiency over years, resulting in a relative low technical efficiency score.
Table 5 Estimated pure technical efficiency and scale efficiency of nonferrous metal smelting, pressing and processing firms
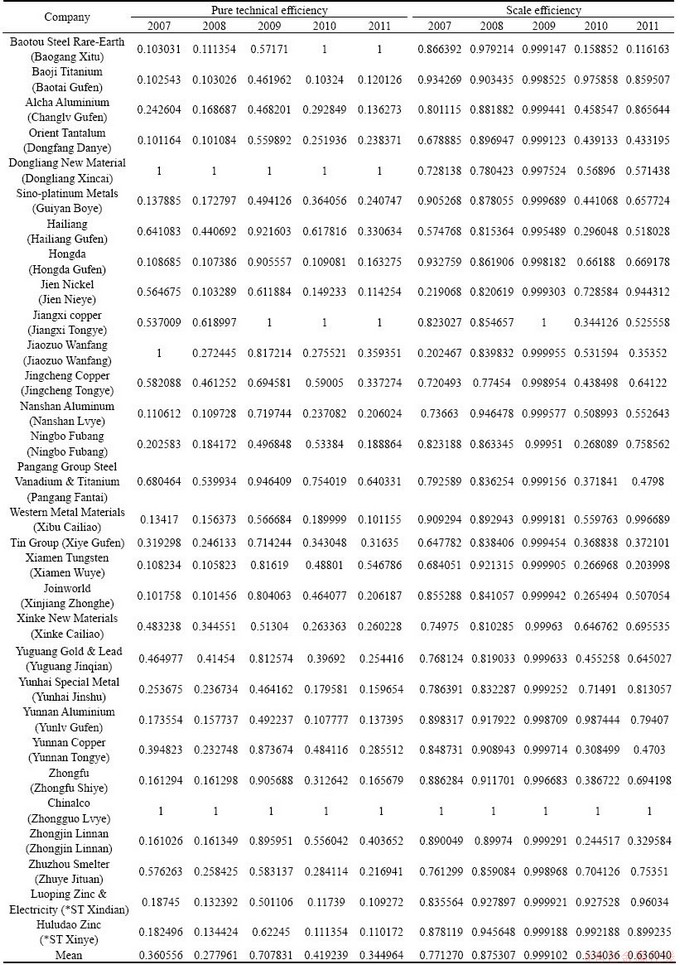
Table 6 Mergers and acquisitions from 2007 to 2011
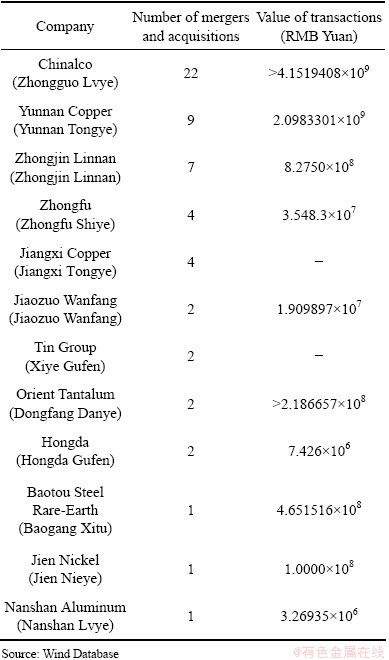
Other leading firms, including Yunnan Copper (Yunnan Tongye), Zhongfu (Zhongfu Shiye) and Nanshan Aluminum (Nanshan Lvye), have engaged with some mergers and acquisitions, but overall have had a poor performance. Their technical efficiency score fluctuated greatly during the period with a rising trend between 2007 and 2009, then a declining trend from 2009 to 2011 (Figures 3 and 4). By 2011, their pure technical efficiency scores were extremely low, showing a large gap away from the efficient production frontiers. Furthermore, their scale efficiency scores in 2011 were even lower than in 2007. It is interesting to observe that, two small firms (by asset size), the Dongliang New Material (Dongliang Xincai) and Baotou Steel Rare-Earth (Baogang Xitu), performed well. The Dongliang New Material as a firm focusing on new materials market was efficient in pure technical efficiency, having a relative high efficient score in scale economies over five years. Baotou Steel Rare-Earth (Baogang Xitu) is a leading firm in the Chinese Rare Earth market. The company achieved 100% pure technical efficiency in 2010 and 2011. However, it performed extremely weak in scale economy. This suggested where the company could improve in order to become efficient.
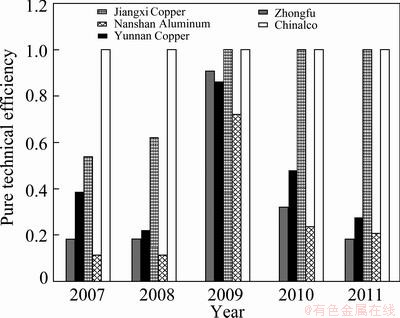
Fig. 3 Pure technical efficiency of 5 leading enterprises from 2007 to 2011
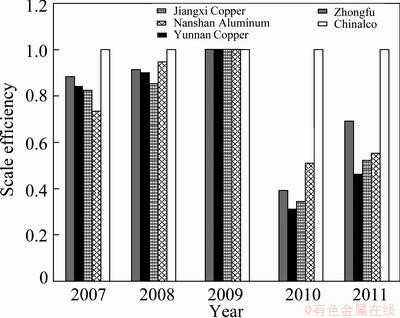
Fig. 4 Scale efficiency of 5 leading enterprises during 2007 to 2011
3.3 Discussion
To summarize, in both nonferrous metal minerals mining sector and nonferrous metal smelting, pressing and processing sector, inefficient firms account for a large part of samples. And in spite of industrial consolidation strongly supported by the central government since 2009, the average value of efficiency score was low in recent years between 2009 and 2011. For most of the sampled firms, lower technical efficiency was mainly attributed to lower pure technical efficiency. As we mentioned before, pure technical efficiency measures could reflect resource inefficiency caused by lag in technology, poor management or mistakes in strategic decision-makings, which suggests that nonferrous metals companies should focus on technical progress and improve management in order to become efficient.
DEA analysis also shows that efficiency score of nonferrous metal smelting, pressing and processing firms have fluctuated significantly during 2007-2009. There are a large number of small and medium-sized enterprises concentrated in this sector and competition is intensive. As one of key object of governance policy, it is very likely that the industry has been impacted more by industrial policy.
We also observe that, technical efficiency score of some firms which are actively engaged with industrial consolidation activities have declined after 2009, such as Western Mining (Xibu Kuangye), Yunnan Copper (Yunan Tongye) and Zhongjin Linnan (Zhongjin Linnan). Part of reasons could be that they are still in an early stage of asset integration. Asset integration, either vertical or horizontal, is composed of a process of organizational restructure, production restructure and institutional reform, which take times and likely cause a decline in resource productivity for the first few years of mergers and acquisitions. However, low technical efficiency score after mergers or acquisitions is also likely caused by irrational modes of industrial consolidation undertaken. XU et al [3] and LUO [18] have pointed out that in the process of government-led industrial consolidation, it is likely to have some mergers and acquisitions cross regions which did not take account of natural resource endowment. Some integrative activities were merely following policy guidance without considering businesses’ development needs. And in some regions conflicts between state-owned enterprises and local firms were evident, which directly impacted modes of industrial consolidation chosen.
4 Conclusions
1) By estimating technical efficiency (including pure technical efficiency and scale efficiency) of Chinese nonferrous metals firms during the period from 2007 to 2011, it was found that, in both nonferrous metal minerals mining sector and nonferrous metal smelting, pressing and processing sector, numbers of technical inefficient firms are much more than efficient ones. And for most of the sampled firms, lower technical efficiency was mainly attributed to lower pure technical efficiency. Therefore, nonferrous metals companies should focus on technical progress and improve management in order to become efficient. Moreover, in spite of industrial consolidation strongly supported by the central government and widely undertaken in the industry since 2009, pure technical efficiency and scale efficiency scores of most of sampled firms have declined more or less between 2007 and 2011.
2) Part of leading firms by asset size were able to maintain 100% efficiency score, but some other leading firms have significantly lowered their technical efficiency in recent years, far away from the efficient production frontiers. It is worth pointing out that a few of leading firms, including Chinalco (Zhongguo Lvye), Zijin Mining (Zijin Kuangye) and Zhongjin Gold (Zhongjin Huangjin), scored the best performance all through the research period. This might be relevant to their development paths. Taking Chinalco (Zhongguo Lvye) for an example, if tracing back to its development history, the company has started to carry out cross-region and cross-ownership integration activities since 2004. Early engagement in mergers and acquisitions seems to positively contribute to concentration of advantage resources and coordinated development of management and technology.
3) DEA analysis shows how much inefficient firms need to improve their productivity in order to become efficient. Some of suggestions are as follows: Chinese nonferrous metal firms should focus on improving their pure technical efficiency in order to enhance their technical efficiency. To do so, firms need to strengthen their management capacity, cut down decision-making mistakes and improve utilization rate of resources. One needs to pay attention to leading roles of top large firms. It is meaningful to cultivate industrial core competitiveness through knowledge innovation of leading firms, as well as to booster technical progress of small and medium-sized enterprises through those firms’ spillover effect. Government-led industrial consolidation need to be transferred towards market led activities. Only by doing so, the process of industrial consolidation will generate expected returns on structural optimization.
References
[1] General Office of the State Council. The Non-ferrous metals industry revitalization plan [EB/OL]. http:// www.gov.cn/, 2009-05-11. (in Chinese)
[2] LU La-chang. Research on key issues of industrial integration [J]. Journal of Guangzhou University, 2004, 3(8): 27-30. (in Chinese)
[3] XU Fang-yan, CHEN Shu-ming, GONG Ming-xi, DENG Shan-shan. On the integration and development of nonferrous mineral resources [J]. Mining Research and Development, 2008(6): 84-87. (in Chinese)
[4] LIN Qing-song, LI Shi. Theory of enterprise efficiency and efficiency of Chinese enterprise [J]. Economic Research Journal, 1996(7): 73-80. (in Chinese)
[5] FARRELL M J. The measurement of productive efficiency [J]. Journal of the Royal Statistic Society, 1957, 120(3): 253-281.
[6] ZHENG Ming-gui, XIE Ying-liang. Overall economic benefit assessment on China’s nonferrous metal industry based on DEA model [J]. China Mining, 2010(2): 33-36. (in Chinese)
[7] ZHENG Chun-mei, CHAI Jing. Efficiency evaluation of the non-ferrous metals industry in some provinces—Based on data envelopment analysis [C]//The 8th China Nonferrous Metals Association, Conference Proceedings. Beijing, 2010: 643-648. (in Chinese)
[8] MA Zhang-xin. Application of data envelopment analysis to economics and management research in China [J]. Chinese Journal of Management, 2010, 7(5): 785-789. (in Chinese)
[9] BERGER A N, HUMPHREY D B. Efficiency of financial institutions: international survey and directions for future research [J]. European Journal of Operational Research, 1997, 98(4): 175-212.
[10] XIE Qun, YUAN Xiao-zhe. Comparative studies on methods of technical efficiency frontier analysis [J]. Industrial Technology & Economy, 2009, 28(3): 131-134. (in Chinese)
[11] AIGNER D, LOVELL C, SEHMIDT P. Formulation and estimation of stochastic frontier production models [J]. Journal of Econometrics, 1977, 6(1): 21-38.
[12] CHARNES A, COOPER W W, RHODES E. Measuring the efficiency of decision making unit [J]. European Journal of Operational Research, 1978, 2(6): 429-444.
[13] BANKER R, CHARNES A, COOPER W W. Some models for estimating technical and scale inefficiencies in data envelopment analysis [J]. Management Science, 1984, 30(9): 1078-1092.
[14] FARE R, LOVELL C. Measuring the technical efficiency of production [J]. Journal of Economic Theory, 1978, 19: 150-162.
[15] WEI Quan-ling, LIU Qi-yun, HU Xian-you. Quantitative economics [M]. Beijing: The Chinese People’s University Press, 1999. (in Chinese)
[16] YAO Shu-jie, HAN Zhong-wei, FENG Gen-fu. On technical efficiency of China’s insurance industry after WTO accession [J]. China Economic Review, 2007, 18: 66-86.
[17] WANG Jian-qiang, YANG Jian-jun. Investment efficiency evaluation based on the DEA model [J]. Science Research Management, 2010, 34(4): 74-80. (in Chinese)
[18] LUO Xiao-nao. Thoughts on the dilemma of the integration of mineral resources [J]. China Natural Resources Economy, 2011, 23(11): 30-32. (in Chinese).
危 平1,2,唐慧泉1,陈 瑶1,陈晓红1
1. 中南大学 商学院,长沙 410083;
2. 中南大学 金属资源战略研究院,长沙 410083
摘 要:自2009年以来,我国有色金属产业在政府推动下开展了行业整合。在此,对我国2007-2011年间有色金属企业的技术效率及其变动进行研究。在以有色金属上市公司作为研究样本的基础上,采用DEA的方法分别测算有色金属矿釆选企业和有色金属冶炼及压延加工企业的技术效率。研究发现,两个行业,无论是纯技术效率还是规模效率,无效企业居多。行业纯技术效率和规模效率均值在2009年之后偏低。其中,有色金属冶炼及压延加工企业效率值的波动较大。少数龙头企业保持着行业内相对有效的纯技术效率和规模效率,但大多数龙头企业的技术效率值则在2009年之后出现了大幅度的下降。
关键词:行业整合;有色金属企业;数据包络分析法;技术效率;规模效率;企业集团
(Edited by Hua YANG)
Foundation item: Project (70921001) supported by the National Natural Science Foundation of China; Project (NCET-10-0799) supported by Program for New Century Excellent Talents in University, China; Projects (11YJA790158) supported by Humanities and Social Sciences Planning Fund by Chinese Ministry of Education
Corresponding author: Ping WEI; Tel: +86-731-88877723; E-mail: pwei@csu.edu.cn
DOI: 10.1016/S1003-6326(13)62800-9

