
J. Cent. South Univ. (2018) 25: 2025-2039
DOI: https://doi.org/10.1007/s11771-018-3892-7

Health monitoring and comparative analysis of time-dependent effect using different prediction models for self-anchored suspension bridge with extra-wide concrete girder
ZHOU Guang-pan(�ܹ���)1, LI Ai-qun(�Ⱥ)1, 2, LI Jian-hui(���)3, DUAN Mao-jun(��ï��)3
1. School of Civil Engineering, Southeast University, Nanjing 210096, China;
2. Beijing Advanced Innovation Center for Future Urban Design, Beijing University of Civil Engineering and Architecture, Beijing 100044, China;
3. School of Civil Engineering, Nanjing Forestry University, Nanjing 210037, China
 Central South University Press and Springer-Verlag GmbH Germany, part of Springer Nature 2018
Abstract: The structural health status of Hunan Road Bridge during its two-year service period from April 2015 to April 2017 was studied based on monitored data. The Hunan Road Bridge is the widest concrete self-anchored suspension bridge in China at present. Its structural changes and safety were evaluated using the health monitoring data, which included deformations, detailed stresses, and vibration characteristics. The influences of the single and dual effects comprising the ambient temperature changes and concrete shrinkage and creep (S&C) were analyzed based on the measured data. The ANSYS beam finite element model was established and validated by the measured bridge completion state. The comparative analyses of the prediction results of long-term concrete S&C effects were conducted using CEB-FIP 90 and B3 prediction models. The age-adjusted effective modulus method was adopted to simulate the aging behavior of concrete. Prestress relaxation was considered in the stepwise calculation. The results show that the transverse deviations of the towers are noteworthy. The spatial effect of the extra-wide girder is significant, as the compressive stress variations at the girder were uneven along the transverse direction. General increase and decrease in the girder compressive stresses were caused by seasonal ambient warming and cooling, respectively. The temperature gradient effects in the main girder were significant. Comparisons with the measured data showed that more accurate prediction results were obtained with the B3 prediction model, which can consider the concrete material parameters, than with the CEB-FIP 90 model. Significant deflection of the midspan girder in the middle region will be caused by the deviations of the cable anchoring positions at the girder ends and tower tops toward the midspan due to concrete S&C. The increase in the compressive stresses at the top plate and decrease in the stresses at the bottom plate at the middle midspan will be significant. The pre-deviations of the towers toward the sidespan and pre-lift of the midspan girder can reduce the adverse influences of concrete S&C on the structural health of the self-anchored suspension bridge with extra-wide concrete girder.
Key words: self-anchored suspension bridge; extra-wide concrete girder; health monitoring; concrete shrinkage and creep; prediction model; ambient temperature change; safety evaluation
Cite this article as: ZHOU Guang-pan, LI Ai-qun, LI Jian-hui, DUAN Mao-jun. Health monitoring and comparative analysis of time-dependent effect using different prediction models for self-anchored suspension bridge with extra-wide concrete girder [J]. Journal of Central South University, 2018, 25(9): 2025�C2039. DOI: https://doi.org/10.1007/s11771- 018-3892-7.
1 Introduction
Self-anchored suspension bridge with concrete girders is well known for its economy, elegance, and reasonable force transmission form, and is being increasingly preferred among the numerous types of bridges [1�C3]. In recent years, increasing traffic volumes have pushed forward the girder width to 50 m or more to meet the increasing demand for vehicle lanes. The stress states of the structural details in the main girder will become more complicated with increasing girder width. Moreover, inevitable structural damages caused by vehicle loads, seismic loads, and time-dependent effects will affect the safety and durability of the bridge [4]. Therefore, structural health monitoring (SHM) and safety evaluations during the operation period are very necessary.
The mechanical properties of bridges are usually captured using methods such as numerical simulation [5], lab experiment [6], and field measurement [7]. Measuring devices embedded in the bridge can obtain the exact stress states of the structure details, which reflect the actual bridge state. It is appropriate to integrate the numeric simulation predictions and field health monitoring data. Wireless smart sensors are widely used for health monitoring because of their high convenience, flexibility, and robust data management ability [8, 9]. In addition, a water pipe system was creatively used by LIU et al [10] in the deformation monitoring of a suspension bridge. Interdisciplinary techniques including acoustic emission technique and ultrasonic monitoring techniques have been introduced in the SHM for civil infrastructures [11, 12]. Moreover, the effects of fatigue of the welded details [13], vehicle loads [14], and wind velocity [15] have been investigated widely. In addition, time-dependent effects including concrete shrinkage & creep (S&C) and ambient temperature changes are also important influencing factors, especially in a self-anchored suspension bridge with extra-wide concrete girder [16, 17].
In this work, health monitoring data pertaining to the first two-year period from April 2015 to April 2017 and finite element simulation predictions were integrated to study the changes in the structural alignments and internal forces of the Hunan Road Bridge, which is currently the widest self-anchored suspension bridge in China and was opened to traffic on May 1, 2015. The effects of concrete S&C and ambient temperature changes were analyzed based on the measured data. The ANSYS beam finite element model was established and validated by using the measured bridge completion state. The comparative analyses of the predicted concrete S&C effects were conducted using the CEB-FIP 90 prediction model [18, 19] and B3 prediction model [20]. Stepwise calculation was realized by the adoption of the age-adjusted effective modulus method [21].
2 Hunan Road Bridge
The span arrangement of the Hunan Road Bridge is 218 m. The concrete main girder with a width of 52 m is currently the widest among similar self-anchored suspension bridges in China. The longitudinal and transverse slopes of the main girder are 2.5% and 1.5%, respectively. The lateral distance between two cable planes is 31.7 m, and the rise-span ratios of the midspan and sidespan are 1/5.276 and 1/12.965, respectively. The towers are connected by a crossbeam and transversely assisted by the side towers. The crossbeams in the girder are densely arranged with an interval of 5 m corresponding to the hangers. The global layout of the Hunan Road Bridge and the cross section of the girder are shown in Figures 1 and 2, respectively. Identifiers beginning with CS represent the analysis control sections at the towers, endpoints of the girder, midpoints of the side span, and quarter points of the midspan. The serial numbers of the hangers from west to east are DS1-N�CDS37-N and DS1-S�CDS37-S on the north and south sides, respectively.
3 Health monitoring system
The layouts of the SHM system of the Hunan Road Bridge are shown in Figure 3. The establishment of the SHM system was initiated in the construction control period. The data monitored included the ambient temperature, structural temperature field, and structural responses. The structural responses included deformations, internal forces, and vibration characteristics. The health monitoring data were measured periodically every three months.

Figure 1 Global layout of Hunan Road Bridge (Unit: m)
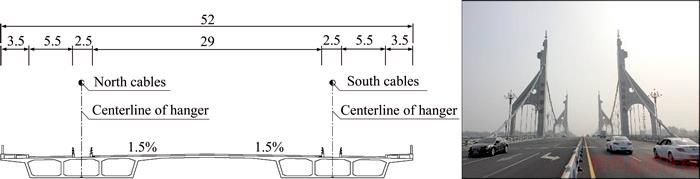
Figure 2 Cross section of extra-wide girder (Unit: m)
4 Simulation and prediction models
4.1 Finite element model
The finite element model of the Hunan Road Bridge is shown in Figure 4, which was established using ANSYS software. The internal forces of the hangers and the alignments of the cable were obtained by conducting iterative calculations assisted by analytical computing software for a suspension bridge [22] and construction monitoring data [23].
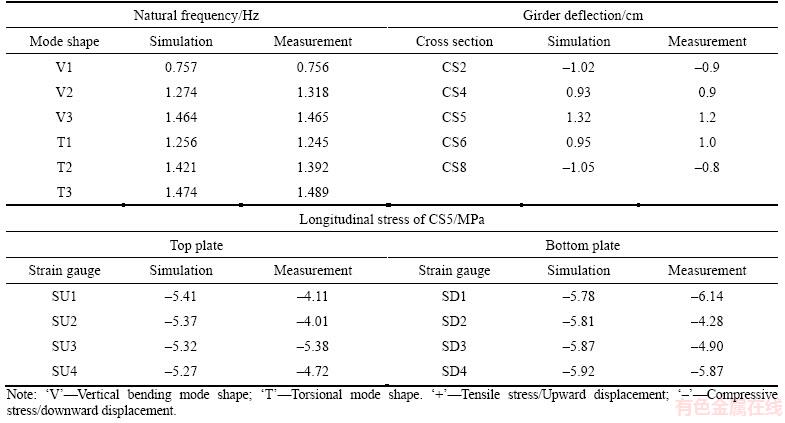
The Timoshenko beam, which can consider torsional warpage, was adopted to simulate the towers, crossbeams, and girder. The stresses at the hotspots of the cross section were obtained by controlling the section mesh, which greatly improved the calculation efficiency. The link element that only considered the tension was used to simulate the cables, hangers, and prestressed steel bundles. The internal forces of the cables and hangers were determined by defining the initial strains and the prestressed tendons. The compression of the girder and towers was simulated by changing the temperatures of the rigid arms, which connected the cables to the girder and the tower tops. The degree of freedom (DOF) between the girders, towers, and the approach bridges was constrained according to the actual bearing types. An additional quality element was adopted to simulate the weights of the deck pavements, saddles, clips, approach bridges, and decorative segments of the towers. The FE model was validated by comparing the simulated results, including the natural frequencies, deflections, and stresses obtained after the initial equilibrium analysis, with the measured data at the bridge completion state, as shown in Table 1. The similarities show that the actual final state of the Hunan Road Bridge was accurately realized by the simulation model.
4.2 Prediction models of concrete S&C effects
The CEB-FIP 90 prediction model [18, 19] and B3 prediction model [20] were adopted to conduct the comparative analyses of concrete S&C effects to ensure reliable predictions. In addition to the conventional input, the B3 model can consider concrete composition parameters such as water- cement ratio, which makes it more suitable for diverse practical applications, whereas the FIP 90 model is too standard. Moreover, the B3 model is optimally fitted based on numerous available lab experiments and field measurement reports from all over the world and continues to be updated.
The age-adjusted effective modulus method [21] was used to realize stepwise calculation. An approximately linear relationship appears between the final deformation of concrete caused by creep and the initial elastic deformation when the concrete stress does not exceed 40% of the ultimate strength, and the superposition principle can be used to calculate the strain caused by the stepwise application of stress. The relationship between the strain increment ����c(i, i�C1) and stress increment ����c(i, i�C1) caused by concrete creep during the time interval of ti is given by

 (1)
(1)
 (2)
(2)
where E is the elastic modulus, subscript c represents the creep effect, ��(i,i�C1) and ��(i,i�C1) are the creep and aging coefficients, respectively. The expression for the age-adjusted effective modulus E��(ti, ti�C1) is given by
 (3)
(3)
The elastic modulus values of the concrete at the girder and towers were replaced by the age-adjusted effective modulus E��(ti, ti�C1) during each time interval. Sequential calculation and gradual accumulation were performed to obtain the structural internal force and deformation caused by concrete creep of each step. The shrinkage effects of the concrete were calculated by updating the temperature applied on the concrete based on the shrinkage strain of each step.
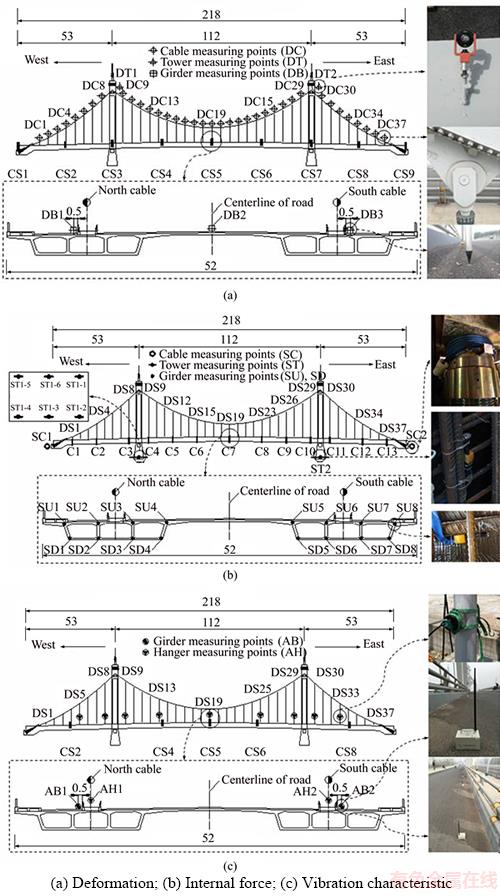
Figure 3 Layouts of SHM system:(Unit: m)
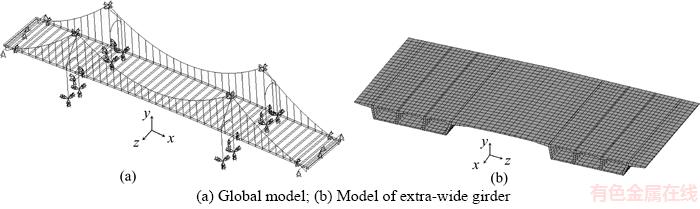
Figure 4 Finite element model:
Table 1 Verification of finite element model
The comparisons of short-term shrinkage strains and one-year-period structural deformations obtained by the two prediction models adopted here are shown in Tables 2 and 3, respectively. The age when drying began was 7 days, and the serial numbers of the cross sections and strain gages are the same as in Figure 3. The comparison results show that the results of the B3 model are closer to the measured data than that of the CEB-FIP 90 model.
Table 2 Comparison of short-term shrinkage strain
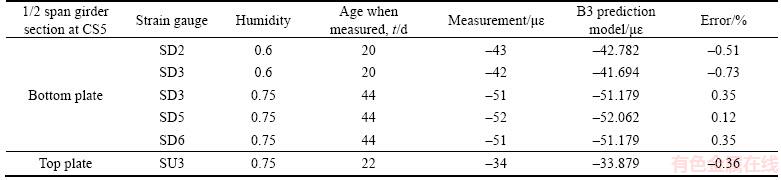
Table 3 Comparison of one-year-period structural deformation

5 Measured structural changes
5.1 Structural deformation
The evolutions of structural deformations during the two-year operation period from April 2015 to April 2017 were obtained by comparing the deformation monitoring data measured on April 15, 2015 (the initial state), October 15, 2015, April 15, 2016, and April 15, 2017. The time interval of 3�C4 P.M. during the foregoing dates was selected to obtain the filed measurements; during this interval, traffic peaks were avoided and live load effects were small and stochastic. The same ambient temperature of 28��C was measured at the aforementioned time so that the structural alignment changes were mainly caused by concrete S&C effects.
5.1.1 Cable alignments
The cable alignment variations measured after the first half-year, one year, and two years are shown in Figure 5. Comparisons with the deformation magnitudes shown in Figures 5(a)�C(c) indicate a multi-level growth trend of the amount of variation during the two-year operation period. However, the evolution trends are the same. The cable anchoring positions at the girder ends and at the tower tops offset toward the midspan due to the effect of concrete S&C and the unbalanced horizontal cable forces, respectively. The cables at the middle sidespan rose more significantly than the ones close to the girder ends. The cables at the middle midspan dropped significantly, whereas the ones between the towers and the quarter points of CS4 and CS6 rose conversely. The inflection points of the main cables appeared at CS4 and CS6 points because of the effect of the cable catenary characteristics, which also resulted in relatively significant deformations at DC5, DC19, and DC33.
5.1.2 Girder alignments
Figure 6 shows the comparisons between the measured variations in the girder alignments on three of the foregoing dates. The variations displayed a multi-level growth trend with the operation period. Regarding the alignment changes measured after the first half-year and one year, the sidespan girder rose and the middle midspan girder dropped significantly. The girder deformations between the towers and the quarter points of CS4 and CS6 in the midspan were characterized by a transversely opposite trend. The girder along the road centerline dropped due to concrete S&C, whereas the girder along the bicycle lanes rose conversely because of its relatively closer distance to the hangers and the rise of the cable. The occurrences of girder torsional deformations reflect the spatial effect of the extra-wide concrete girder. The deformation trends of the alignment changes measured after two years became uniform, and they were manifested as rise in the sidespan girder and general drop in the midspan girder.
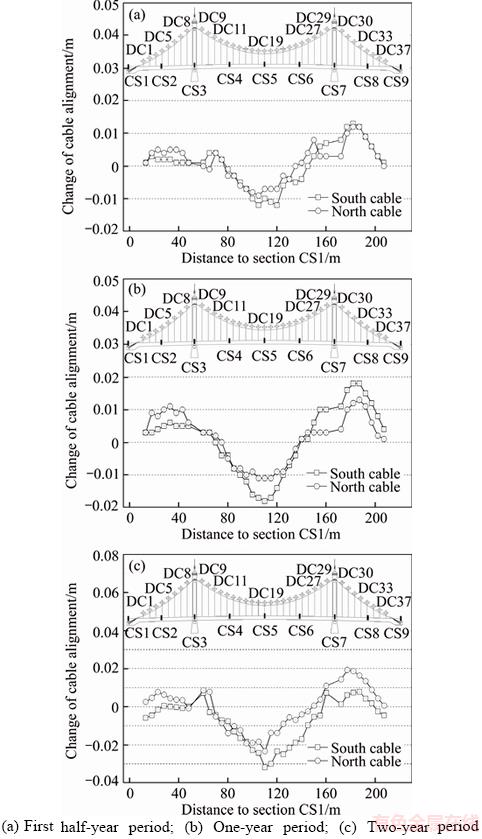
Figure 5 Measured changes in cable alignments during two-year period from April 2015 to April 2017:
5.1.3 Tower top deformations
The measured deformations of the four tower tops are shown in Table 4. The settlement of the towers after the two-year operation period was smaller than 1 cm. The transverse tower deviations were more significant than the longitudinal ones. The shearing center of the girder cross section was closer to the road centerline than to the hanger centerline. The southwest tower had an offset of 2.7 cm toward the road centerline during the construction period. The towers continued to offset toward the road centerline according to the measured data after two years. The stress states of the tower roots are noteworthy during the long-time SHM process. In the longitudinal direction, the towers offset toward the midspan, which is in line with the analysis conclusions in Section 5.1.1.

Figure 6 Measured changes in girder alignments during two-year period from April 2015 to April 2017:
Table 4 Measured tower deformation

Pre-deviations of the towers toward the sidespan should be set in advance by adjusting the hanger forces during the system transformation process, which can help in improving the health status of the towers.
5.2 Vibration frequency of girder
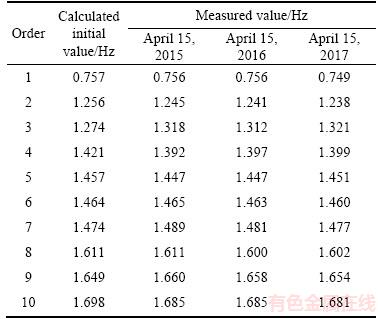
The changes in the girder vibration frequencies during the two-year period were obtained by comparing the girder vibration data measured on April 15, 2015, April 15, 2016, and April 15, 2017. As we can see from the calculated results of the FE model and measured data shown in Table 5, the frequency changes were small, and the girder structural stiffness and mass were stable during the two-year operation period.
5.3 Internal force
The evolutions of structural internal forces during the two-year operation period were obtained by comparing the internal force data measured on April 15, 2015, October 15, 2015, April 15, 2016, and April 15, 2017. The ambient temperatures of these four dates were the same, and the changes were mainly caused by the concrete S&C effects.
5.3.1 Cable forces
As we can see from the measured changes in the cable force shown in Table 6, although the cable forces decreased in comparison with the bridge completion state, the cable system was stable during the two-year period because the reductions were less than 2%.
Table 5 Calculated and measured girder vibration frequency
5.3.2 Transverse distributions of girder stress changes
The measured changes in the girder longitudinal stresses during the two-year operation period are shown in Figure 7. The stress changes in the middle sidespan girder are shown in Figure 7(a). The concrete shrinkage and elastic compression were caused by huge horizontal cable forces during the first half-year, and the compressive stresses of the middle sidespan girder generally increased. Regarding the subsequent stress changes at the girder top plate in the middle sidespan, the cable anchoring positions offset toward the midspan after the first year due to the concrete S&C effect, and the top plate stresses decreased slightly due to the rise of sidespan girder and cables. Then, the top plate stresses increased after the second year under the combined effects of girder elastic compression and concrete S&C. Regarding the stress changes at the girder bottom plate in the middle sidespan, the compressive stresses at the measurement points such as SD2, SD3, SD6, and SD7, which are close to the cable centerline, decreased slightly after the first year due to the decreasing horizontal cable forces whereas the stresses at SD1, SD4, SD5, and SD8, which are far away from the cable centerline, increased continually because the effects of the decrease in the cable force were relatively weak. This phenomenon of uneven transverse distributions of stress changes reflects the significant spatial effect of the extra-wide girder. The compressive stresses at the girder bottom plate in the middle sidespan increased after the second year because of the rise of the sidespan girder.
Table 6 Measured cable force and change

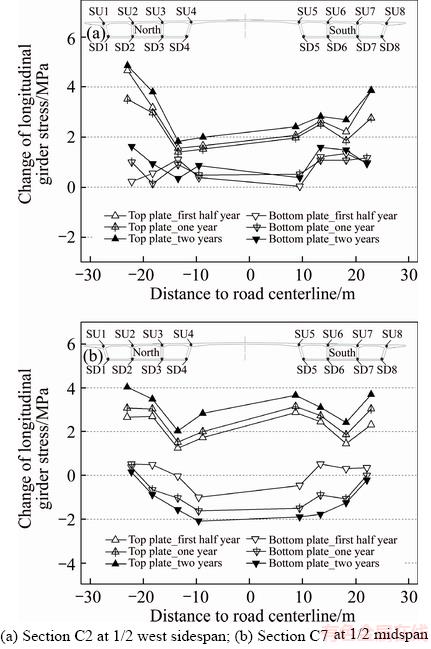
Figure 7 Measured changes in girder longitudinal stresses during two-year period from April 2015 to April 2017:
The change trends in the stress variations of the middle midspan girder shown in Figure 7(b) were uniform, which were manifested as continuous increase in the compressive stresses at the top plate due to significant deflection of the midspan girder, and insignificant changes in the stresses at the bottom plate during the first half-year followed by continuous decrease after the first and second years.
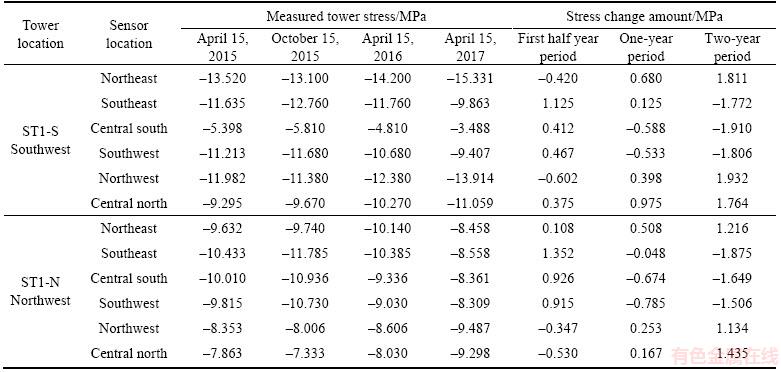
5.3.3 Tower root stress state
For the sake of brevity, the measured stresses and changes in the west tower roots during the two-year operation period are shown in Table 7. The tower roots were in the status of whole section compression. In addition, the variations in the compressive stresses after the second year were within the safe range from -2.0 to 2.0 MPa.
5.4 Effects of ambient temperature changes
The structural changes caused by seasonal ambient cooling and warming were studied by comparing the monitoring data measured on April 15, 2015, December 24, 2015, and April 15, 2016. The measured ambient temperatures were 28 ��C,2 ��C, and 28 ��C, respectively. The concrete S&C effects between April 15, 2015 and December 24, 2015 were deducted approximately based on the data differences between April 15, 2015 and October 15, 2015, which were characterized by the same ambient temperature of 28 ��C. Non- conservative variations were obtained by this data processing procedure, and the change trend analysis would not have been affected. Similarly, the concrete S&C effects between December 24, 2015 and April 15, 2016 were deducted approximately based on the measured data differences between October 15, 2015 and April 15, 2016. The ambient temperature on these two dates was 28 ��C, and conservative variations were obtained.
Table 7 Measured tower root stresses and its changes
The measured changes in the alignments and girder longitudinal stresses are shown as Figure 8. As we can see from Figures 8(a) and (b), considering the seasonal ambient cooling process from April 15, 2015 to December 24, 2015, the alignment changes in the cable and girder were significant and synchronous, which were manifested as rise in the cables and girder at the midspan due to decrease in the cable catenary sag caused by the cold contractions of steel wires and decrease in the cable length. The sidespan cables and girder dropped due to the offsets of the cable anchoring positions at the girder ends toward the midspan because of concrete cold contractions. The alignment changes during the seasonal ambient warming process from December 24, 2015 to April 15, 2016 were also synchronous. The thermal expansions of the steel wires and increase in the cable length were caused by the warming; the cables and girder at midspan dropped simultaneously due to the increase in the cable catenary sag. The sidespan cables and girder rose due to the deviations of the cable anchoring positions at the girder ends toward the expansion joints because of thermal expansion of concrete.
As we can see from the measured changes of girder longitudinal stresses shown in Figure 8(c), the girder compressive stresses generally decreased under seasonal cooling and increased under seasonal warming due to concrete thermal deformation and constraints imposed by expansion joints. The decrease in stress at the top plate of the middle sidespan under cooling and the increase in stress at the bottom plate of the middle sidespan under warming were more significant than that at other regions. The health monitoring data for the stress changes in these regions when extreme seasonal temperature changes occur are noteworthy. The uneven girder stress changes at the side and middle girder webs of the same cross section reflect the temperature gradient effect and spatial effect of the extra-wide girder.
5.5 Dual time-dependent effects
The monitoring data measured on April 15, 2015, December 24, 2015, and April 15, 2016 were selected to investigate the influences of the dual effects comprising concrete S&C and seasonal ambient temperature changes. The measured ambient temperatures of the three foregoing dates were 28 ��C, 2 ��C and 28 ��C, respectively.
The measured changes in the alignments and girder longitudinal stresses are shown in Figure 9. As we can see from Figures 9(a) and (b), the alignment changes of the cable and girder due to the dual effects comprising concrete S&C and seasonal ambient cooling from April 15, 2015 to December 24, 2015 were asynchronous, which were manifested by the general rise in cable alignments and drop in the middle sidespan girder because of concrete cold contraction. The change trends caused by the single concrete S&C and single ambient cooling are opposite. The magnitudes of the alignment changes caused by the dual effects were generally smaller than that caused by each factor. The alignments changes due to the dual effects comprising concrete S&C and seasonal ambient warming from December 24, 2015 to April 15, 2016 were synchronous, which were manifested as drop in the midspan alignments and rise in the sidespan alignments. The change trends caused by single concrete S&C and single ambient warming are the same. The magnitudes of the alignment change caused by the dual effects were significantly larger than the ones caused by each factor.
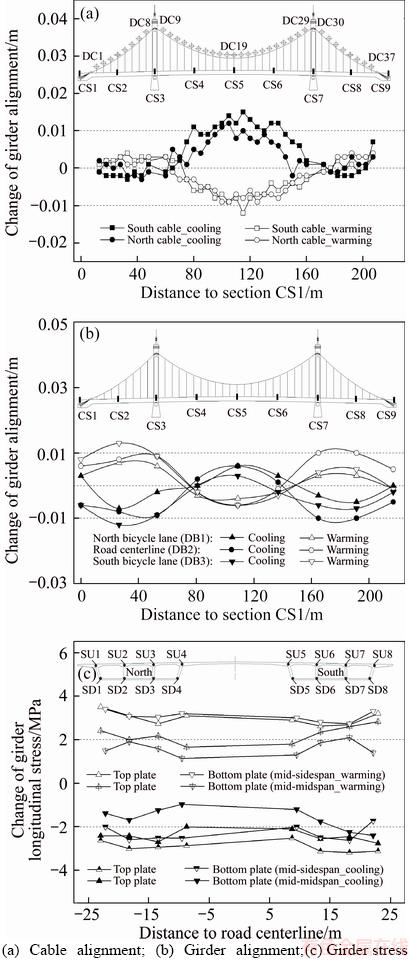
Figure 8 Measured changes in structural alignments and girder stresses caused by seasonal ambient temperature changes:
As we can see from the measured changes in the girder longitudinal stresses shown in Figure 9(c), the girder compressive stresses due to the dual effects comprising concrete S&C and seasonal ambient cooling generally decreased. The girder stress variations in the sidespan top plate and midspan bottom plate were bigger than that caused by each factor. The girder compressive stresses due to the dual effects comprising concrete S&C and seasonal ambient warming generally increased. The stress increments at the bottom plate of the sidespan girder and top plate of the midspan girder were significantly larger than that caused by each factor. The health monitoring data for the concrete tensile or compression failures in these regions under the combined effects of heavy vehicle loads, concrete S&C, and extreme seasonal temperature changes are noteworthy. The initial compressive stresses in these regions should be allocated reasonably using the pre-deviations of the towers toward the sidespan, girder camber, and pre-lift of the midspan girder, which can be beneficial to the long-term health status of the self-anchored suspension bridges with extra-wide concrete girder.
6 Comparative analyses of predicted concrete S&C effects
6.1 Structural deformation
The comparisons of the calculated deformations of the cable and cable anchoring points due to long-time concrete S&C, obtained by the FIP 90 and B3 prediction models, are shown in Figure 10. Similar change trends of cable deformations were predicted by these two models but the magnitudes differed. The elastic compression and S&C deformation of concrete will cause significant deviations of the cable anchoring positions at the girder ends toward the midspan and drop in the cable anchoring positions at the tower tops. Moreover, the longitudinal displacements of the cable anchoring positions at the tower tops toward the midspan due to unbalanced horizontal cable forces will result in significant vertical displacements of the middle midspan cable. The vertical displacements of the cable at 1/2 span after the first and second years, predicted with the FIP 90 prediction model, were -0.026 and -0.036 m, respectively. The corresponding predictions obtained with the B3 model were -0.018 and -0.027 m, respectively. In addition, as we can see from Figure 5, the measured data were -0.018 and -0.028 m, respectively. Moreover, the measured tower compression amounts are closer to the predicted vertical displacements of the cable anchoring points at the tower tops obtained with the B3 model, as shown in Table 4. The comparisons with the measured data show that more accurate prediction results were obtained by the B3 model than with the FIP 90 model.
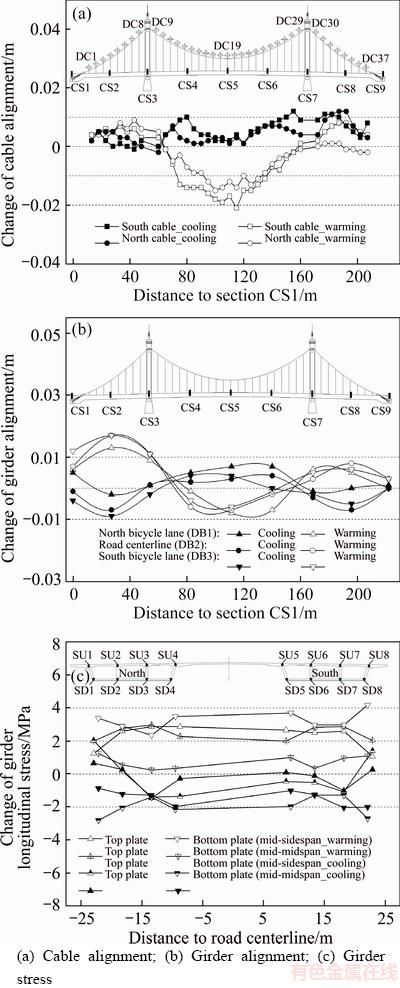
Figure 9 Measured changes in structural alignments and girder stresses caused by dual time-dependent effects:
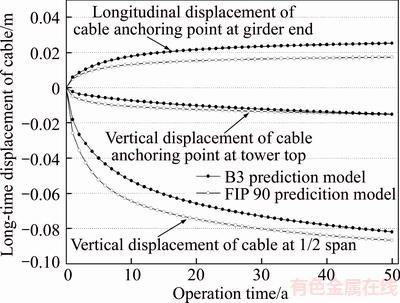
Figure 10 Comparison of calculated cable displacements
The comparisons of the calculated long-time changes in the girder alignments obtained with the FIP 90 and B3 prediction models are shown in Figure 11. Smaller magnitudes of girder deflections were predicted with the B3 model than with the FIP 90 model, which is more in line with the actual measurement. The deflections of the midspan girder will increase continually with the most significant degree of deflection at 1/2 span, and the sidespan girder will rise. In addition, the girder deflections show a change trend characterized by an initial rapid increase, which subsequently slows down.
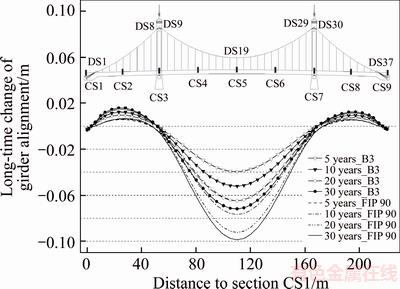
Figure 11 Comparison of calculated girder alignment changes
6.2 Internal force
The comparisons of the calculated long-term changes in the hanger and cable forces at 1/2 span are shown in Figure 12. In terms of the FIP 90 model, the calculated internal forces of the hanger and cable at 1/2 span will decrease by 4.2% and 4.6% after 50 years, respectively. The predictions obtained with the B3 model are 5.9% and 6.6%, respectively. For the sake of brevity and for conservative prediction, the long-term changes in the hanger forces calculated with the B3 model are shown in Figure 13. The hanger forces will decrease continually. The changes at the sidespan hangers are bigger than that at the midspan hangers, and the change at the sidespan hanger close to the tower is the biggest at -10.8% after 50 years.

Figure 12 Comparison of calculated hanger and cable forces at 1/2 span

Figure 13 Calculated changes of hanger forces using B3 model
The magnitudes of the predicted change in girder longitudinal stresses obtained with the FIP 90 model are bigger than that obtained with the B3 model because of bigger girder deformations, as shown in Figure 11. For the sake of conservative prediction, the calculated long-time changes in the girder longitudinal stresses obtained with the FIP 90 model are shown in Figure 14. As we can see from Figure 14(a), the compressive stresses of the girder top plates at the sidespan and midspan close to the towers will decrease, whereas that at the midspan between the quarter points of CS4 and CS6 will increase because of the cable catenary characteristics. As we can see from Figure 14(b), the compressive stresses at the bottom plates of the middle midspan and sidespan will decrease, and those at the girder close to the towers will increase. Although the measured girder compressive stresses were within the safe range, the stress evolutions of the middle midspan girder under the combined effects of heavy vehicle loads, concrete S&C, and extreme ambient warming are noteworthy. During the determination of a reasonable final state of the self-anchored suspension bridge, the middle midspan girder should be pulled up appropriately by adjusting the hanger forces during the system transformation. Thus, the girder compressive stress reserves can be allocated reasonably, which is conducive to the long-term health status of extra-wide concrete girder.
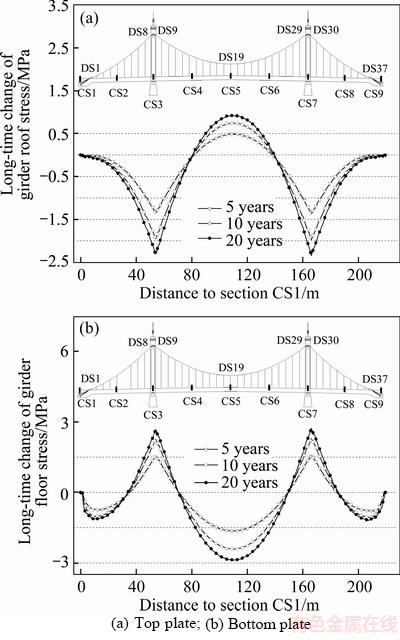
Figure 14 Calculated long-time changes in girder compressive stresses using FIP 90 model:
7 Conclusions
The significant contributions of this study are summarized as follows:
1) The safe structural status of the Hunan Road Bridge, which is currently the widest concrete self-anchored suspension bridge in China, during the first two-year operation period from April 15, 2015 to April 15, 2017, was reflected in its health monitoring data. The girder longitudinal stresses changed unevenly along the transverse direction, which reflects the significant spatial effect of the girder caused by its extra width. The structural stiffness and mass of the girder were stable with small changes in the girder vibration frequencies. The transverse tower deviations were more significant than the longitudinal deviations.
2) The measured deformations of the cable and girder at the middle midspan were significant after two years, which were caused by the movements of the cable anchoring positions at the girder ends and tower tops toward the midspan due to concrete S&C. Correspondingly, the increase in the compressive stresses at the top plate of the middle midspan girder and decrease in the compressive stresses at the bottom plate were recorded. In addition, the girder compressive stresses generally increased because of seasonal ambient warming and decreased under cooling. The compressive stress increased at the sidespan girder bottom plate and midspan girder top plate under extreme warming, as well as the stress decreased at the sidespan girder top plate and midspan girder bottom plate under extreme cooling are noteworthy during the long- term service life of the bridge. The uneven stress variations between the side and middle girder webs in the same section reflect the temperature gradient effect and spatial effect of the extra-wide girder. The deviations in the cable anchoring positions and midspan girder deflections caused by the time-dependent effects are also main factors influencing the stress and geometry evolutions of the self-anchored suspension bridges, especially those with an extra-wide concrete girder.
3) The comparisons between the health monitoring data and the prediction results obtained by the two prediction models for concrete S&C, namely, the FIP 90 and B3 models, show that the B3 model can produce more accurate prediction results. In addition, concrete S&C effects should be considered during the determination of the reasonable final state of the self-anchored suspension bridge. Appropriate girder camber, reasonable pre-deviations of the towers toward the sidespan, and pre-lift of the midspan girder should be set by adjusting the internal forces of the hangers close to the towers and the middle midspan during system transformation. Thus, the girder compressive stress reserves can be allocated reasonably, and the adverse effects of concrete S&C on the safety of concrete self-anchored suspension bridge can be reduced effectively.
References
[1] LI Jian-hui, LI Ai-qun. Calculation, monitoring and assessment of spatial cable self-anchored suspension bridges [M]. Beijing: China Communication Press, 2011. (in Chinese)
[2] SUN J, MANZANAREZ R, NADER M. Suspension cable design of the new San Francisco-Oakland Bay Bridge [J]. Journal of Bridge Engineering, 2004, 9(1): 101-106. DOI: 10.2749/222137802796335802.
[3] KIM H K, LEE M J, CHANG S P. Determination of hanger installation procedure for a self-anchored suspension bridge [J]. Engineering Structures, 2006, 28(7): 959-976. DOI: 10.1016/j.engstruct.2005.10.019.
[4] LI Ai-qun, MIAO Chang-qing, LI Zhao-xia. Health monitoring system for the Runyang Yangtse River Bridge [J]. Journal of Southeast University (Natural Science Edition), 2003, 33(5): 544-548. (in Chinese)
[5] LI Ai-qun, WANG Hao. Stress analysis on steel box girders of super-long-span suspension bridges with sub model method [J]. Engineering Mechanics, 2007, 24(2): 80-84. (in Chinese)
[6] WAN Li-jun, SHAN Wei, YUAN Jian-xin. Experimental study on static characteristics model of self-anchored suspension bridge [J]. Journal of Highway and Transportation Research and Development, 2014, 31(6): 108-114. (in Chinese)
[7] CHOU C C, UANG C M, SEIBLE F. Experimental evaluation of compressive behavior of orthotropic steel plates for the new San Francisco-Oakland Bay Bridge [J]. Journal of Bridge Engineering, 2006, 11(2): 140-150. DOI: 10.1061/(asce)1084-0702(2006)11:2(140).
[8] SPENCER B F Jr, RUIZ-SANDOVAL M, KURATA N. Smart sensing technology: Opportunities and challenges [J]. Structural Control and Health Monitoring, 2004, 11: 349-368. DOI: 10.1002/stc.48.
[9] LI Jian, MECHITOV K A, KIM R E, SPENCER B F Jr. Efficient time synchronization for structural health monitoring using wireless smart sensor networks [J]. Structural Control and Health Monitoring, 2016, 23: 470-486. DOI: 10.1002/stc.1782.
[10] LIU Yang, DENG Yang, CAI C S. Deflection monitoring and assessment for a suspension bridge using a connected pipe system: A case study in China [J]. Structural Control and Health Monitoring, 2015, 22(12): 1408-1425. DOI: 10.1002/stc.1751.
[11] DENG Yang, LIU Yang, FENG Dong-ming. Monitoring damage evolution of steel strand using acoustic emission technique and rate process theory [J]. Journal of Central South University, 2014, 21(9): 3692-3697. DOI: 10.1007/s11771-014-2352-2.
[12] MUTLIB N K, BAHAROM S B, EL-SHAFIE A, NUAWI M Z. Ultrasonic health monitoring in structural engineering: Buildings and bridges [J]. Structural Control and Health Monitoring, 2016, 23: 409-422. DOI: 10.1002/stc.1800.
[13] DENG Yang, DING You-liang, LI Ai-qun, ZHOU Guang-dong. Fatigue reliability assessment for bridge welded details using long-term monitoring data [J]. Science China: Technological Sciences, 2011, 54(12): 3371-3381. DOI: 10.1007/s11431-011-4526-6.
[14] ZHOU Guang-pan, LI Ai-qun, LI Jian-hui, DUAN Mao-jun. Test and numerical investigations on static and dynamic characteristics of extra-wide concrete self-anchored suspension bridge under vehicle loads [J]. Journal of Central South University, 2017, 24(10): 2382-2395. DOI: 10.1007/s11771-017-3650-2.
[15] DENG Yang, DING You-liang, LI Ai-qun, ZHOU Guang-dong. Prediction of extreme wind velocity at the site of the Runyang Suspension Bridge [J]. Journal of Zhejiang University: Science A, 2011, 12(8): 605-615. DOI: 10.1631/jzus. a1000446.
[16] SALAWU O S. Detection of structural damage through changes in frequency: A review [J]. Engineering Structures, 1997, 19(9): 718-723. DOI: 10.1016/s0141-0296(96)00149- 6.
[17] HJELMSTAD K D, SHIN S. Damage detection and assessment of structures from static response [J]. Journal of Engineering Mechanics, 1997, 123(6): 568-576. DOI: 10.1061/(asce)0733-9399(1997)123:6(568).
[18] JTG D62-2004. Code for design of highway reinforced concrete and prestressed concrete bridges and culverts [S]. China Communication Press, 2004. (in Chinese)
[19] CEB-FIP 90. Model code: 1990 [S]. Comite Euro- International Du Beton, 1991. DOI: 10.1680/ceb-fipmc1990.35430.
[20] BAZANT Z P, BAWEJA S. Creep and shrinkage prediction model for analysis and design of concrete structures-model B3 [J]. Material Structure, 1995, 28(6): 357-365. DOI: 10.1007/bf02473152.
[21] BAZANT Z P. Prediction of concrete creep effects using age-adjusted effective modulus method [J]. Journal of the American Concrete Institute, 1972, 69: 212-217. DOI: 10.14359/11265.
[22] TANG Mao-ling. 3D geometric nonlinear analysis of long-span suspension bridge and its software development [D]. Southwest Jiaotong University, 2003. (in Chinese)
[23] DUAN Mao-jun, LI Jian-hui, SUO Xiao-can, ZHOU Guang-pan. Refined analysis method of saddle for self-anchored concrete suspension bridge [J]. Journal of Nanjing Technology University (Natural Science Edition), 2016, 38(6): 112-115. (in Chinese)
(Edited by FANG Jing-hua)
���ĵ���
������������êʽ�����Ž�����⼰��ͬԤ��ģ���µ�ʱ��ЧӦ�Աȷ���
ժҪ�������о���Ŀǰ�й�����Ļ�������êʽ�����š�����·���ŵĽṹ����״̬������2015��4����2017��4��������Ӫ���ڵĽṹ���Ρ������������Լ�����ݽ����˽ṹ�仯����ȫ�����ۣ��������˻����¶ȱ仯���������������ЧӦӰ�����������ANSYS����Ԫģ�ͣ�����CEB-FIP 90Ԥ��ģ�ͼ�B3Ԥ��ģ�ͼ��Ի������������ЧӦ������Ԥ�⼰�Աȷ��������ð����ڵ�������Чģ����ģ����������ϵ��ϻ����ԣ�ͨ������Ԫ���㷨����ԤӦ����ʧ��ʵ�����ݱ�������������ƫλ�����������ԣ����������ռ�ЧӦ���ԣ���������Ӧ���ı仯�غ������ȷֲ������ڻ���������������ѹӦ�������ڻ���������������ѹӦ����С���������¶��ݶ�ЧӦ���ԡ���CEB-FIP 90Ԥ��ģ����ȣ����Կ��ǻ��������ϲ�����B3ģ�͵õ��Ļ������������ЧӦԤ������ʵ�����ݸ�Ϊ�ӽ������˼�����������ê�̵��ڻ������������ЧӦӰ�������п�ƫ�ơ��п���������������ԣ���������ѹӦ�����װ�ѹӦ����С���ԡ�������߿緽���Ԥƫ���п�������Ԥ̧�����ڳ�����������êʽ�����ŵĽṹ��ȫ״̬��
�ؼ��ʣ���êʽ�����ţ�����������������������⣻������������䣻Ԥ��ģ�ͣ������¶ȱ仯����ȫ������
Foundation item: Project(201606090050) supported by China Scholarship Council; Project(51278104) supported by the National Natural Science Foundation of China; Project(2011Y03) supported by Jiangsu Province Transportation Scientific Research Programs, China; Project(20133204120015) supported by the Research Fund for the Doctoral Program of Higher Education of China; Project(12KJB560003) supported by Jiangsu Province Universities Natural Science Foundation, China
Received date: 2017-03-26; Accepted date: 2018-01-09
Corresponding author: LI Ai-qun, PhD, Professor; Tel: +86-18801059268; E-mail: aiqunli@seu.edu.cn; ORCID: 0000-0002-5049-4315

