Fault detection in flotation processes based on deep learning and support vector machine
��Դ�ڿ������ϴ�ѧѧ��(Ӣ�İ�)2019���9��
�������ߣ������� ������ �콨��
����ҳ�룺2504 - 2515
Key words��flotation processes; convolutional neural network; support vector machine; froth images; fault detection
Abstract: Effective fault detection techniques can help flotation plant reduce reagents consumption, increase mineral recovery, and reduce labor intensity. Traditional, online fault detection methods during flotation processes have concentrated on extracting a specific froth feature for segmentation, like color, shape, size and texture, always leading to undesirable accuracy and efficiency since the same segmentation algorithm could not be applied to every case. In this work, a new integrated method based on convolution neural network (CNN) combined with transfer learning approach and support vector machine (SVM) is proposed to automatically recognize the flotation condition. To be more specific, CNN function as a trainable feature extractor to process the froth images and SVM is used as a recognizer to implement fault detection. As compared with the existed recognition methods, it turns out that the CNN-SVM model can automatically retrieve features from the raw froth images and perform fault detection with high accuracy. Hence, a CNN-SVM based, real-time flotation monitoring system is proposed for application in an antimony flotation plant in China.
Cite this article as: LI Zhong-mei, GUI Wei-hua, ZHU Jian-yong. Fault detection in flotation processes based on deep learning and support vector machine [J]. Journal of Central South University, 2019, 26(9): 2504-2515. DOI: https://doi.org/10.1007/s11771-019-4190-8.

J. Cent. South Univ. (2019) 26: 2504-2515
DOI: https://doi.org/10.1007/s11771-019-4190-8

LI Zhong-mei(������)1, GUI Wei-hua(������)1, ZHU Jian-yong(�콨��)2
1. School of Automation, Central South University, Changsha 410083, China;
2. School of Electrical and Automation Engineering, East China Jiaotong University,Nanchang 330013, China
 Central South University Press and Springer-Verlag GmbH Germany, part of Springer Nature 2019
Abstract: Effective fault detection techniques can help flotation plant reduce reagents consumption, increase mineral recovery, and reduce labor intensity. Traditional, online fault detection methods during flotation processes have concentrated on extracting a specific froth feature for segmentation, like color, shape, size and texture, always leading to undesirable accuracy and efficiency since the same segmentation algorithm could not be applied to every case. In this work, a new integrated method based on convolution neural network (CNN) combined with transfer learning approach and support vector machine (SVM) is proposed to automatically recognize the flotation condition. To be more specific, CNN function as a trainable feature extractor to process the froth images and SVM is used as a recognizer to implement fault detection. As compared with the existed recognition methods, it turns out that the CNN-SVM model can automatically retrieve features from the raw froth images and perform fault detection with high accuracy. Hence, a CNN-SVM based, real-time flotation monitoring system is proposed for application in an antimony flotation plant in China.
Key words: flotation processes; convolutional neural network; support vector machine; froth images; fault detection
Cite this article as: LI Zhong-mei, GUI Wei-hua, ZHU Jian-yong. Fault detection in flotation processes based on deep learning and support vector machine [J]. Journal of Central South University, 2019, 26(9): 2504-2515. DOI: https://doi.org/10.1007/s11771-019-4190-8.
1 Introduction
Flotation process is the art of extracting valuable minerals from the worthless minerals or other gangues by adding certain reagents in slurry to modify the froth surface properties, which is the key component in the mineral processing.Considering the froth visual features can indicate the flotation performance, reagents control is essential for ensuring the froth appearance at acceptable conditions. Unfortunately, the main activity carried out still relies on manually adjusting reagents after the froth features out of expectation. More specifically, current flotation process fault detection has been done by experienced operators through the frequent visual inspection of froth appearance, which is often problematic since this manual operation always coupled with serious response delay and measurement error. Hence, the automatic identification and evaluation of the operating condition is vital to relieve the pressure on workers while boosting the plant efficiency.
Some researchers have revealed that froth images are essential for identifying the flotation working condition [1-3]. However, the observation of froth appearance is usually conducted by human inspection that relies on the empirical knowledge, which can be time-consuming, laborious, and error-prone. To overcome this problem, the application of industrial machine vision system facilitates more accurate flotation condition recognition. Machine vision has evolved and promoted the development of flotation process control, which is capable of extracting froth characteristics, both physical (e.g. bubble size, shape, texture and color) and dynamic (froth velocity), from digital images captured by industrial cameras and transmit these froth features to operators or use the froth features as inputs to process control systems [4]. Previous studies related to the fault detection in flotation processes were mainly based on hand-engineered features. Many researchers had found that bubble size is strongly associated with the reagents addition, and they investigated how to use bubble size to achieve fault detection for flotation process. YANG et al [5] adopted watershed segmentation scheme to analyze the bubble size, and then employed nonparametric wavelet thresholding estimator to recognize the flotation status based on bubble size distribution. LIU et al [6] investigated a Bayesian inference method to deduce the flotation operation status based on bubble size distribution. The latest research studied the health status of reagents addition during flotation process based on time series distribution of bubble size as presented in Ref. [7], by using cumulative distribution function. Some researchers believed that froth texture better reflects the operation condition. A four-direction fused spatial grey co-occurrence matrix was adopted for textural feature extraction [8]. HE et al [9] and LING et al [10] analysed the froth texture spectrum by using a threshold criterion combined with principle component analysis model to realize the flotation performance recognition in sulphur flotation process. GUI et al [11] proposed a texture feature extraction method based on color co-occurrence matrix to better monitor and evaluate the production state. Recently, based on GUIs�� work, ZHAO et al [3] presented a multi-scale gray level co-occurrence matrix to recognize different working conditions, using wavelet transform to describe the froth gray images. Great efforts had been made by using different algorithms for machine-vision-based flotation process recognition.
However, relevant studies to date are concentrating on extracting a specific froth feature for segmentation, in a condition where dynamic and uncertainty are the norm, establishing a one-size- fits-all segmentation algorithm is a tricky proposition. As a consequence, the accuracy and efficiency of traditional approaches are not favoured because they use only low-level features without enough mid-level and high-level information. This problem has received scant attention so far. To overcome the bias and improve the recognition accuracy, deep learning algorithm is adopted to identify image characteristics under various operational conditions. Since flotation process fault diagnosis can be treated as a pattern recognition task, convolution neural network (CNN) is an efficient method to recognize the objects which takes center stage in the field of engineering and computer science by its high classification performance [12]. This network avoids the complexity of manipulating the image, meanwhile, also enables people to input the original image directly. CNN was first adopted for extracting froth image feature in 2017, where the pretrained Alex Net was used as feature extractor. The experiments showed that this method was able to generate more reliable results than the existed approaches in the application of froth image analysis system [13]. Recently, Google Nethas demonstrated a strong capability in general object classification, it used 12 times fewer parameters than AlexNet, while being significantly more accurate [14]. For better analysis of the flotation condition, we have adopted GoogleNet (Inception V3) network here.
In this work, a hybrid CNN-SVM (support vector machine) model to recognize the reagents addition status by using transfer learning approach is investigated. CNN is adopted for automatically extract froth images feature off-line, then a supervised learning model (SVM classifier) is used to recognize unknown patterns on-line under various working conditions. In addition, a real-time image-based flotation process monitoring system is established to better recognize the froth image property. The advantages of this approach are: 1) it frees operators from retrieving a specific froth feature for segmentation and provides the whole information of froth images; 2) the demand for system hardware is eliminated due to the heavy computational effort needed when training a CNN-SVM model; 3) the flotation monitoring system based on CNN-SVM shows the detailed froth image information and diagnosis result in real-time.
The rest of this paper is structured as follows: Section 2 introduces the antimony flotation process and the froth image database under four operational states; Section 3 illustrates the basic concepts of CNN, SVM and the hybrid CNN-SVM models; experimental study and results are shown and analysed in Section 4; finally, Section 5 gives some conclusions and future directions of research.
2 Description of antimony flotation circuit
In this section, a brief description of antimony flotation process and the existing fault recognition problem are illustrated followed by the froth image database under different reagents addition.
2.1 Process description and analysis
The antimony flotation circuit consists of an antimony-roughing bank, an antimony-cleaning bank I, an antimony-cleaning bank II, an antimony- scavenging bank I, and an antimony-scavenging bank II.Each of the flotation banks is equipped with an impeller, designed for agitating and aerating the pulp, with a supplementary compressed-air supply. For the purpose of effectively extracting antimony from the gangue minerals, a preferential- bulk flotation technique has been adopted. The starting point is grinding, crushed ore is fed to the grinding circuit. In this circuit, the ore is ground to a sufficient size to adequately liberate desired minerals. The chemical reagents are usually added to the pulp in the antimony-roughing bank after the ore and pulp mixed together in an agitated tank. In this stage, hydrophobic antimony irons and air bubbles attach together while moving up and forming the froth layer. The froth, enriched in antimony, is then scraped from the antimony- roughing bank. After two links of the antimony- cleaning bank, the antimony concentrate is produced. Meanwhile, the underflows of antimony- roughing bank are transported to the antimony- scavenging bank forming the final tailing. In order to maximize the recovery of the valuable minerals, the underflows of gold-cleaning II bank and gold- cleaning I bank need to be re-flotation. The simplified flow sheet of the antimony flotation process is shown in Figure 1.
The main objective of this work is to develop a machine-vision-based recognition method to assess whether the reagents addition is appropriate or not. The froth structure in the antimony-roughing bank is directly subject to reagents addition, which can be used for recognizing the flotation performance. Through large amount of data collection and analysis, a froth image database under different operational states is established for training and testing the CNN-SVM model. In this model, CNN is used to extract froth feature directly and SVM is a function as a classifier. After off-line training is completed, a reliable flotation condition recognition system based on CNN-SVM is built to identify the flotation operational state on-line.
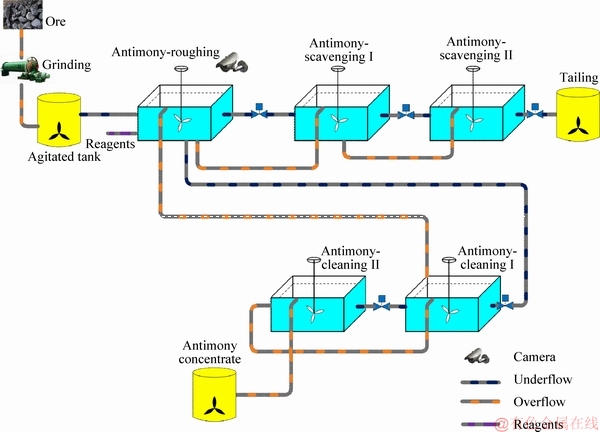
Figure 1 Simplified flow sheet of antimony flotation process
2.2 Database of froth images
An investigation is conducted over periods of time in flotation plant for collecting and analysing froth images. According to the expert experiences, the operating condition can be divided into four categories: Class A, Class B, Class C and Class D. Each class stands for a distinct operating condition. A large number of froth images under various operating states are collected which lays a foundation for the follow-up CNN-SVM learning. A detailed description of froth structure under four types of operating state has been listed.
Class A (Normal). In this state, the reagents dosage is properly added and the slurry level is kept constant. The normal froth appears well-defined with moderate stability and viscosity, and the desired hydrophobic minerals have sufficient time attaching to air bubbles. At the same time, the hydrophilic minerals remain in the slurry. This is the ideal operating condition, in which the final concentrate grade is relatively high with low tailing grade.
Class B (Overdosage). In this state, the reagents addition is excessive and the slurry level is still kept constant. The froth appears rubbery, thick, firm and high viscous, which prevents it from disillusion. The weak activity in the slurry, results in both valuable minerals and worthless minerals are attaching to bubble surface, which means the concentrate grade is low with high reagents consumption.
Class C (Under dosage). In this state, the reagents addition is deficient and the slurry level is kept constant. The froth shows transparency and easily broken. Because of its low stability, the valuable minerals adhere to bubble surface sink into the bottom of flotation bank, which contributes to the low concentrate grade and high tailing grade.
Class D (Problematic). This state means problematic events occur. Because the camera is fixed, mounted 110 cm above the flotation cell. If the slurry level declines, the camera cannot capture the available information from the froth surface, particularly with a shortage of feeding. In this case, if the fault cannot be detected promptly, it can cause significant production loss.
The database contains 4400 froth images of pixel size 800��600. The training set and testing set are constructed by 900 froth images and 200 froth images respectively under four different operating conditions. Some typical froth images captured under the four different operating conditions are illustrated in Figure 2.
3 Fault detection based on CNN-SVM
The basic working mechanism of CNN and SVM is provided in this section. After that, the hybrid CNN-SVM trainable feature extractor model is explained in detail at the end of this section.
3.1 CNN classifier
CNN is a type of feed-forward artificial neural network which contains multiple hidden layers of units between the input and output layers. Specifically, it can be expressed as the composition of two parts. The first part is composed of an input layer, several convolutional layers and pooling layers, which is designed to automatic feature extraction. The second part is made of several fully connected layers and an output layer, which is responsible for classification [15]. Figure 3 presents the architecture of basic convolutional neural network. The working process is: after convolving the input with a set of learnable filters (C hidden layers) for extracting several feature maps, the dimensionality reduction (S hidden layers) is performed by subsampling the spatial resolution of feature maps in pooling layers. Each convolutional layer is followed by a sub-sampling layer. The softmax function is often used as output activation function for the output layer, which provides that the probability of each image belongs to a specific class.
In general, it is formed as follows [16]:
 (1)
(1)
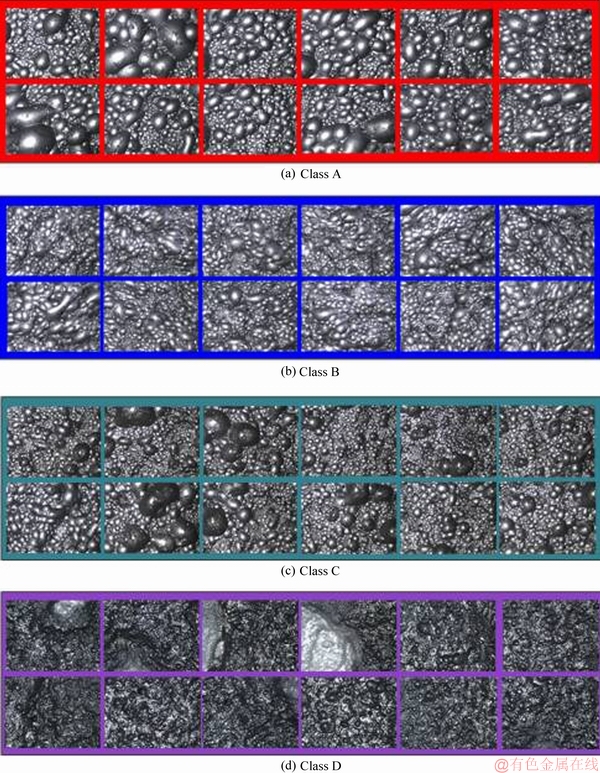
Figure 2 Typical froth images captured at four different conditions
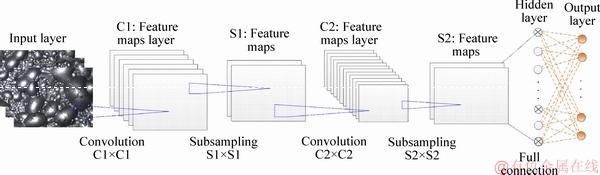
Figure 3 A typical CNN architecture
where Mj is a set of arrays called feature maps; l represents the lth layer in CNN; k denotes the matrix of S��S; S represents the size of convolutional kernels; f stands for a nonlinearity active function. Each input feature map will be convolved with a distinct kernel k, and then forms an output feature map.
The number of kernels used in the input will result in the same amount of feature maps, such that the output has the same size as the input. It is noted that a subsampling layer is served to progressively reduce the spatial size of input features and the computational complexity for avoiding over fitting. More specifically,
 (2)
(2)
where down(��) stands for a subsampling function. Each output feature map equals its own multiplicative bias �� and additive bias b.
All the large convolutions are concatenated into a big feature map before feeding into the classifier, which is known as feature vector fv. The last fully connected layer is called the output layer, and a softmax function is used to output a probability of the network prediction.
 (3)
(3)
where bo presents a bias vector and ��o stands for a weight matrix. 
 bo and ��o are learned parameters of the model by gradient descent, where the back propagation algorithm is applied to calculating the gradient of the error function regarding to the parameters.
There are many popular CNN architectures that can be used to solve machine-vision-based problems, like LeNet, AlexNet, GoogleNet and VGGNet. In our experiment, the pretrained network (Inception V3) is taken as the feature extractor, and the trainable classifier of the Inception V3 is replaced by the SVM classifier.
3.2 SVM classifier
The SVM classifier has been successfully applied to discriminating high dimensional data in many machine-vision-based pattern recognition/ classification fields [17]. Its advantages are parsimonious, flexible and predictable, which makes it uniquely suited to solve classification problems.
SVM is a data classification method basically used for separating data through an optimal separating hyper plane (maximal margin), which serves as a decision surface. The calculation is done by projecting the input samples onto a feature space of higher dimension via a nonlinear transformation ��, which can be seen in Figure 4.
 (4)
(4)
in which 
 ��(x) is defined as a feature map.
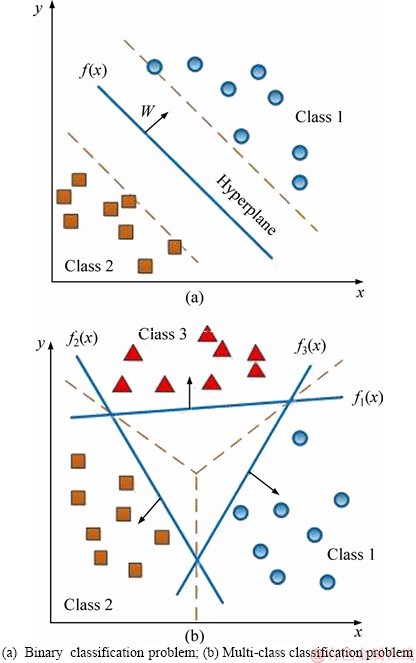
Figure 4 Principle of SVM:
The SVM training procedure is similar to solve a constrained quadratic programming problem, that is, the optimization problem subject to regularization parameters. The four different kernels are usually adopted in classification problems, namely:
1) Linear
K(x, y)=x��y (5)
2) Radial basis function
K(x, y)=exp(-��||x-y||2) (6)
3) Sigmoid
K(x, y)=tank(��0xy+��1)����������������������(7)
4) Polynomial kernel
K(x, y)=[(x��y)+1]d (8)
where the value of d, ��0, ��1 and �� are determinated empirically. Considering linearly inseparable in the original spaces, we map the input data (xi, yi) into a higher dimensional feature space, which is implemented by using a nonlinear operator ��(x). Hence, the optimal hyper plane is given by:
 (9)
(9)
where is the kernel in the radial basis function form, sng(��) denotes the sign function. In this work, the RBF kernel of SVM is used for classification.
3.3 Hybrid CNN-SVM model
Training a CNN with many layers from scratch can take a considerable amount of time because of the large computational cost. To combat this issue, transfer learning has been developed, by applying a pretrained neural network to another related problem [18]. A specific CNN, namely Google��s Inception V3 is adopted as our starting point, which is pretrained on approximately 1.26 million images of generic object classes, to identify flotation condition [19]. To adapt it to the froth image database, an SVM classifier is used to replace the softmax classifier on the final image representation. In Inception V3, this model can generate a 2048 CNN codes (image feature) for each input image. After that, the 2048 codes are used as inputs to achieve the froth images classification. The structure of new hybrid CNN-SVM model is shown in Figure 5.
4 Experiments
In this section, an experiment which shows the process of operating condition recognition is described. After that, the performance of the hybrid CNN-SVM model is presented. Finally, the effectiveness of the proposed method is validated through the comparison experiment. This experiment is based on Intel Core i7-7700HQ Processor (6MB Cache, up to 3.80 GHz), 16 GB DDR4 2400MHz SODIMM memory.
4.1 Experimental procedure
After the froth images are fed to the Inception V3 model, the 2048-dimensional feature vector is generated for each image. In this work, the 2048-dimensional feature vector is transformed into a 2-d feature by using t-distributed stochastic neighbor embedding (t-SNE), which is easy to visualize [20]. The result is given in Figure 6. Basically, if the same color points are mostly clustered together, there is a high probability that we could use features to train the classifier with high accuracy.
Setting proper model parameters is helpful for improving the SVM classification accuracy. It is important to understand the influence of the two parameters with the RBF kernel in the SVM model: penalty parameter (c) and gamma (��), because the accuracy of an SVM model is largely dependent on them. If c (the error tolerance of the model) is too large or too small, it may have over fitting or under fitting. Meanwhile, the distribution of data in new feature space is determined by ��. If �� is too large, the number of support vector will reduce, and vice versa. The model training and predicting speed and quality are dependent on the number of support vector. The best c and �� hyper-parameters can be found using grid search approach when the SVM model chooses the RBF kernel function [21].Figure 7 shows that different c and �� have different effects on the accuracy of the SVM model. The bar graph illustrates the training time, the curve represents the training accuracy. In this work, we choose c=10, ��=0.01.
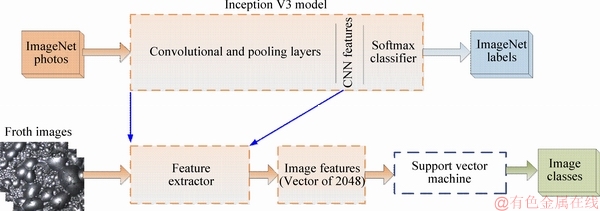
Figure 5 Architecture of CNN-SVM model
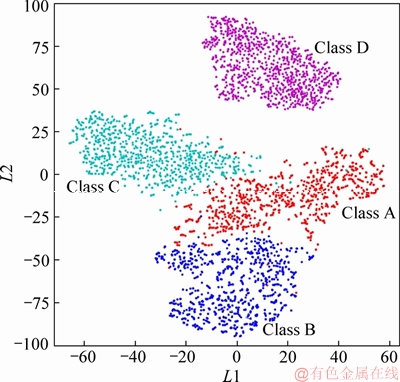
Figure 6 Visualizations of 3600 froth images under four classes
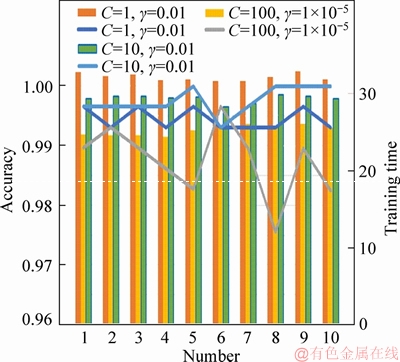
Figure 7 Effects of different parameters on accuracy (curves) and training time (bars)
4.2 Results of experiment
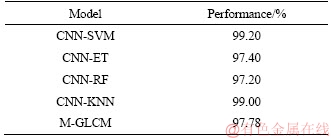
Experiments are carried out to verify the feasibility and effectiveness of the proposed method by comparing the froth images recognition algorithms based on SVM, extra trees (ET), random forest (RF), k-nearest neighbours (KNN) and multi-scale co-occurrence matrix, which have been successfully applied to the image classification areas [3]. The results of the compared work are shown in Figures 8-11 and Table 1.
Confusion matrix, also known as an error matrix, is used here to allow visualization of the model performance. Each row represents the rate in true class while each column represents the rate in predicted class. The SVM confusion matrix (Figure 8) shows the classification accuracy is 99.2%, almost all classes are classified correctly. Figure 9 displays the misclassification rate of the ET model. The classes B and A are predicted as the two classes overlapping the most. Additionally, from the RF classification (Figure 10), 3% of class A are wrongly identified as class B, with the final accuracy 97.2%. Figure 11 illustrates the 99% classification accuracy of the KNN algorithm, only 2% of class A is misclassified as class B. The classification accuracy in the previous work by using multi-scale co-occurrence matrix is 97.78%, which is lower than the method we proposed. In comparison with the results listed in Figures 8-11 and Table 1, it can be seen that the CNN-SVM method can produce higher average classification accuracy than other methods. The above results demonstrate that the hybrid model CNN-SVM is appropriate for recognizing the operating condition of flotation process with high accuracy and efficiency. More specifically, if the froth images are classified as Class B, Class C, or Class D, it is a signal that the current condition is out of normal operation. In this case, the operators need to adjust the operating parameters according to the recognition results.
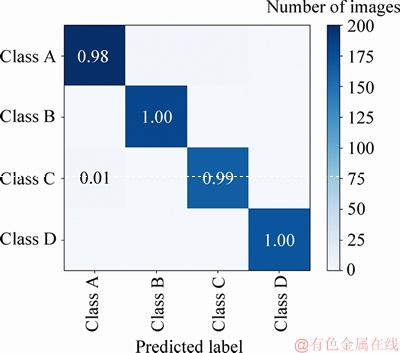
Figure 8 CNN-SVM confusion matrix on froth images classification
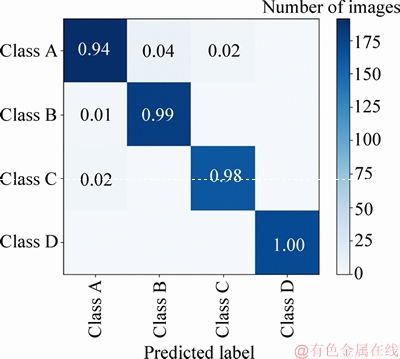
Figure 9 CNN-ET confusion matrix on froth images classification
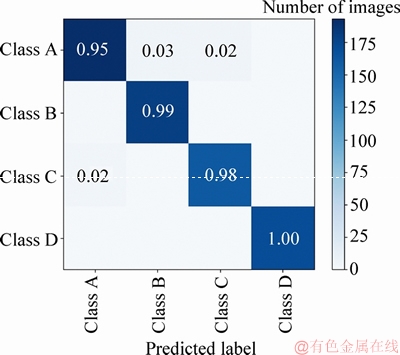
Figure 10 CNN-RF confusion matrix on froth images classification
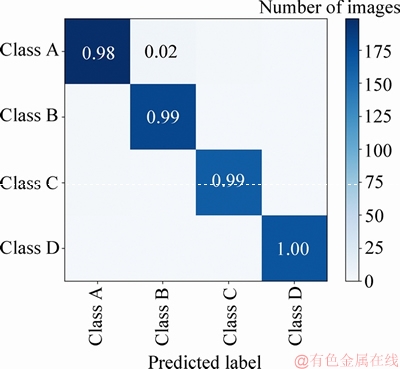
Figure 11 CNN-KNN confusion matrix on froth images classification
Table 1 Classification performance comparison
4.3 Comparison summary of our work with others
In order to verify the effectiveness of the proposed method, experiments are carried out to compare the existed recognition methods based on our dataset.
For instance, we have the work of FU et al [13] in which they first used a pretrained CNN network (AlexNet) as froth feature extractor. In their experiment, the last layer of the network is replaced by a random forest model. The authors tested their approach (AlexNet-RF) in an industrial platinum flotation plant and achieved accuracy of almost 83%, while an accuracy of 81.37% is achieved based on our dataset. We train models using stochastic gradient descent optimizer with a batch size of 32 and momentum of 0.9, and the learning rate set to 10-4. The number of training epochs is set to 500, for better monitoring the performance of models, the early stopping to prematurely stop the training is adopted at an optimal epoch, the parameter ��patience�� is set to 10.
The traces of the training and validation loss (green and blue lines), training and validation accuracy (black and red lines) of AlexNet-RF and Inception V3-SVM, are shown in Figure 12. It can be seen from Figure 12(a) that the training and validation loss of AlexNet-RF start with a rapid descent, after 70 epochs, they drop slightly until convergence. Figure 12(b) demonstrates that the training and validation accuracy notably increase at first. Over 130 epochs, there is no clear evidence of decline in the validation loss. At last, the training of our method (Inception V3-SVM) is stopped at epoch 140. Table 2 gives the average accuracy of each model. It can be seen that Inception V3-SVM model has higher accuracy on training and validation than the AlexNet-RF model does.
In addition, MA et al [22] classified froth images using a characteristic complex network, by mapping each image pixels into complex network nodes. The complex network (CN) model was established by adjacent matrix to obtain the dynamic texture features of image sequences. Their approach achieved 91%-92% in two classes classification of flotation condition while we only achieved 78.9% in our four classes recognition.
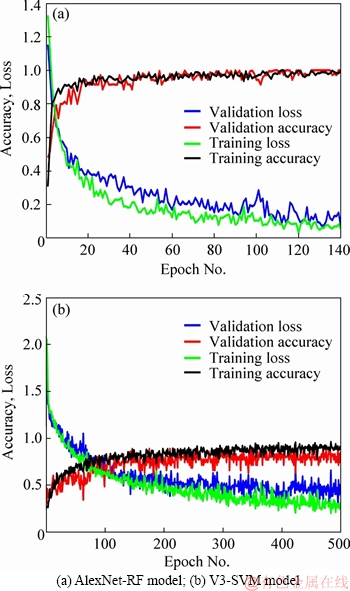
Figure 12 Accuracy and loss changes over epochs of models:
Table 2 Comparison summary of our approach with others in literatures
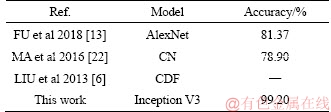
Besides, LIU et al [6] presented a fault diagnosis method where they adopted a cumulative distribution function (CDF) to estimate the dynamic bubble size distribution in copper flotation process. The health status of the reagent addition was inferred by an unsupervised algorithm. However, this approach is hard to apply to our research, because bubble size feature in antimony flotation process is not obvious, which is difficult to segment.
Table 2 shows a comparison summary between some existing methods used in flotation condition recognition recently. It is plausible to find out the proposed method, which surpassed the existing methods adopted in other literature. As a result, it is advantageous for flotation state recognition by analysing froth images on-line using Inception V3-SVM.
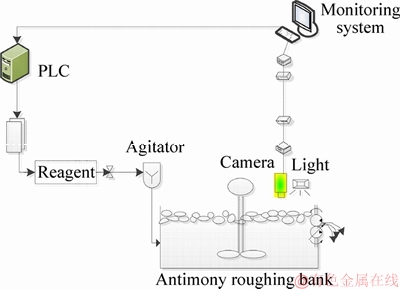
Figure 13 Hardware structure of image collecting platform
4.4 Flotation process monitoring system
The proposed approach is validated in practical on an antimony flotation plant in China. A real time flotation process monitoring system is trained offline and acquires flotation condition on-line. Figure 13 illustrates the hardware structure of the flotation process monitoring system, including a light, a camera, a computer and other appurtenances. The froth images are captured by the digital color CCD camera (model: PIKE F-145C Fiber), installed above the antimony-roughing bank of 110 cm, these images are transmitted to image acquisition card through 1394 interface and optical fiber. The processing time for each frame is 2-3 s with Core-i7 CPU.
The monitoring system has been divided into three parts: image reading module, image processing module and result output module. To determine the current operational state, the froth image needs to be captured and transformed into monitoring system. The deep learning algorithm is used to analyse the froth image, and simultaneously provides the result of the flotation operation condition, which can be seen in Figure 14. To better understand the CNN-SVM property, visualisation strategy is applied. This visualization is a peek inside a neural network by highlighting neurons which get excited when processing a froth image. Each dot represents a neuron, inputting different froth images will excite different regions of neurons. This monitoring system will provide better information about flotation condition and allow operators to take the corresponding action under an abnormal operational situation.
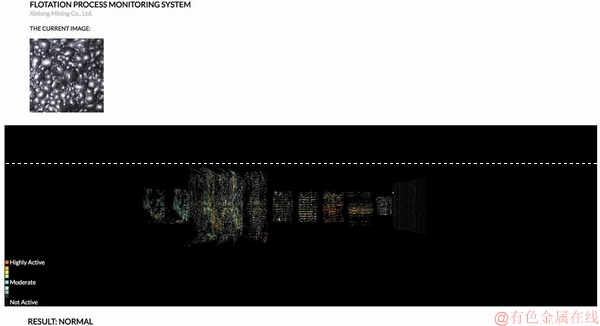
Figure 14 Application of flotation process monitoring system
5 Conclusions and future work
1) A novel approach for fault detection in flotation process based on convolutional neural network and support vector machine is proposed in this paper. To achieve automatically flotation condition recognition, first of all, a large number of froth images under various operating conditions is constructed as dataset. After that, we use a pretrained CNN model to extract the whole information of froth feature instead of choosing the hand-crafted feature. And then, the feature vector feeds into a SVM as an input for classification. The current operating condition will be classified according to the image feature vector. Finally, the flotation process monitoring system is established to visualize the froth image property intuitively as well as acquire the result of the current operating condition directly. Effectiveness of the CNN-SVM model is evaluated through froth images collected from an antimony flotation plant in China. Experimental results have shown that our model has higher accuracy than other recognition methods.
2) The advantages of proposed method are that it can retrieve the froth features directly from low level features to higher-level features with less computation complexity requirements instead of the hand-designed feature extraction. The second advantage lies in that the standard softmax layer of CNN is replaced by an SVM, for better classification performance and faster training time. The obtained results demonstrate the efficiency of the hybrid CNN-SVM model for flotation operating condition recognition. The third advantage of the proposed method is the flotation process monitoring system enables operators to get an intuitive idea on the current operational state. Integration of the monitoring system into the real plant will increase the production by identifying and adjusting abnormal operating condition timely.
3) The future work will be direct at constructing a larger database that should involve not only the froth images from the antimony- roughing bank, but also with scavenging bank and concentrating bank. This flotation process monitoring system would also be helpful for identifying the operating condition of the whole flotation plants.
References
[1] YANG Chun-hua, ZHOU Kai-jun, MOU Xue-min, GUI Wei-hua. Froth color and size measurement method for flotation based on computer vision [J]. Chinese Journal of Scientific Instrument, 2009, 30(4): 717-721. (in Chinese)
[2] XU Can-hui, GUI Wei-hua, YANG Chun-hua, ZHU Hong-qiu, LIN Yi-qiu, SHI Cao. Flotation process fault detection using output PDF of bubble size distribution [J]. Minerals Engineering, 2012, 26: 5-12.
[3] ZHAO Lu, PENG Tao, HAN Hua, CAO Wei, LOU Yang-ge, XIE Xiao-tian. Fault condition recognition based on multi-scale co-occurrence matrix for copper flotation process [C]// Proceedings of the 19th World Congress International Federation of Automatic Control. Cape Town, South Africa. 2014: 7091-7097.
[4] ALDRICH C, MARAIS C, SHEAN B J, CILLIERS J J. Online monitoring and control of froth flotation systems with machine vision: A review [J]. International Journal of Mineral Processing, 2010, 96(1): 1-13.
[5] YANG Chun-hua, XU Can-hui, GUI Wei-hua, DU Jian-jiang. Nonparametric density estimation of bubble size distribution for monitoring mineral flotation process [C]// Proceedings of the 28th Chinese Control Conference. Shanghai, China. 2009: 2941-2945.
[6] LIU Jin-ping, GUI Wei-hua, TANG Zhao-hui, YANG Chun-hua, ZHU Jian-yong, LI Jian-qi. Recognition of the operational statuses of reagent addition using dynamic bubble size distribution in copper flotation process [J]. Minerals Engineering, 2013, 45: 128-141.
[7] LI Zhong-mei, GUI Wei-hua. The method of reagent control based on time series distribution of bubble size in a gold�\antimony flotation process [J]. Asian Journal of Control, 2018, 20(6): 2223-2236.
[8] YANG Chun-hua, REN Hui-feng, GUI Wei-hua, YAN Feng, TANG Zhao-hui. Performance recognition using texture credit distributed SVM for froth flotation process [J]. Chinese Journal of Scientific Instrument, 2011, 32(10): 2205-2209. (in Chinese)
[9] HE Ming-fang, YANG Chun-hua, WANG Xiao-li, GUI Wei-hua, WEI Li-jun. Nonparametric density estimation of froth colour texture distribution for monitoring sulphur flotation process [J]. Minerals Engineering, 2013, 53: 203-212.
[10] LING Yi-qiu, YANG Chun-hua, HE Ming-fang, GUI Wei-hua. Fault condition detection for sulfur flotation process based on texture unit distribution [J]. Computing Technology and Automation, 2013, 32(1): 28-31. (in Chinese)
[11] GUI Wei-hua, LIU Jin-ping, YANG Chun-hua, CHEN Ning, LIAO Xi. Color co-occurrence matrix based froth image texture extraction for mineral flotation [J]. Minerals Engineering, 2013, 46: 60-67.
[12] LECUN Y, HUANG F J, BOTTOU L. Learning methods for generic object recognition with invariance to pose and lighting [C]// Proceedings of the 2004 IEEE Computer Society Conference. Washington DC, USA. 2004: 97-104.
[13] FU Y, ALDRICH C. Froth image analysis by use of transfer learning and convolutional neural networks [J]. Minerals Engineering, 2018, 115: 68-78.
[14] SZEGEDY C, LIU W J, SERMANET P, REED S, ANGURLOV D, RABINOVICH A. Going deeper with convolutions [C]// Proceedings of the IEEE Conference on Computer Vision and Pattern Recognition. Boston, MA, USA, 2015: 1-9.
[15] LECUN Y, BOTTOU L, BENGIO Y, HAFFNER P. Gradient-based learning applied to document recognition [J]. Proceedings of the IEEE, 1998, 86(11): 2278-2324.
[16] BOUVRIE J. Notes on convolutional neural networks [R]. Cambridge, USA: MIT, 2006.
[17] BYUN H, LEE S W. A survey on pattern recognition applications of support vector machines [J]. International Journal of Pattern Recognition and Artificial Intelligence, 2003, 17(3): 459-486.
[18] NG H W, NGUYEN V D, VONIKAKIS V, WINKLER S. Deep learning for emotion recognition on small datasets using transfer learning [C]// Proceedings of the 2015 ACM on International Conference on Multimodal Interaction. Seattle, USA. 2015: 443-449.
[19] SZEGEDY C, VANHOUCKE V, IOFFE S, SHLENS J, WOJNA Z. Rethinking the inception architecture for computer vision [C]// Proceedings of the IEEE Conference on Computer Vision and Pattern Recognition. Las Vegas, USA. 2016: 2818-2826.
[20] MAATEN L V D, HINTON G. Visualizing data using t-SNE [J]. Journal of Machine Learning Research, 2008, 9: 2579-2605.
[21] HSU C W, CHANG C C, LIN C J. A practical guide to support vector classification. [EB/OL] [2003]. http://www. csie. ntu.edu.tw/~cjlin/papers/guide/guide.pdf
[22] MA Ai-lian, XU De-gang, XIE Yong-fang, YANG Chun-hua, GUI Wei-hua. Analysis of dynamic texture features of flotation froth images based on space-time characteristics of complex networks [J]. Journal of Chemical Industry and Engineering, 2016, 68(3): 1023-1031. (in Chinese)
(Edited by FANG Jing-hua)
���ĵ���
�������ѧϰ��֧���������ĸ�ѡ���̹�����Ϸ���
ժҪ���Ը�ѡ���̽��й������������ѡ����ҩ�����ģ�������Ч����Ļ����Լ������ֳ��������˵��Ͷ�ǿ�ȵȡ���Դ�ͳ�ĸ�ѡ���̹�����Ϸ������ǶԵ�һ����ĭ����(����ĭ��ɫ����״����С��������)�����˹���ȡ�����ھ��ȵͣ�Ч�ʵ͵�ȱ�ݡ��������һ�ֻ������ѧϰ��֧���������ĸ�ѡ���̹�����Ϸ�������ģ�����þ���������(CNN) �Զ���ȡ��ĭͼ������������֧��������(SVM) ������ȡ��ͼ������������Ͻ����ͨ�����ִ�ĸ�ѡ������Ϸ�����Ƚϣ����������CNN-SVM���ϵķ���������������������ʶ��ģ�͡�
�ؼ��ʣ���ѡ���̣����������磻֧������������ĭͼ�������
Foundation item: Projects(61621062, 61563015) supported by the National Natural Science Foundation of China; Project(2016zzts056) supported by the Central South University Graduate Independent Exploration Innovation Program, China
Received date: 2018-06-26; Accepted date: 2019-05-22
Corresponding author: GUI Wei-hua, PhD, Professor; Tel: +86-13908462048; E-mail: gwh@mail.csu.edu.cn; ORCID: 0000-0003-0312- 436X

