Secondary settlement estimation in surcharge preload subject to time effect of secondary consolidation coefficient
来源期刊:中南大学学报(英文版)2017年第2期
论文作者:胡亚元 杨平
文章页码:341 - 352
Key words:post-construction secondary settlement; time effect; tangent slope; secondary consolidation coefficient
Abstract: In order to eliminate the settlement underestimation in surcharge preload engineering, a study based on Bjerrum’s creep diagram and the tangent slope definition of secondary consolidation coefficient was carried out to analyze the time effect of secondary consolidation coefficient of over consolidated soil, and a time–growth model for it was formulated. As Bjerrum’s creep diagram is an idealized model, oedometer tests were performed to improve the above time–growth model of secondary consolidation coefficient for the purpose of achieving a better agreement with the actual ground situations. It is found that secondary consolidation coefficient of over consolidated soil not only decreases with the ratio of historical maximum to current effective stress of soil (OCR), but also increases with the development time of secondary consolidation. No matter how large OCR is, the long-term time effect of secondary consolidation coefficient of over consolidated soil is all significant. Based on the above results, a model for settlement estimation was formulated and a case study to estimate it indicates that the settlement estimated by our method is 2–5 times larger than that estimated by the previous method. Moreover, the larger the OCR is as well as the longer the service life is, the larger the difference between our method and the previous method is. Thus, the post-construction secondary settlement in surcharge preload engineering will be underestimated when neglecting the time effect of secondary consolidation coefficient in over consolidated state.
Cite this article as: HU Ya-yuan, YANG Ping. Secondary settlement estimation in surcharge preload subject to the time effect of secondary consolidation coefficient [J]. Journal of Central South University, 2017, 24(2): 341-352. DOI: 10.1007/s11171-017-3436-1.
J. Cent. South Univ. (2017) 24: 341-352
DOI: 10.1007/s11171-017-3436-1

HU Ya-yuan(胡亚元)1, 2, YANG Ping(杨平)1, 2
1. Research Center of Coastal and Urban Geotechnical Engineering, Zhejiang University, Hangzhou 310058, China;
2. Key Laboratory of Soft Soils and Geoenvironmental Engineering of Ministry of Education,
Zhejiang University, Hangzhou 310058, China
 Central South University Press and Springer-Verlag Berlin Heidelberg 2017
Abstract: In order to eliminate the settlement underestimation in surcharge preload engineering, a study based on Bjerrum’s creep diagram and the tangent slope definition of secondary consolidation coefficient was carried out to analyze the time effect of secondary consolidation coefficient of over consolidated soil, and a time–growth model for it was formulated. As Bjerrum’s creep diagram is an idealized model, oedometer tests were performed to improve the above time–growth model of secondary consolidation coefficient for the purpose of achieving a better agreement with the actual ground situations. It is found that secondary consolidation coefficient of over consolidated soil not only decreases with the ratio of historical maximum to current effective stress of soil (OCR), but also increases with the development time of secondary consolidation. No matter how large OCR is, the long-term time effect of secondary consolidation coefficient of over consolidated soil is all significant. Based on the above results, a model for settlement estimation was formulated and a case study to estimate it indicates that the settlement estimated by our method is 2–5 times larger than that estimated by the previous method. Moreover, the larger the OCR is as well as the longer the service life is, the larger the difference between our method and the previous method is. Thus, the post-construction secondary settlement in surcharge preload engineering will be underestimated when neglecting the time effect of secondary consolidation coefficient in over consolidated state.
Key words: post-construction secondary settlement; time effect; tangent slope; secondary consolidation coefficient
1 Introduction
Surcharge preload are widely used in the construction of highway embankments over soft soil to reduce the post-construction settlement [1]. Though some soft grounds are reinforced by such technique, the magnitude of the long-term settlement is still larger than the estimation made by the previous method (e.g., ALONSO et al [2]), so that the settlement in excess of the estimation may result in the phenomenon of “vehicle bumping at the bridgehead” and “huge differential settlement” in highway engineering. In particular, when embankments construct over deep soft soil, their settlements may even exceed the design limit. For example, the Hangzhou-Ningbo freeway in Zhejiang province developed a 1–2 times larger settlement than its design limit [3]. The Wenzhou airport also exhibits the same phenomenon, where its settlement is up to 0.6 m and also far beyond its design limit [4]. The situation that the post-construction settlement is often underestimated in surcharge preload engineering is probably resulting from the shortcoming of the previous creep theory for over consolidated soil, which may leads to the potential problems for engineering safety. Therefore, in the present paper we tried to find out its cause and formulate a model for soil to realize a correct estimation of post- construction settlement.
Post-construction settlement generally consists of primary and secondary settlement, in which the primary settlement here has been largely eliminated by applying surcharge preload over a limited period of time in the construction period. So the ultimately post-construction settlement in surcharge preload engineering is basically controlled by the secondary consolidation of soil. Such opinion has gained a wide acceptance, and secondary settlement and its characteristics have already been studied by many experts [5–12]. In addition to this, as secondary consolidation coefficient directly reflects the strain rate of secondary consolidation, many experts in the case of surcharge preload study mainly focused on the over consolidation ratio effects. In the influence of the framework of previous creep theories, ALONSO et al [2] conducted field and laboratory tests on soft deltaic deposits clay, and established a direct time-independent relationship between the over consolidation ratio and secondary consolidation coefficient. They employed it to estimate the post-construction secondary settlement in surcharge preload engineering. ZHOU and CHEN [13] utilized the results of oedometer tests to investigate the influence factors of secondary consolidation coefficient, and came to conclusion that secondary consolidation coefficient was related to the preconsolidation pressure of soil. LI et al [14] stated that the relationship between the secondary consolidation coefficient to the over consolidation ratio can be direct simulated by a time independent hyperbolic model, and they utilized this model to establish a corresponding empirical formula for soil to estimate the post-construction secondary settlement. Evidently, the secondary consolidation coefficient of over consolidated soil is related to the over consolidation ratio. In addition, many experts pointed out secondary consolidation coefficient of normally consolidated soil is related to the development time of secondary consolidation [15], and that of over consolidated soil is trusted to have the similar effect. ZENG et al [16] based on the results of MESRI et al [17] and their own oedometer tests, suggested that the model which only took into account the over consolidation ratio effects may be too simple for the secondary consolidation coefficient evaluation in the over consolidated state. They recommended obtaining the model for soil to estimate the post-construction secondary settlement by the curve of secondary consolidation coefficient against time. NASH et al [18] and HU [19] found that secondary consolidation coefficient gradually increased along with the time by the theoretical analysis of Bjerrum’s creep diagram, and it would ultimately tend to stable. Thus, the existing time effect of secondary consolidation coefficient of over consolidated soil must be taken into account to correct the post-construction secondary settlement, and only in this way does the secondary settlement avoid to be underestimated. It is necessary for the soil creep mechanics to study the time effect of secondary consolidation coefficient of over consolidated soil and to find out a simple model to correctly estimate the post- construction secondary settlement in surcharge preload engineering.
Traditionally, the majority used the secant slope definition to determine its secondary consolidation coefficient. This definition is related to both the beginning and ending calculation time, which might result in a relatively complicated expression of the secondary consolidation coefficient [16, 19] when the settlement varied nonlinearly with logarithmic time [6–10]. In practice, such complicated expression would confine its further use. Thus, the behaviors of the secondary settlement of over consolidated soil were analyzed to derive a new tangent slope definition for secondary consolidation coefficient determination in this paper. Armed with Bjerrum’s creep diagram and this tangent slope definition, a study was carried out to analyze the time effect of secondary consolidation coefficient of over consolidated soil, and its results were used to formulate model for the post-construction secondary settlement estimation. The detail processes were as follows: First, a study based on Bjerrum’s creep diagram and Yin-Graham equivalent time rheological model (EVP model) was carried out to derive a time growth theoretical model of secondary consolidation coefficient of over consolidated soil. Then, as Bjerrum’s creep diagram is a too idealized model in over consolidated state, the above model was improved by the data of our oedometer tests for the purpose of achieving a better agreement with the actual grounds situations. Finally, a model for secondary settlement estimation corresponding to the above time-growth model of secondary consolidation coefficient was formulated and some significant conclusions are drawn for the time effect of the secondary consolidation coefficient of over consolidated soil in surcharge preload engineering.
2 Definition to secondary consolidation coefficient
Secondary consolidation coefficient directly reflects the strain rate of secondary consolidation. Traditionally, it is defined as the slope of a plot of secondary consolidation strain εz against lnt at constant effective stress, as illustrated in Fig. 1:
 (1)
(1)
where t1 is the time that primary consolidation completes as well as secondary consolidation begins; t2 is the time which is selected as the calculating end of secondary consolidation; △εz is the vertical increment strain of secondary consolidation increased during the calculating period.
Figure 1 indicates that Eq. (1) is only the expression of secondary consolidation coefficient at the start time t1.

Fig. 1 Typical representative diagram of primary and secondary consolidation
If it needs to acquire secondary consolidation coefficient at any general time t, the variables t1 and t2 in Eq. (1) should be replaced by t and t+△t, respectively, and the expression is rewritten as
 (2)
(2)
Obviously, Eq. (2) has a more universality in the definition of secondary consolidation coefficient.
When the soil in the normally consolidated state, majority believes the secondary settlement of normally consolidated soil varies linearly with logarithmic time [20]. In this way, the slope of the strain of secondary consolidation against lnt curve is constant in secondary consolidation phase. Apparently, secondary consolidation coefficient of normally consolidated soil is time- independent in such linear assumption, so secondary consolidation coefficient determined by Eq. (1) and Eq. (2) is the same in the normally consolidated state.
When the soil in the over consolidated state, it will show a nonlinear relationship between logarithmic time and the secondary settlement [6–10], as illustrated in Fig. 2.

Fig. 2 Secondary consolidation strain against lnt in over consolidated range
Secondary consolidation coefficient determined by Eq. (2) is actually the secant slope of the strain of secondary consolidation against lnt curve, so this definition determined by Eq. (2) is called the secant slope definition of secondary consolidation coefficient. In this definition, secondary consolidation coefficient varies with not only the selected time t but also the increment time △t, and the value will be different even at the same t time because it still depends on △t. In order to eliminate the negative effects of the △t, the case that △t→0 in Eq. (2) is taken into consideration, and then Eq. (2) becomes
 (3)
(3)
Equation (3) indicates  is actually the tangent slope of the strain of secondary consolidation against lnt curve at general time t, so it can be called the tangent slope definition of secondary consolidation coefficient. Because only depends on the time t, the expression in the nonlinear case will be simple enough to use in practice. Therefore, the tangent slope definition will be applied to analyze the time effect of secondary consolidation coefficient of over consolidated soil in the next section.
3 Time effect of secondary consolidation coefficient of over consolidated soil
Because the properties of secondary consolidation coefficient of over consolidated soil are complicated, it is hard to acquire its time effect only by soil tests. In this work, we first use Bjerrum’s creep diagram [5] and Yin-Graham EVP model [6, 7] to analyze the time development law of secondary consolidation coefficient of over consolidated soil, then formulate a theoretical time-growth model for it, and improve this model with the data of our oedometer tests for achieving a better agreement with the tests results. This model provides a simple formula for engineering use as well.
3.1 Soft soil model for analysis
A simple soil stratum that consists of a single homogenous saturated normally consolidated soft soil with thickness H is analyzed in this work, as shown in Fig. 3(a). We take the average gravity pressure , the average initial strain εz0, the average initial void ratio e0, the average compressive index λ, the average swelling index κ and the average creep parameter ψ of the whole soft soil as the initial effective stress, the initial strain, the initial void ratio, the compressive index, the swelling index and the creep parameter of soil stratum, and the specific volume V at the initial state is V0=1+e0. To simulate the surcharge preload project, a uniform preload Pf+s (kPa) is applied to the top of the soft stratum, as illustrated in Fig. 3(b). When the preload Pf+s is applied up to the surcharge preload period ending ts, the load is reduced from Pf+s to Pf–Pc, where Pf is the final construction load on the ground surface, and Pc is the increment load increased in the construction period. Then, considering that the construction period tv0 and increment construction load Pc are relatively small in comparison with other periods and loads, to simplify the analysis in this work, the preload P is directly reduced from Pf+s to Pf, and the additional surcharge preload is Pf+s–Pf=Ps.
Prior to studying the time effect, it should be noted that the average degree of consolidation of soil stratum increases along with time due to the poor permeability and the limited preloading time, so the effective stress of soil also increases along with time in preload period. As the soft soil treatment practice shows, the average degreeof consolidation  can be approximately calculated from the consolidation formula of Zeng Guo-xi [1]:
 (4)
(4)
where α1 and β1 are the parameters determined by the drain conditions.

Fig. 3 Calculation sketches for preload design:
3.2 Yin-Graham EVP model
Let T0 be the initial absolute equivalent time on the equivalent time line that passes through the initial point  εz0). In this work, the absolute equivalent time T0 line is chosen as the reference absolute equivalent time line, and and εz0 on the T0 time line are selected as the reference effective stress and strain, respectively, as shown in Fig. 4. According to Bjerrum’s creep diagram and Yin-Graham EVP model, the strain εz, the effective stress
  and the absolute equivalent time T (T=T0+te, as shown in Refs. [6–8]) have a unique relationship as follows:

Fig. 4 Bjerrum’s creep diagram
 (5)
(5)
Yin-Graham EVP model [6, 7] can also be expressed as
 (6)
(6)
where  is the differential of strain to the real time t;
  is the differential of effective stress to the real time t.
Let
 (7)
(7)
Substituting Eq. (5) and Eq. (7) into Eq. (6), Yin- Graham EVP model becomes [21, 22]
 (8)
(8)
When the load Pf+s is instantaneously applied to the soft soil, its strain will develop along the OO′C curve, as shown in Fig. 4. The effective stress of soil can be expressed as
 (9)
(9)
Substituting Eq. (9) into Eq. (8), the following expression can be obtained:

 (10)
(10)
Let
 (11)
(11)
Substituting Eq. (11) into Eq. (10), then integrating it from 0 to ts with the initial conditions t=0 and  the strain at the end of surcharge preload period (point C, as shown in Fig. 4) can be written as

 (12)
(12)
where λ(ts) can be easily determined by Eq. (4) and Eq. (11) with the Matlab software.
Let TC be the absolute equivalent time on the equivalent time line that passes through the point C where the effective stress is  and εz=εzC, according to Eq. (5), we have
 (13)
(13)
Combined with Eq. (12) and Eq. (13), TC has the relationship as follows:
 (14)
(14)
Equation (14) is now derived from the creep theory of Yin-Graham EVP model.
In practice, TC also can be determined by empirical knowledge for the purpose of simplifying application, and it is approximately equal to (0.5–0.67)ts in general cases.
3.3 Time development law of secondary consolidation coefficient
Now we begin to discuss the time development law of secondary consolidation coefficient of over consolidated soil. As indicated above in Fig. 3(b), the load after preloading period is instantaneous reduce from the surcharge preload Pf+s to constant construction load Pf, where effective stress is corresponding reduce from  to
to  and its strain will develop along the instant time line (as CD curve shown in Fig. 4). When the soil at constant effective stress
  its creep strain will develop along the DEH curve in Fig. 4, where the point D, E and H is the begin of construction, the end of construction as well as the begin of service life and the end of service life, respectively. Thus, according to Bjerrum’s creep diagram and Yin-Graham EVP model, the creep strain after the beginning of construction can be expressed as [6–9]
 (15)
(15)
where R is the ratio of historical maximum to current effective stress of soil (OCR); tv is the time after the preload period that equals to t–ts, as shown in Fig. 3(b); TD is the absolute equivalent time on the equivalent time line that passes through the point D where the effective stress is  , and its value can be determined by the △DCF in Fig. 4:
 (16)
(16)
The R in Eq. (15) is defined as the ratio of historical maximum effective stress to current effective stress of soil. In the clay creep theory of Yin-Graham EVP model, other than the concepts of OCR, the generalized over consolidation ratio (RG, GOCR) is also widely used in practice, where the GOCR is defined as the ratio of the generalized preconsolidation pressure to the current effective stress of soil on the basis of Bjerrum’s creep diagram. It needs to distinguish the two concepts: the generalized preconsolidation pressure and the preconsolidation pressure. In the conventional soil mechanics the preconsolidation pressure is determined by compressive lines given by multi-staged oedometer tests with increments applied daily, which can be visualized in Bjerrum’s creep diagram as the effective stress corresponding to the intersection point between the instant time line and the absolute equivalent time T1d = 1 d line, as  shown in Fig. 4. In order to distinguish it with the definition of conventional creep mechanics, the effective stress determined by the instant time line and the absolute equivalent time T1d=1 d line in Bjerrum’s creep diagram is called the generalized preconsolidation pressure. Haven this definition, the relationship between R and RG in Fig. 4 can be expressed as TCRα=T1dRGα. In general, the TC is not equal to T1d, so that R is not equal to RG in most surcharge preload engineering. An exception is that the point C and G in Fig. 4 happen to coincide, viz TC=T1d, such as in regular one-day duration oedometer tests, the R is equal to RG.
Equation (15) is now adopted to analyze the time effect of secondary consolidation coefficient of over consolidated soil. Utilizing the tangent slope definition, the secondary strain rate of Eq. (15) can be written as
 (17)
(17)
Substituting Eq. (17) into Eq. (3) yields
 (18)
(18)
Equation (18) is the time-growth model of secondary consolidation coefficient of over consolidated soil. The C′α depends on not only the development time tv of secondary consolidation, but also R of soil which is a determined value in a given preloading period ts. Obviously, both of them have influence on the time effect of secondary consolidation coefficient, so their effects will be studied separately in detail in the next paragraphs.
To confirm the development time influence on secondary consolidation coefficient of over consolidated soil, two cases that consider tv→0 and tv→∞ in Eq. (18) are listed in the following:
When tv→0, Eq. (18) can be rewritten as
 (19)
(19)
The explanation for Eq. (19) is that, when tv→0,Eq. (3) can be rearranged as
 (20)
(20)
The right side of Eq. (20) represents the secondary stain rate which equal to the creep rate on the absolute equivalent time TD line in Bjerrum’s creep diagram, as shown in Fig. 4, and it has a limit. Meanwhile the denominator tv of the left side of Eq. (20) is zero when tv→0, so to guarantee the establishment of Eq. (20), the numerator  must be equal to zero as well.
When tv→∞, Eq. (18) can be rewritten as
 (21)
(21)
Given by Eq. (19) and (21), it can be found that the increases along with time and finally becomes the ψ/V0 of normally consolidated soil when tv→∞. This is consistent with the previous conclusion that secondary consolidation coefficient increases along with time when the surcharge preload removed [16, 17].
Now R is discussed to analyze its influence on the time development law of secondary consolidation coefficient of over consolidated soil:
1) When R is relatively small, according to Eq. (18), the secondary consolidation coefficient of over consolidated soil increases quickly along with time, e.g., R=1.1, taking the soil parameters of our oedometer tests (shown in the next section) into calculation, where TC=1 d, V0=2.34, λ=0.116, κ=0.0224 and ψ=0.00382. In this way, increases to 8.8% and 60.7% of the ψ/V0 of normally consolidated soil at tv=1 d and tv=16 d, respectively. In other words, increases to 51.9% of ψ/V0 during this period of 15 days. Therefore, when R is relatively small, the time effect of secondary consolidation coefficient of over consolidated soil is significant enough to be found easily by soil tests in early period. Considering this, the R adopted by our oedometer tests is generally small.
2) When R is relatively large, the secondary consolidation coefficient of over consolidated soil increases slowly in early period, e.g., R=1.5, considering the same parameters of above 1), increases to 0.00484% and 0.0775% of the ψ/V0 of normally consolidated soil at tv=1 d and tv=16 d, respectively. Due to the nearly zero value of them, the time development of secondary consolidation coefficient is small during this period. And if considering the interference of tests error, its time development law is hard to be found by soil tests in short duration. But, in long service life, such as 20 years, increases to 26.1% of the ψ/V0 of normally consolidated soil, and 50 years, it increases to 46.9%. Therefore, when the R is relatively large, although secondary consolidation coefficient of over consolidated soil develops slowly in a short period, its long-term time effect is still significant.
As noted above, when R is relatively small, the time effect of secondary consolidation coefficient of over consolidated soil is significant, in this case the coefficient will increase quickly from zero to that of normally consolidated soil in a short period; when R is relatively large, though the time effect of secondary consolidation coefficient of over consolidated soil is weak in early period, its long-term effect should not be negligible. Considering that R in surcharge preload engineering is typically from 1.3 to 1.5 (less than the load defined over pressure ratio), the time effect of secondary consolidation coefficient should be taken into account in order to avoid underestimating the post- construction settlement in practice.
In addition, it should be noted that above analysis focuses on the simplest soil stratum where the initial soil is in normally consolidated state, and there is T0=1 d. But in real soil stratum, it may undergo a overloading or aging for thousands years in the past. In other word, the T0 in real engineering may be bigger than 1 d. In this work, the use of T0 in the derivation of Eq. (5)–(18) is as a parameter not a determined value, so they can also be used in the other T0 situations, where T0 can be calculated by [7, 22, 23]
 (22)
(22)
where σ′zC1d is the effective stress corresponding to the intersection point between the instant time line that passes through the point εz0) and the absolute equivalent time T1d =1 d line.
4 Modification to secondary consolidation coefficient model of over consolidated soil and its settlement formula determination
When Bjerrum used the creep diagram to study the secondary settlement of soft soil, he simplified the slightly curved compressive creep lines (given by the tests of CRAWFORD [24]) by straight lines. It’s no doubt that there are some differences between Bjerrum’s creep diagram and the actual soil situations. Given this reality, Bjerrum’s creep diagram is an idealized model for secondary settlement prediction, and some experts have done modifications to it in order to fit the soil better, e.g., YIN [15] recommended modifying the creep lines in normally consolidated state and proposed a time, stress related formula for the ψ/V0, and YU et al [25] suggested that the compressive lines in Bjerrum’s creep diagram should decrease as the stress increases and then a corresponding settlement formula was also proposed. So based on the above analysis, if Eq. (18) is directly applied to evaluate secondary consolidation coefficient, the model will be simple but too idealistic, and obviously there are a gap between Eq. (18) and the actual grounds situations. But if the above modified method is adopted to determine the time development law of secondary consolidation coefficient of over consolidated soil, the model may be complicated and difficult to be used in practice. Considering the pros and cons, it suggests here to modify the parameters in Eq. (18) with the soil tests results. In other word, the ψ/V0 and Rα in Eq. (18) are replaced by the constant parameter a and the general OCR function f(R), respectively:
 (23)
(23)
where the parameters a and f(R) can be determined by simple oedometer tests.
It brings up a very interesting question that how to determine the parameters in Eq. (23) with the oedometer tests data. As analyzed above, when R is relatively large, secondary consolidation coefficient of over consolidated soil will increases slowly in early short period, and it is difficult to find out the time development law of secondary consolidation coefficient in this case. Considering that Eq. (18) and (23) can fit any OCR situation of soil, it suggests to determine the specific form of Eq. (23) with the time development curve of secondary consolidation coefficient at small OCR situation, and then generalizing it to analyze the time development law of secondary consolidation coefficient and its secondary settlement at large OCR situation.
Substituting Eq. (23) into Eq. (18) and integration of it, the post-construction secondary settlement is written as
 (24)
(24)
where tv0 is the time that the construction ends as well as service life begins; tv is the time that service life ends. The above formula is not only simple in form, but also distinct in reflecting the effect of OCR and tv.
5 Oedometer tests on reconstituted soft soil
As noted above, the model parameters of Eq. (23) can be determined by the data of oedometer tests. To validate its rationality and feasibility, oedometer tests on the reconstituted soft soil are carried out.
5.1 Testing device and preparation of samples
In our study, the Advanced Consolidation Testing System (ADVCTS, produced by GDS instruments) is used to perform the oedometer tests. The load including axial and back pressure is applied under PC automated control, and the vertical deformation of the specimen is monitored by a displacement transducer of a high accuracy which is fixed to the top of the device. Prior to the main tests, the each element of the ADVCTS is examined and corrected. It is found that all elements of the device achieved the great resolution and accuracy in this environment, and such precision meets our tests requirement.
The reconstituted soft soil used in our tests is taken from the engineering in Wenzhou, China. The specimen size of the ADVCTS is a 2 cm-thick soil with a diameter of 7.62 cm, and it is prepared by the following method (refer to the Test Methods of Soils for Highway Engineering (JTG E40–2007)):
1) After soil drying, aggregations of the particles are broken down, and then bring the soil to the desired moisture content by thoroughly mixing with the appropriate amount of water. Place the prepared soil in a sealed container and store for at least 24 h before using.
2) Compact the prepared soil into the mould in layers which has a thickness of 4–5 cm and a diameter of 23 cm, depending on the density.
3) Take out the prepared specimen, and cut it off with cutting ring of the device. Then, conduct some tests to obtain the basic properties of the prepared soil, such as moisture content test. The initial properties of the specimens are listed as following: ω0=48.2%, Gs=2.72, e0=1.34, ωL=56.6% and ωp=26.6%.
5.2 Testing plans and its instructions
The oedometer tests that we plan to conduct consist of the regular oedometer, the regular creep and the surcharge preload test, in which the first two regular tests are carried out to determine the basic parameters of soil in normally consolidated state (the testing methods refer to the JTG E40–2007). So, the surcharge preload test is our main test to confirm the parameters of Eq. (23), and its testing plan is discussed here. First of all, the over consolidated state of soil is obtained by applying load in order of overloading, over-unloading and reloading. And to ensure soil in over consolidated range while reloading, the magnitude of the reloading must be less than the overloading. Then, as for the duration of over-unloading period, considering that the over-unloading period is relative short in comparison with the following service life in real surcharge preload engineering, the stage of the over-unloading period is only conducted for 2 h [26]. Finally, in the selection of the OCR for surcharge preload test, the small value cases are adopted here. As noted in Eq. (18) and its analysis, when the OCR is relatively small, the time effect of secondary consolidation coefficient of over consolidated soil is significant. The time development law obtained by small OCR cases can be generalized to analyze the large OCR cases. Moreover, the duration of the test is generally short in laboratory due to devices restriction and the economic limitation. Given the reality, the small OCR cases are adopted in surcharge preload test and there are 1.125, 1.25 and 1.375. It should be noted that the OCR is directly equal to the ratio of the current load to previous load in oedometer tests, because there is TC=T1d.
Specific testing plans of all tests are shown in Table 1.
6 Test analysis and parameters determination
6.1 Testing results analysis
Prior to studying the time effect of secondary consolidation coefficient of over consolidated soil, the basic properties of normally consolidated soil are needed, including compression and creep. We conduct regular oedometer and creep tests on sample 1# and 2# respectively, and their resulting curves are plotted in Fig. 5. The relationship of vertical strain εz to vertical effective stress (on a log scale) is plotted in Fig. 5(a). The data points for stresses of 25, 50, 100, 200, 400 and 800 kPa are almost on the two straight lines, indicating the compressive and swelling line in conventional soil mechanics, respectively. The straight compressive line presents that the reconstituted specimen is in normally consolidated state. Besides, the relationship of vertical strain εz to the time t (also on a log scale) for 3 d is plotted in Fig. 5(b). The curves for stresses of 25, 50, 100, 200, 400 and 800 kPa appear the second inflection point (EOP) almost at 20000 s around, indicating that primary consolidation completes as well as secondary consolidation begins entering the significant period at 20000 s. In this way, the curves after this moment stand for the secondary consolidation of soil. As shown in Fig. 5(b), the curves in secondary consolidation are basically a family of parallel lines, which notes that secondary consolidation coefficient is a constant in the normally consolidated state. In addition to this, some parameters can be obtained by the slope of the curves in Fig. 5, such as compressive index. But, we use the λ–κ model from critical state soil mechanics to define the parameters, which means the time or vertical effective stress used to determine the parameters should be on an ln scale. Seeing that the time and vertical effective stress in Fig. 5 are all on log scales, the parameter used in our paper is related to conventional parameters (on a log scale) by equation of parameter=conventional parameter (on a log scale)/ln10. By such conversion, the parameters are obtained, where λ=0.116, κ=0.0224 and ψ=0.00382, so is α=(λ–κ)/ψ= 24.5.
The surcharge preload test is carried out on sample 3#, 4# and 5# with setting OCRs. The relationship of vertical strain εz to time t (on a log scale) of overloading, over-unloading and reloading period is plotted in Fig. 6. The slope of each curve in reloading period is smaller than that of the secondary part of 200 kPa in Fig. 5(b), indicating that secondary consolidation coefficient will
decrease when reinforced by surcharge preload. It is in agreement with the conclusion that has been proposed by several experts [2, 13, 14]. To clearly analyze the behaviors of over-unloading and reloading period, the time when overloading period ends is chosen as zero point of time coordinate, so that the relationship of increment vertical strain △εz to time t (on a log scale) of over-unloading and reloading periods is plotted in Fig. 7, where increment strain presents the increment of current strain relative to that of overloading period ends. As illustrated in Fig. 7, the increment strain of soil swelling caused by over-unloading increases as OCR increases, and if considering that the adopted OCR in actual surcharge preload is generally among 1.3 and 1.5, the secondary settlement developed in the following service life will be far beyond than the settlement caused by such swelling strain. In this way, if such strain of the soil is ignored in practice, the post-construction secondary settlement prediction may be conservation and safety for surcharge preload engineering, so it can be viewed as the security surplus in theoretical analysis. In the following, the strain in early reloading period becomes relatively small. The reason for it is that specimen develops negative pore water pressure due to swelling of soilwhile over- unloading, then if a new load is applied to the specimen (similar to the reloading period in our test), it will develop positive pore water pressure. In this case, the specimen needs some time to regain its hydraulic balance because of the interaction of the negative and positive pore water pressure. At once does a new hydraulic balance achieve, the specimen begins to enter the significant period of the secondary consolidation, and the beginning time increases as OCR increases, as ts3, ts4 and ts5 shown in Fig. 7. When specimen is in secondary consolidation period, the curve of each OCR is nonlinear and slightly curved. According to the tangent slope definition, the relationship of secondary consolidation coefficient  to time t (on a log scale) is plotted in Fig. 8. In addition, the development law of secondary consolidation coefficient of over consolidated soil will be discussed in detail in the next section.
Table 1 Testing plans for oedometer tests
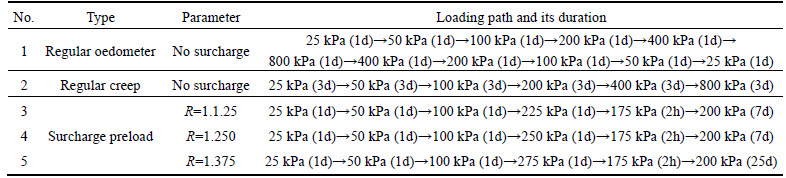

Fig. 5 Basic properties of normally consolidated soil:

Fig. 6 Vertical strain against lgt
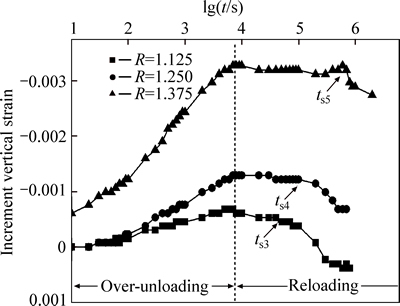
Fig. 7 Increment vertical strain against lgt

Fig. 8  defined by tangent slope definition against
6.2 Determination of a and f (R)
When tv≠0, the expression of Eq. (23) can be rearranged as
 (25)
(25)
The relationship between  and
and  in Eq. (25) is described by a linear equation, in which TC f(R)/a is the slope and 1/a is the intercept. As R in oedometer tests is determined by the T1d=1 d compressive lines, there is TC=T1d=1 d in Eq. (25). Therefore, according to Eq. (25), the relationship of to
  is plotted in Fig. 8 using the oedometer data of reloading period in Fig. 7.
The data points in Fig. 8 indicate that secondary consolidation coefficient of over consolidated soil increases along with time as well as decreases as OCR increases, which is in agreement with the prediction of our theoretical analysis. The specific function form of Eq. (25) is determined in following.
As expected, the data points for R of 1.125, 1.25 and 1.375 are almost on a straight line. The linear equations can best fit these data points, where there are  5.92×10³tv–1+641.08, =1.26×10⁴tv–1+641.08 and =2.66×10⁴tv–1+641.08 (in the order of OCR 1.125, 1.25 and 1.375), with R2=0.990, 0.998 and 0.996, respectively, indicating very good fitting. Here, R2 is the coefficient of determination in the range of 0
Because the slope and intercept of each OCR have been estimated in advance, the remaining parameter f(R) can be easily determined by the relationship f(R)= (k×a)/TC, where k is the slope of best-fitting line. So, there are 9.232, 19.656 and 41.496 of f(R) for each best-fitting line (in the order of R 1.125, 1.25 and 1.375). Similar to the treatment of the above data points, the relationship between R and f(R) can be determined by function fitting, where best-fitting equation for it is f(R)=0.01exp(6.01R), with R2=0.99 indicating a very good fitting. Such expression of f(R) has some limitations from a theoretical point of view, but it may provide a good agreement with the oedometer tests. Consequently, substituting the obtained parameters into Eq. (23), the modified model is given by
 (26)
(26)
The oedometer tests results show that Eq. (23) fits the data of the over consolidated soil tests well, so that Eq. (23) can be used as the generalized model of secondary consolidation coefficient of over consolidated soil. Besides, it should be noted that the TC in oedometer tests is equal to 1 d, but TC in real engineering should be calculated by Eq. (14). Of course, to make reliable predictions of the best fitting functions, the minimum duration of 7 d is advised for the last period of these tests.
6.3 Post-construction secondary settlement estimation
Utilizing the data of our oedometer tests, the generalized time-growth model of secondary consolidation coefficient of Wenzhou over consolidated soil has been formulated, shown in Eq. (26). In order to estimate the post-construction secondary settlement in surcharge preload engineering subject to the time effect of secondary consolidation coefficient of over consolidated soil, the formula can be obtained by substituting Eq. (26) into Eq. (24):
 (27)
(27)
Equation (27) is now used to estimate the post- construction secondary settlement for a surcharge preload project.
Assuming that a project involved a normally consolidated clay layer 20 m thick, where the horizontal permeability coefficient kh=5.27×10⁻⁵ m/d, the average gravity pressure  80 kPa and the final construction load Pf=20 kPa. To accelerate the drain of water, the prefabricated band drains is used in this project where the equivalent diameter of the band ds=0.06 m, the diameter of influence de=1.05 m, the smear coefficient J=0.458, and the drain spacing ratio G=0.188. Thus, according to [1], the parameter α1 and β1 in Eq. (4) are 8/π2 and 0.0250, respectively. In the construction of this project, the surcharge preload is sustained for 250 d. When the surcharge preload is removed, it begins to construct the highway pavement in the following 60 d. So, there are ts=250 d and tv0=60 d. The post- construction secondary settlements of 20 or 50 years service life predicted by our method and the previous method are listed in Table 2, in which the previous method can be expressed as follows [2, 14]:
 (28)
(28)
where Cα(R) is secondary consolidation coefficient which varies with OCR.
The post-construction secondary settlement whether 20 or 50 years service life predicted by Eq. (27), due to the time effect of secondary consolidation coefficient of over consolidated soil, is 2–5 times larger than the settlement predicted by Eq. (28), as illustrated in Table. 2. Furthermore, it is found that the larger the OCR is as well as the longer the service life is, the larger the
difference between our method and the previous method. For example, when 20 years service life is considered, the post-construction secondary settlement ratio of our method to the previous method is 2.983 times at R=1.25, but the difference is up to 3.383 times at R=1.375; when R=1.375 is considered, the settlement difference of 20 years service life between our method and the previous method is 3.383 times, but the difference of 50 years service life is up to 4.948 times. Thus, the long-term time effect of secondary consolidation coefficient of over consolidated soil shouldn’t be neglected in practice, even when OCR is relatively large. In order to correct the post-construction settlement estimation in surcharge preload projects, the time effect of secondary consolidation coefficient of over consolidated soil need to be calculated into the post-construction secondary settlement.
Table 2 Comparison of our method and previous method with several OCRs

7 Conclusions
1) When soil at over consolidated state, its secondary settlement varies nonlinearly with the logarithmic time, so the tangent slope definition for secondary consolidation coefficient can be more easily applied in practice than the secant slope definition due to the advantage of its fewer variables.
2) It is found that the time effect of secondary consolidation coefficient of over consolidated soil is not only related to the ratio of historical maximum to current effective stress of soil (OCR), but also related to the development time of secondary consolidation. In detail, when OCR is relatively small, secondary consolidation coefficient of over consolidated soil increases quickly along with time from zero to that of normally consolidated soil in early short period; when OCR is relatively large, the coefficient increases slowly with time, but it will have a significant development in its long-term service life. No matter how large OCR is, the long-term time effect of secondary consolidation coefficient of over consolidated soil is all significant and should be taken into account in practice.
3) The neglecting time effect of secondary consolidation coefficient of over consolidated soil is one of the causes for the underestimation of the post-construction settlement in surcharge preload engineering. The above time effect is taken into account to formulate a generalized model for soil to estimate the post-construction secondary settlement in surcharge preload engineering. The case study indicates that the settlement predicted by our method is 2–5 times larger than that by the previous method. Furthermore, the larger the OCR is as well as the longer the service life is, the larger the difference between our method and the previous method. Thus, the post-construction secondary settlement in surcharge preload projects will be underestimated if the time effect of secondary consolidation coefficient of over consolidated soil is neglected.
References
[1] GONG Xiao-nan. Foundation treatment manual [M]. Third Edition. Beijing: China Architecture & Building Press, 2008: 70–97. (in Chinese)
[2] ALONSO E, GENS A, LLORET A. Precompression design for secondary settlement reduction [J]. Geotechnique, 2000, 50(6): 645–656.
[3] LIU Han-long, HU Sheng-xia, HASSAN A. Test study on creep characteristics of soft clayey soils under consolidation by vacuum- surcharge combined preloading method [J]. Rock and Soil Mechanics, 2008, 29(1): 6–12. (in Chinese)
[4] GUO Lin, CAI Yuan-qiang, GU Chuan, WANG Jun. Resilient and permanent strain behavior of soft clay under cyclic loading [J]. Journal of Zhejiang University (Engineering Science) 2013, 47(12): 2111–2117. (in Chinese)
[5] BJERRUM L. Engineering geology of normally consolidation marine clays as related to settlements of buildings [J]. Geotechnique, 1967, 17(2): 81–118.
[6] YIN J H, GRAHAM J. Visco-elastic-plastic modeling of one-dimensional time-dependent behavior of clays [J]. Canadian Geotechnical Journal, 1989, 26(2): 199–209.
[7] YIN J H, JAMES G. Equivalent times and one-dimensional elastic visco-plastic modeling time-dependent stress-strain behavior of clays [J]. Canadian Geotechnical Journal, 1994, 31: 42–52.
[8] HU Ya-yuan. Application of plastic-like visco-elastic model to clay [J]. Chinese Journal of Geotechnical Engineering, 2003, 31(3): 353–360. (in Chinese)
[9] YIN Zong-ze, ZHANG Hai-bo, ZHU Jun-gao, LI Guo-wei. Secondary consolidation of soft soils [J]. Chinese Journal of Geotechnical Engineering, 2003, 25(5): 521–526. (in Chinese)
[10] NASH D F T, RYDE S J. Modelling consolidation accelerated by vertical drains in soils subject to creep [J]. Geotechnique, 2001, 51(3): 257–273.
[11] DEGAGO S A, GRIMSTAD G, JOSTAD H P, NORDAL S, OLSSON M. Use and misuse of the isotache concept with respect to creep hypotheses A and B [J]. Geotechnique, 2011, 61(10): 897–908.
[12] MEI Guo-xiong, Yin Jian-hua. Coupled model of consolidation and creep for consolidation test [J]. Journal of Central South University, 2008, 15(1): 357–361.
[13] ZHOU Qiu-juan, CHEN Xiao-ping. Experimental study on creep characteristics of soft soils [J]. Chinese Journal of Geotechnical Engineering, 2006, 28(5): 626–630. (in Chinese)
[14] LI Guo-wei, SHENG Wei-gao, JIANG Hua-zhong, YIN Zong-ze. Secondary compression characteristics and settlement calculation of soft clay under over-loading-unloading and reloading [J]. Chinese Journal of Geotechnical Engineering, 2009, 31(1): 118–123. (in Chinese)
[15] YIN J H. Non-linear creep of soils in oedometer tests [J]. Geotechnique, 1999, 49(5): 699–707.
[16] ZENG Ling-ling, HONG Zhen-shun, LIU Song-yu, ZHANG Ding-jun, DU Yan-jun. A method for predicting deformation caused by secondary consolidation for naturally sedimentary structural clays [J]. Rock and Soil Mechanics, 2011, 32(10): 3136–3142. (in Chinese)
[17] MESRI G, STARK T D, AJLOUNI M A, CHEN C S. Secondary compression of peat with or without surcharging [J]. Geotechnical Engineering, 1997, 123(5): 411–421.
[18] NASH D F T. Precompression design for secondary settlement reduction: discussion [J]. Geotechnique, 2001, 51(9): 822–823.
[19] HU Ya-yuan. Discussion on “Secondary compression characteristics and settlement calculation of soft clay under overloading-unloading and reloading” [J]. Chinese Journal of Geotechnical Engineering, 2009, 12: 1963–1965. (in Chinese)
[20] BUISMAN K. Result of long duration settlement tests [C]// Proceeding of 1st International Conference on Soil Mechanics and Foundation Engineering. Delft Geotechnics, Delft, the Netherlands, 1936: 103–112.
[21] HU Ya-yuan. A practical evaluation of the surcharge preload period in staged construction subject to creep [J]. Computers and Geotechnics, 2011, 42: 171–179.
[22] HU Ya-yuan. Approximately determining preloading duration considering creep [J]. Journal of Zhejiang University (Engineering Science), 2009, 46(2): 250–256. (in Chinese)
[23] SCHMERTMANN J H. The mechanical aging of soils [J]. Journal of Geotechnical Engineering, 1991, 117(9): 1288–1330.
[24] CRAWFORD C B. Interpretation of consolidation tests [J]. Soil Mech Found Div, ASCE, 1964, 90(5): 87–102.
[25] YU Xiang-juan, YIN Zong-ze, DONG Wei-jun. Influence of load on secondary consolidation deformation of soft soils [J]. Chinese Journal of Geotechnical Engineering, 2007, 29(6): 913–916. (in Chinese)
[26] ZENG Ling-ling, ZENG Jun, CHEN Fu-quan. Mechanism of surcharge preloading on deformation of soft natural clay affected by soil structure [J]. Journal of Fuzhou University (Natural Science Edition), 2013, 41(2): 235–241. (in Chinese)
(Edited by YANG Bing)
Cite this article as: HU Ya-yuan, YANG Ping. Secondary settlement estimation in surcharge preload subject to the time effect of secondary consolidation coefficient [J]. Journal of Central South University, 2017, 24(2): 341-352. DOI: 10.1007/s11171-017-3436-1.
Foundation item: Project(51178419) supported by the National Natural Science Foundation of China
Received date: 2015-07-07; Accepted date: 2015-12-05
Corresponding author: HU Ya-yuan, Associate Professor, PhD; Tel: +86–571–87975964; E-mail: huyayuan@zju.edu.cn

