Rockburst prediction in hard rock mines developing bagging and boosting tree-based ensemble techniques
��Դ�ڿ������ϴ�ѧѧ��(Ӣ�İ�)2021���2��
�������ߣ��ܽ� ������ ��� Danial Jahed ARMAGHANI ��Ϧ�� Hani S. MITRI
����ҳ�룺527 - 542
Key words��rockburst; hard rock; prediction; bagging; boosting; ensemble learning
Abstract: Rockburst prediction is of vital significance to the design and construction of underground hard rock mines. A rockburst database consisting of 102 case histories, i.e., 1998-2011 period data from 14 hard rock mines was examined for rockburst prediction in burst-prone mines by three tree-based ensemble methods. The dataset was examined with six widely accepted indices which are: the maximum tangential stress around the excavation boundary (MTS), uniaxial compressive strength (UCS) and uniaxial tensile strength (UTS) of the intact rock, stress concentration factor (SCF), rock brittleness index (BI), and strain energy storage index (EEI). Two boosting (AdaBoost.M1, SAMME) and bagging algorithms with classification trees as baseline classifier on ability to learn rockburst were evaluated. The available dataset was randomly divided into training set (2/3 of whole datasets) and testing set (the remaining datasets). Repeated 10-fold cross validation (CV) was applied as the validation method for tuning the hyper-parameters. The margin analysis and the variable relative importance were employed to analyze some characteristics of the ensembles. According to 10-fold CV, the accuracy analysis of rockburst dataset demonstrated that the best prediction method for the potential of rockburst is bagging when compared to AdaBoost.M1, SAMME algorithms and empirical criteria methods.
Cite this article as: WANG Shi-ming, ZHOU Jian, LI Chuan-qi, Danial Jahed ARMAGHANI, LI Xi-bing, Hani S. MITRI. Rockburst prediction in hard rock mines developing bagging and boosting tree-based ensemble techniques [J]. Journal of Central South University, 2021, 28(2): 527-542. DOI: https://doi.org/10.1007/s11771-021-4619-8.

J. Cent. South Univ. (2021) 28: 527-542
DOI: https://doi.org/10.1007/s11771-021-4619-8

WANG Shi-ming(������)1, ZHOU Jian(�ܽ�)2, LI Chuan-qi(���)2,Danial Jahed ARMAGHANI3, LI Xi-bing(��Ϧ��)2, Hani S. MITRI4
1. School of Civil Engineering, Hunan University of Science and Technology, Xiangtan 411201, China;
2. School of Resources and Safety Engineering, Central South University, Changsha 410083, China;
3. Department of Civil Engineering, Faculty of Engineering, University of Malaya,50603 Kuala Lumpur, Malaysia;
4. Department of Mining and Materials Engineering, McGill University, Montreal, Canada
 Central South University Press and Springer-Verlag GmbH Germany, part of Springer Nature 2021
Abstract: Rockburst prediction is of vital significance to the design and construction of underground hard rock mines. A rockburst database consisting of 102 case histories, i.e., 1998-2011 period data from 14 hard rock mines was examined for rockburst prediction in burst-prone mines by three tree-based ensemble methods. The dataset was examined with six widely accepted indices which are: the maximum tangential stress around the excavation boundary (MTS), uniaxial compressive strength (UCS) and uniaxial tensile strength (UTS) of the intact rock, stress concentration factor (SCF), rock brittleness index (BI), and strain energy storage index (EEI). Two boosting (AdaBoost.M1, SAMME) and bagging algorithms with classification trees as baseline classifier on ability to learn rockburst were evaluated. The available dataset was randomly divided into training set (2/3 of whole datasets) and testing set (the remaining datasets). Repeated 10-fold cross validation (CV) was applied as the validation method for tuning the hyper-parameters. The margin analysis and the variable relative importance were employed to analyze some characteristics of the ensembles. According to 10-fold CV, the accuracy analysis of rockburst dataset demonstrated that the best prediction method for the potential of rockburst is bagging when compared to AdaBoost.M1, SAMME algorithms and empirical criteria methods.
Key words: rockburst; hard rock; prediction; bagging; boosting; ensemble learning
Cite this article as: WANG Shi-ming, ZHOU Jian, LI Chuan-qi, Danial Jahed ARMAGHANI, LI Xi-bing, Hani S. MITRI. Rockburst prediction in hard rock mines developing bagging and boosting tree-based ensemble techniques [J]. Journal of Central South University, 2021, 28(2): 527-542. DOI: https://doi.org/10.1007/s11771-021-4619-8.
1 Introduction
Rockburst as a common geological and dynamic hazard commonly occurs in the underground hard rock mines [1-3]. The occurrence of rockburst is caused by the release of accumulated energy in the rock in a violent way [4]. Rockbursts occurred suddenly and intensely which usually results in considerable damage to equipment/infrastructure and may even bring about injuries and fatalities [5-7]. Nowadays, with the scarcity of minerals in the shallower formations, mining must move farther from the surface and more widely, which could make the problem of rockburst worse [2, 8]. It is imperative to know whether rock excavations would burst or not. Thus, the rockburst prediction with high accuracy is crucial for reducing the risk of rockburst hazards and improving the level of mining safety in preliminary design. Although it is not easy to precisely forecast the rockburst during activies of mining, in the past several decades, extensive rockburst studies have been implemented in China, South Africa, Australia, Canada, and many other countries [2, 3, 9-13]. Many researchers have published a great deal of valuable results by ways of the electromagnetic radiation method, microseismicity monitoring, empirical criteria classification, in situ testing methods, as well as probabilistic methods on predicting rockbursts [1, 2, 5, 10, 13-15]. Moreover, various types of empirical methods and preliminary & qualitative judgment prediction methods investigated the mechanical characters of rockbursts through combining local monitoring data and laboratory tests, and are often applied in practice engineering design. These collective efforts have greatly improved the understanding of rockbursts. As pointed out by ZHOU et al [2], however, universal and practical rockburst criteria are rather difficult endorsed in hard rock mines.
Besides the abovementioned works, many statistical machine learning (ML)-based approaches for rockburst prediction have been investigated during recent decades. Most cited data-driven researches are reported in Figure 1 [2, 5, 13, 16-23]. Conventional discriminant analysis (DA)-based techniques such as Mahalanobis distance DA [18], Fisher DA [19], quadratic and partial least squares DA [13] are among the most commonly-used for rockburst classification based on real case histories. However, the disadvantage of the DA classifier is that it is suitable for a class of data with a unimodal Gaussian distribution and therefore, can only be successfully applied to such scenarios. Moreover, many supervised learning (SL) techniques including adaptive neural fuzzy inference system (ANFIS), artificial neural network (ANN), decision tree, random forest (RF), naive Bayes (NB), K-nearest neighbor (KNN), support vector machine (SVM), and gradient boosting machine (GBM) have been applied in this field. These models have been confirmed the ability to operate on sets of input and output data from rockburst case histories. Compared with traditional prediction models, the greatest strength of SL modeling techniques is their high efficiency to capture the nonlinear relationships between features of the dataset instead of assuming a preconceived interaction between inputs and output (s). Although these methods are able to achieve satisfactory results, they have several identified shortcomings. For example, the potential shortcomings of ANN include slow learning rate and falls into local minima [24]. The modeling with ANFIS model and fining the best membership functions and rules of inputs is time-consuming [21, 25-27]. The SVM classifier is limited by the increase in the number of training vectors which lead to computation and storage requirements increased rapidly [28]. In large processing time, kNN algorithm has some limitations to classify a new unknown observation and difficult to improve the classification accuracy when deal with the multidimensional data [29]. Unable to learn the interaction between two predictors/features under the conditional independence assumption is the main disadvantage of NB [2]. Although many rockburst estimation models have already been described and compared by previous researchers, developing the accurate and reliable rockburst predictive model still poses considerable challenge for burst-prone grounds [2, 5, 21, 30-36]. Moreover, many other models for forecasting the rockburst can be considered an efficient and valuable tool to be applied in other geological and mining engineering applications. Particularly, some engineers and scholars are increasingly interested in combining the output of several basic classification techniques into one integrated output using data mining technology, integrated learning and soft computing methods to improve classification accuracy [13, 37-40]. However, the integration method has less- contribution to the rockburst classification than other fields and requires more extensive experimental works.
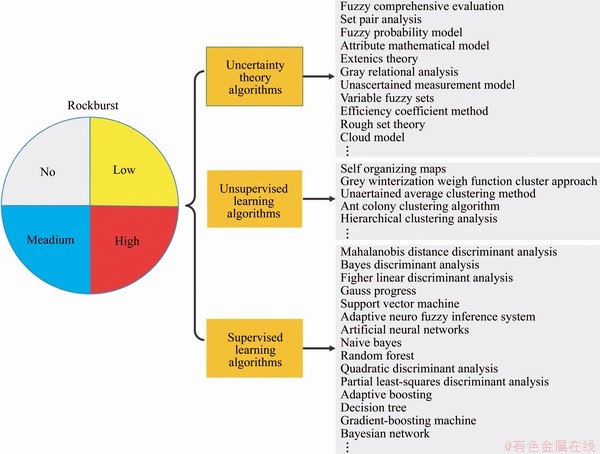
Figure 1 Most cited applications of data-driven approaches for rockburst prediction
In order to fill the research gap, this paper investigates a comparative study on the effectiveness of ensemble learning in rockburst classification developing two ensemble methods, i.e., bagging [41], and boosting [42, 43]. Above methods can be conducted by developing a series of predictive models which are based on a given algorithm named the base classifier and vote on all models in the set to make predictions on new observations. Classification and regression trees (CART) conduct by BREIMAN et al [44], is one of the most favoured algorithms for constructing classification trees and is usually used as a base classifier in a classification problem. According to above discussion, the objective of this investigation is the contribution to examine the ability of three CART-based ensemble algorithms for the potential of rockbursts prediction in hard rock mines. To accomplish this goal, a research methodology was developed for the comparison of the performance of different tree-based ensemble learning algorithms, including bagging, boosting and CART. These algorithms were particularly selected due to their attractions and attentions in various fields of science and engineering. However, to the best knowledge of the authors, they have not been carefully compared with each other for prediction of rockbursts in hard rock mines. The rest of this paper includes some explanations regarding established database and existing empirical models; then, rockburst prediction in burst-prone mines using boosting and bagging tree-based ensemble methods are developed and examined; margin analysis and the variable relative importance are also employed to analyze the performance of proposed models.
2 Database of rockbursts and empirical models
2.1 Calibration of database
The original database of rockbursts was reported in the study conducted by ZHOU et al [5] with 132 case histories and updated by ZHOU et al [13] with 246 case histories from many kinds of underground projects (i.e., underground powerhouse, cavern and tunnel of hydropower station, railway and road tunnel, coal and hard rock mines). These databases have been widely- employed in previous researches [1, 20, 21, 32, 45-47]. With the aim of examining the performance of the developed tree-based ensemble approaches for estimating the potential of rockbursts in burst-prone ground, the data utilized in the present investigation consists of 102 cases of rockburst events collected from 14 underground hard rock mines with published research works, and is part of previous database and all the data sources have been referenced [5, 13]. Field data obtained from Italian (Raibl lead zinc mine) mine and Russia mine (Soviet Rasvumchorr workings) besides China hard rock mines including Baima Iron Mine, Chengchao Iron Mine, Beiminghe Iron Mine, Maluping Phosphate Mine, Xincheng Gold Mine, Linlong Gold Mine, Fankou Lead-Zinc Mine, Jinchuan Nickel Mine, Tonglushan Copper Mine, Dongguashan Copper Mine and Hongtoushan Copper Mine. Out of all the parameters involved in formulating the present model, the values of parameters are used directly as available in the database.
2.2 Data description
The boxplot of the initial dataset is provided in Figure 2(a). Obviously, the median is not in the center of the box for most of the data labels, which means that the distribution of most data labels is not symmetric (Figure 2(a)). Note that the circles with blue color indicating outliers. All dependent indicators have some outliers expect for the uniaxial compressive strength (UCS or ��c) of the rock, the maximum tangential stress (����=MTS) around the opening and the stress concentration factor (SCF=����/��c) for H rockburst intensity and, the uniaxial tensile strength (UTS or ��t) of the rock and BI (rock brittleness index (BI=��c/��t)) for L rockburst intensity, UCS, Wet or EEI (elastic strain energy index) and SCF for M rockburst intensity, UTS, SCF and MTS for N rockburst intensity. The distribution of the rockburst events used in this work after 1998 is shown in Figure 2(b) as a pie chart demonstrating the proportion of the four types of rockburst intensity in underground mines, categorized as none (N, 17 cases), low (L, 26 cases), moderate (M, 26 cases) and high (H, 33 cases). Obviously, this dataset contains a few class imbalance or sampling bias. The relevant input indicators used in the development of the rockburst prediction model with general statistical characteristics are shown in Figure 2(c) (i.e., range, mean, standard deviation, median, skew and kurtosis). Figure 3 shows the scatterplot matrix in the upper half whereby RPC is the rockburst prediction classification. The matrix shows bivariate scatterplots with LOWESS smooth curves and Pearson correlation values as a side effect [48], while the two-dimension kernel density estimates and contours are in the lower half, and the histograms for each parameter are depicted on the diagonal. From Figure 3, it is evident that the parameter MTS is correlated with SCF. In addition, the joint contours of the kernel density estimation between these paired indicators is obviously asymmetric under most circumstances.
2.3 Results on rockburst full data by empirical criteria methods
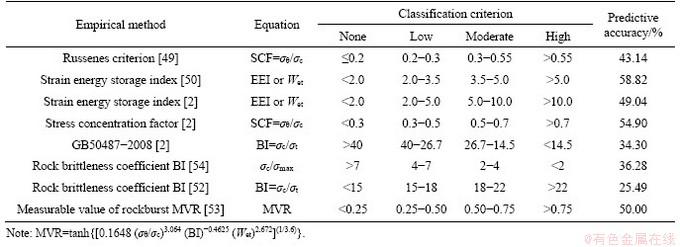
Several conventional empirical criteria such as Russenes criterion [49]; EEI [2, 50], SCF [51], BI [51, 52], GB50487-2008 and measurable values of rockburst (MVR) [53] are applied to evaluating the rockburst potential of 102 case histories. The applied empirical criteria associated with their predictive performance on the whole dataset are presented in Table 1. The predictive accuracy of above methods is 25.4% (BI by ZHANG et al [52]) to 58.82% (MVR by ZHANG et al [53]) of the whole dataset and lower than 60% of the filtered data. Apparently, the accuracy of rockburst estimates from empirical criteria is often not satisfactory due to the influence of various conditions on rockburst and its complexity of the features. Fundamentally, these empirical methods come from their own specific engineering practice, which leads to the strong dependence of these methods on the specific engineering background. In this paper, 102 rockburst cases in 14 mines were collected, and thus the case engineering types were extensive, and the locations were quite different. Moreover, the characteristics of the empirical method itself determine that it is not a universal method. Therefore, it can be concluded that the abovementioned empirical criteria cannot achieve desirable prediction results from the predictive accuracy on these rockburst cases.
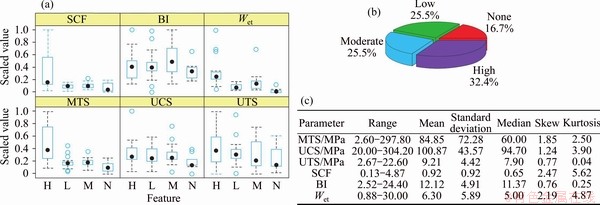
Figure 2 Data description and visualization of combined rockburst database for tree-based ensemble modeling
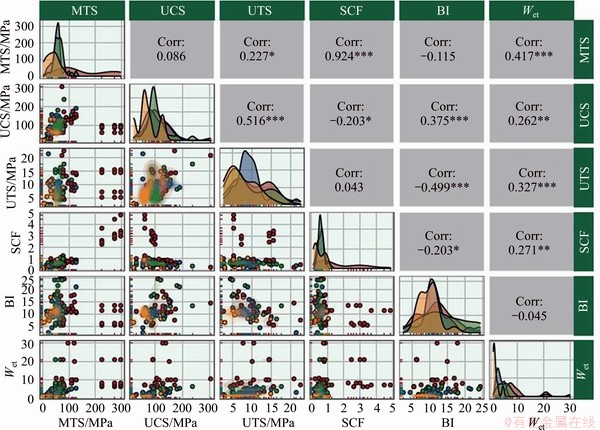
Figure 3 Scatterplot matrix of rockburst samples for six parameters
Table 1 Classification results of rockbursts with whole dataset using conventional empirical criteria
3 Methodology
3.1 Classification and regression trees (CART)
Recursive partitioning [55] is one of the typical decision tree methods. Herein we used CART which is a form of binary recursive partitioning [44]. The developing of CART model comes from the recursive partitioning of dataset: the constitutive model is defined as a tree structure whose nodes are associated with data splitting along one variable [56, 57].
3.2 Bagging
BREIMAN [41] introduced bagging (Bootstrap aggregating for short) ensemble learning technology, which can improve classification accuracy and generalize data patterns. Based on the training set (Sn), Q bootstrap samples (Sq) are obtained, where q=1, 2, ��, Q. Getting these bootstrap samples requires drawing the same number of elements as the original set (n in this case) to replace. Partial guidance samples may reject or at least filter partial noise observations, which means that the classifiers in these sets behave better than the classifiers constructed in the original sets. Therefore, bagging is conducive to the establishment of a better classifier for training sets with noisy observations. Bagging follows three simple steps (see Figure 4(a)) [37, 58]:
1) m samples were randomly created from the training data set. Some slightly different data sets are allowed to be created in the bootstrapped samples, but the distribution should be the same as the entire training set;
2) The classifier built for each bootstrap sample comes from training an unpruned and single regression tree;
3) The average prediction value is obtained before the average individual predictions of these multiple classifiers.
3.3 Boosting
FREUND and SCHAPIRE [42] imposed a boosting ensemble learning technology to improve classification accuracy by transforming a set of weak classifiers into strong classifiers. Boosting provides sequential learning of the predictors, and the major procedure of boosting algorithm is illustrated in Figure 4(b). In the proposed boosting algorithm for multi-class classification problems, two typical boosting algorithms, called AdaBoost.M1 [37, 42] and SAMME [43, 58], have been chosen due to their simplicity and natural extensions.
1) AdaBoost.M1 algorithm
AdaBoost.M1 is based on AdaBoost which was first tried on multiple classification problems and has been widely-used [37, 42, 58]. Given a training set Sn={(x1; y1), ��, (xi, yi), ��, (xn, yn)} where yi takes values in 1, 2, ��, k. Each observation xi gets the corresponding weight wq(i) and the initial value is set to 1/n, and then the initial value is updated with the number of steps. Constructing a basic classifier Cq(xi) on this new training set (Sq) and apply it to each training example. The eq indicates the error of the classifiers and is calculated as follows [42]:
 (1)
(1)
where I(��) is the indicator function which outputs 1 indicating that the internal expression is true, whereas an output of 0 indicates that the internal expression is false.
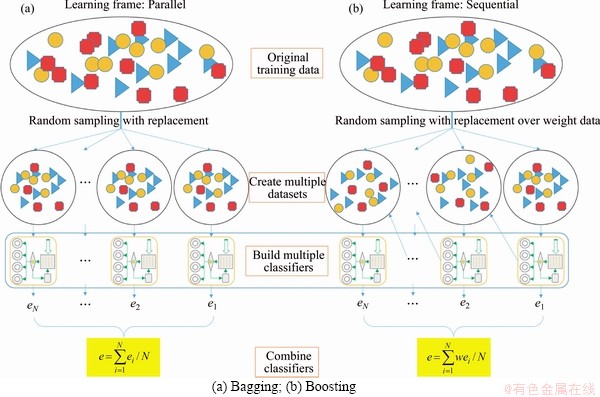
Figure 4 Approach to bagging and boosting-based ensemble methodologies:
The update of weights requires a constant q to be calculated by the error of the classifier in the qth iteration. According to FREUND and SCHAPIRE [42], q=ln[(1�Ceq)/eq]. However, BREIMAN [59] used q=0.5ln[(1�Ceq)/eq]. Thus, the new weight for the (q+1)th iteration will be as follows:
wq+1(i)=wq(i)exp[��qI(Cq(xi)��yi)] (2)
The process step is repeated with the change of q, q=1, 2, ��, Q. The ensemble classifier calculates the voting weights and values of each class. Then, the class with the highest vote is assigned. Specifically,
 (3)
(3)
2) SAMME algorithm
SAMME (short for stagewise additive modeling with loss function of multi-class exponential), is the second boosting algorithm implemented herein. Its theoretical development is first introduced by ZHU et al [43]. Note that, there is no difference between the SAMME algorithm and AdaBoost.M1 except for the calculation of the alpha constant based on the number of classes.
Because of this modification, the SAMME algorithm only requires that (1-eq)>1/k in order for the alpha constant to be positive and the weight will update to follow the right direction [58], that is ��q=ln(k-1)+ln[(1-eq)/eq]. Therefore, the accuracy of any weak classifier should be higher than the accuracy of random guess (1/k) rather than the fixed value 0.5, which is an appropriate requirement for the two-class case but very demanding for the multi-class one.
3.4 Margin analysis
The margin of an object is closely related to the certainty of its classification and is determined according to the difference between the support of the true label and the maximum support of the false label [38, 58, 60]. For the k class, the margin of each sample xi is obtained by the votes of each class j in the final ensemble, which are called the support degree or posterior probability of different classes ��j(xi), j=1, 2, ��, k as:
 (4)
(4)
where c is the correct class of xi and 
Once the data distribution D is determined, the margin distribution graph (MDG) is defined as the fraction of instances whose margin is at most �� as a function of �ˡ�[-1, 1] [60].
R(��)=|D��|/|D| (5)
where D��={x:margin(x)�ܦ�}, �ˡ�[-1, 1], |��| represents size operation, and R(��)��[0, 1].
Therefore, negative classified examples could only appear in all misclassified examples, while positive classified examples only exist in correctly classified examples [61]. The margin value for positive classified observations with high confidence will approach 1. On the other hand, the sample margin value with uncertain classification is small.
3.5 Evaluation criteria
Accuracy is a major concern metric in ML and the classification accuracy rate (CAR) is taken as the evaluation criterion of the prediction ability of the ensemble tree-based ensemble algorithm for rockburst data [62], which is defined as the percentage of the amount of cases truly predicted in the classification model to the total amount of cases, the main evaluation criterion. The CAR expression is as follows:
 (6)
(6)
4 Tree-based ensemble methods for rockburst classification
4.1 Indicator analysis
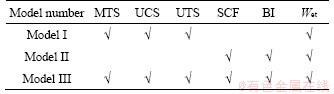
By evaluating the occurring rockburst cases and considering their main results and theoretical methods, a series of single indices or standards for evaluating the occurrence and intensity of rockbursts have been put forward to analyze the rockburst phenomena from multiple angles [2, 5, 13]. Empirical criterion method for rockburst estimation is primarily used stress/strength, brittleness, energy and critical depth-based approaches [2, 5]. The index characteristic of rock often guides and decides the planning and design of civil engineering and mining excavation and is also closely related to the rockburst phenomenon in hard rock mines [60, 61]. Therefore, it is generally accepted in many mines to use appropriate rock index to identify rockburst tendency [62] particularly UCS and UTS of intact rock are commonly taken as rockburst potential indicator [5, 20]. In addition, MTS is another rockburst indicator because it can reflect the effect of hydrologic conditions (mainly groundwater), rock stress environment, opening shape and diameter factors on rockbursts around the opening [13, 49, 63-67]. Meanwhile, the EEI index defined by KIDYBINSKIA [51] is another key indicator of inducing rockburst in hard rock mine. MARTIN et al [68] mentioned that rockbursts in brittle hardrock may occur when the SCF reached at some values. Additionally, the rock brittleness, BI, as inherent physicomechanical property of rocks usually, is applied to estimating the potential of rockbursts [2, 69, 70]. Besides, other engineers considered the microseismic events for degree of clustering is proportional with the decrease of fractal dimension [70]. However, data are needed on the microseismic event distribution and the proximity of the events to the seismic source (hypocenter) which is difficult to be available in our dataset. Based on these considerations, the input parameters studied in this paper are the six indicators (MTS, UCS, UTS, SCF, BI and EEI), which are also the main indicators for quantitative assessment of rockburst activities hard rock mines. Additionally, in previous data-driven researches equal widely used these indicators [5, 13, 20, 21, 32, 46, 62]. Meanwhile, the potential of rockbursts is defined using four intensities: none (N), low (L), medium (M) and high (H). RUSSENES [49] and ZHOU et al [5, 13] described the classification of rockbursts in the combined database. In addition, three different input models are studied which combine the above indices with the tree-based ensemble method to evaluate rock burst, and the traditional parameters of rock burst classification are selected and labeled ���̡� in Table 2. Model I of traditional variables includes MTS, UCS, UTS and EEI. Model II of traditional variables includes SCF, BI and EEI. Model III of traditional variables includes MTS, UCS, UTS, SCF, BI and EEI.
Table 2 Three different models for rockburst assessment with respect to different input attributes combination
4.2 Model development and analysis
This section examines the feasibility of the two boosting (AdaBoost.M1 and SAMME) and bagging classification algorithms using the rockburst dataset, where the CART method is taken as baseline classifier. Figure 5 demonstrates the basic ML terms and procedures for building a tree-based ensemble system. In ML, classifier is used to predict class of new items which must be tested after performance in a given dataset. In this regard, two validation methods were used to guarantee the comparability and to verify the proposed models [13, 71]: (a) Train-test split, which means that the rockburst dataset D is split into two disjointed sets Dtrain (for training) and Dtest (for testing), and (b) k-fold cross-validation (CV) which can effectively avoid over-learning, and the final result is more convincing than other forms [13]. The original dataset is randomly classified for a known category rockburst into two subsets: Dtrain, which is required to estimate model parameters and construct the each rockburst classifier model. In this regard, 2/3 of the available data (68 datasets of all 102 data sets) were considered to form a training dataset; and Dtest is an external validation set that tests the performance and predictive capabilities of each final model. The test data set contains the remaining 34 data. Meanwhile, the adabag package [58] is applied and implemented BREIMAN��s [41] bagging algorithm, FREUND and SCHAPIRE��s [42] Adaboost.M1 algorithm and ZHU��s [43] Adaboost-SAMME algorithm with classification trees as base classifiers using the rpart package [72] within the R environment [73]. Thus, many experiments were performed in R environment associated with rockburst data and tree-based ensemble methods. These algorithms typically use parameter settings based on default or recommended values. Furthermore, variable relative importance and margins analysis are implemented to explain some characteristics of the ensembles. With the aim of showing the advantages of using ensembles, results from a single CART tree as the baseline classifier are compared to those obtained with two Boostings and bagging approaches. Considering the number of rockbursts classes, trees with the maximum depth of 5 and complexity parameter of -1 are used both in the single and the ensemble cases, and the ensembles consist of 250 trees.
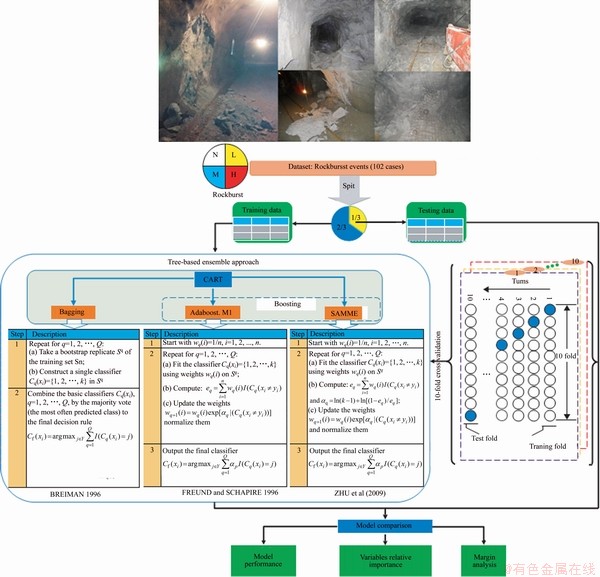
Figure 5 Research architectures of tree-based ensemble approach for rockburst prediction
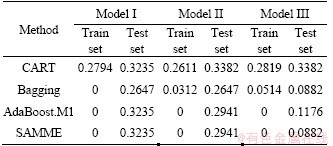
With the aim of comparing the error of the four methods (CART, Bagging, Adaboost.M1 and SAMME), the mean result is calculated after 10 runs, as described in Table 3. For instance, it can be seen that the single CART tree model II with a mean test error of 33.82% is outperformed by Adaboost.M1 and SAMME, 29.41% and 29.41%, respectively, and particularly by bagging with a much lower error (26.47%) maybe because bagging can reduce the variance error. Similarly, results can be found in model I and model III. Apparently,there is not a significant difference between the Adaboost.M1 and SAMME methods for the three models. Taking model III as an example, Figure 6 shows the error development process of training set and testing set. It is obvious from the figure that the error values of training set and testing set are positively correlated with the number of iterations, and the final error of the test set is less than half of the error at the beginning of the iteration. In particular, after the number of iterations reaches the range 50-100, the error between the training set and the testing set tends to stabilize. The performance (CAR) of the test set fell within the range of 67.65% to 91.18% across the twelve models. For tree-based ensemble classifiers, the confusion matrix is also a common way to assess the effectiveness of the proposed models with independent test set (see Figure 7) [13, 74].
Table 3 Testing error for 250 iterations with tree models
As mentioned above, margin distribution information can be reflected to provide useful insights and suggestions for ensemble learning methods with the help of margin analysis [60], and the margins of these ensemble classifiers were obtained by the margin () function in the adabag R package [58]. With the aiming of achiveing the visualization of results, KUNCHEVA [75] introduced MDG model to demonstrate the cumulative distribution of the margins under a given dataset. Hence, the x-axis is the margin (m) as defined in Eq. (4) and the y-axis represents the amount of points where the margin is not greater than m based on Eq. (5). If the cumulative graph is a vertical line at m=1, it means that all points are truly classified and have the greatest possible certainty. The purpose of MDGs of the training set (coloured in orange) and the test set (coloured in blue) is to perform a more detailed margin analysis of the three ensemble learning methods as described above. Figure 8 presents the cumulative distribution of margins for the bagging and two boosting (AdaBoost.M1 and SAMME) classifiers developed on the rockburst datasets in this application. In particular, the cumulative distribution of marginal value 0 (y-axis) in the MDG represents the classification error rate. Obvirously, AdaBoost.M1 and SAMME are always positive due to the null training error as illustrated by the dotted line in Figure 8(a). It should also be indicated that almost 13% and 8% of the observations in bagging, for training set and testing set, respectively, achieve a maximum margin of 1, which is outstanding considering the large number of classes. This observation is also true for the results reported in Table 3. It is hoped that the analysis presented in this study will provide some interesting observations and unique insights into the ensemble learning of marginal analysis.
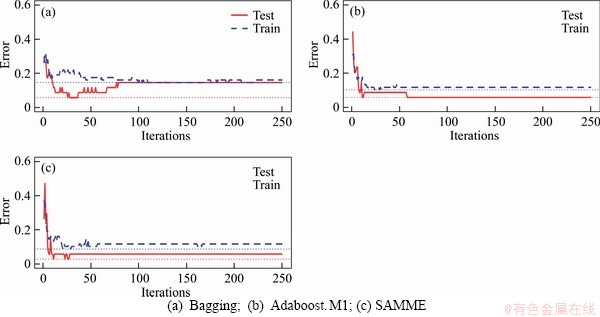
Figure 6 Models error vs number of trees for model III:
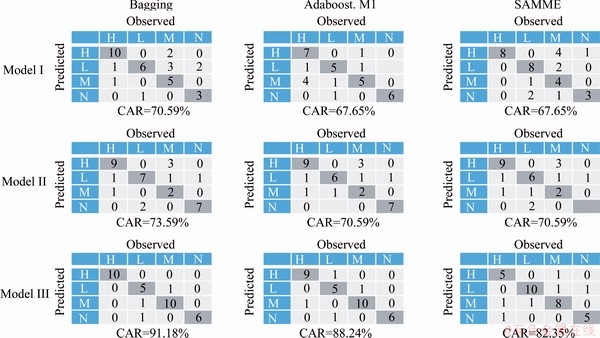
Figure 7 Confusion matrices and associated rockburst classifier accuracies for tree-based ensemble prediction models based on independent test set
Overall, the following observations are made from Table 3 and Figure 8: 1) for the three tree-based ensemble techniques, the performance (CAR) of testing set performance fell within the range of 67.65% to 91.18% across the twelve models; 2) model III with six input indicators is the best one when compared with the results from the two other models with the subsets of attributes; and 3) in the context of determination of rockburst occurrence and the potential of rockburst, these methods can be trained to learn the relationships between the stress condition, rock brittleness and strain energy characteristics with the rockburst activity, requiring no need to know in advance of the form of the relationship between them. It is important to note that these observations are only based on the dataset used in this work. Whether or not such observations can be made to other rockburst datasets is a question that would necessitate that the new dataset be reanalyzed.
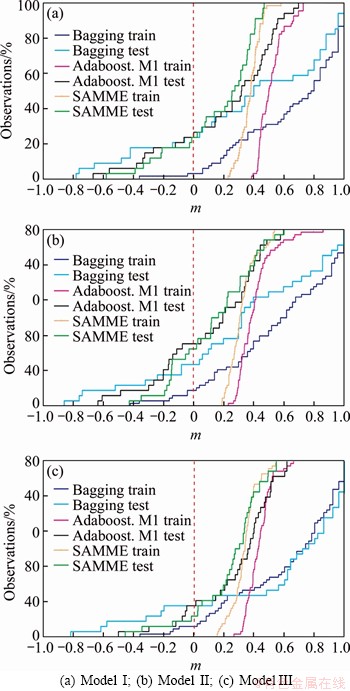
Figure 8 Margin distribution graph for three models with bagging, Adaboost.M1 and SAMME methods over rockburst dataset:
4.3 Relative importance of discriminating features
Unlike unascertained mathematics, fuzzy mathematics, extension theory and cloud model, the developing bagging and boosting tree-based ensemble techniques do not need to determine the weight of each index via analytic hierarchy process and/or information entropy. It is worth noting that bagging and boosting ensemble learning methods can provide relative importance of predictive variables based on their predictability of rockbursts potential. For this goal, the measure of importance considers not only the Gini yield given by a feature in each tree, but also the weights of trees in the bagging, AdaBoost.M1 and SAMME cases. Figure 9 shows the variables ranked by its relative importance value for each rockburst model with bagging and the two boosting ensemble classifiers. In terms of model I (Figure 9(a)), the most sensitive factor in the indicators is EEI, followed by the indicators MTS, UTS, UCS; In terms of model II (Figure 9(b)), EEI has the greatest impact on results when making the same changes compared to other indicators, followed by the indicators SCF, BI; In terms of model III (Figure 9(c)), EEI is still the most sensitive factor among the indicators, followed by the indicators MTS, SCF, UTS, UCS, and BI. Findings demonstrate that among the rockburst classification prediction indicators, EEI is also the most relevant predictor. Destress blasting techniques commonly used to avoid high-stress concentrations around underground openings have been proven very effective to mitigate the risks of rockburst [76].
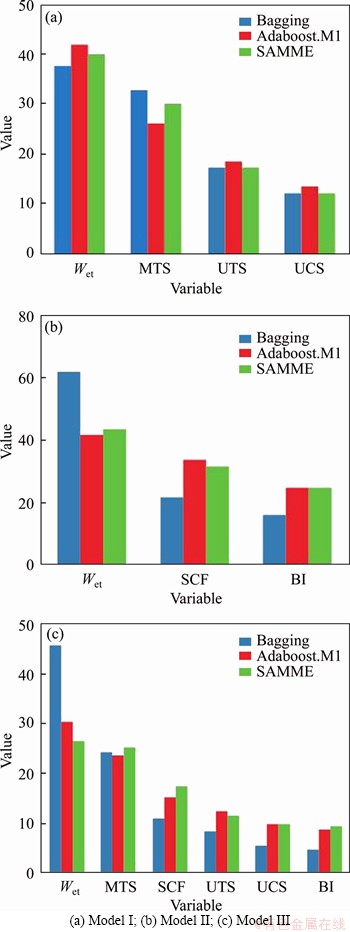
Figure 9 Variables relative importance for each model:
4.4 Limitations
There are some limitations regarding this work that will be perfected in future research. First, the proposed ensemble method is designed for general purpose but is only validated on 102 datasets. Additional datasets can be used for further validation. Secondly, class imbalance and sampling bias are two representative important factors of model uncertainty that have an impact on the predictive probability of rockburst classification models and should be addressed in future studies. Thirdly, tuning hyper-parameters of ensemble models and combining more baseline classifier models are not addressed for further improvement on the performance of ensemble techniques in this work. Meanwhile, the rockburst is associated with in-situ stress, rock property, structure of rock mass, and dynamic disturbance effect on rockbursts [2, 4, 63, 64]. Thus it is very difficult to predict time- space distribution of rockburst exactly. Moreover, note that only strainburst type in hard rock mines is developed in this work, other types of rockburst such as fault-slip are not addressed due to data limitation. Also, other additional indicators such as peak particle velocity (PPV) [60, 61] at the time of rockburst and local geological joint or fractures [62, 77] may be applied to improving the performance of rockburst potential prediction; however, collecting such data can be cumbersome. Finally, the ��black box�� feature of the ensemble algorithm is a dark cloud that hangs over the complex relationship between the interpreted response and the predictor variable.
5 Conclusions
Models for forecasting rockburst with high accuracy can be beneficial tools for mitigating the risk of rockburst hazards and strengthening mine safety in burst-prone grounds. In this work, six traditional rockburst indicators were measured and three CART-based models for ensemble approaches were presented and compared for the prediction of rockburst in hard rock mines can be beneficial tools for work in burst-prone grounds. A data set of 102 rockburst cases compiled from 14 hard rock mines is applied to developing the proposed models. Findings reveal that the performance of the proposed models with combination of the indicators with ensemble methods works much better than that with eight empirical criteria. Bagging was particularly found to be the best model among all three ensemble methods, while there is not a big difference between the two boosting methods from the aspect of accurancy. These results illustrated that ensemble learning approaches can be taken as a viable tool for identifying rockburst. Meanwhile, bagging and two boosting methods demonstrate that the EEI index is the most relevant indicator among the features for the task of rockburst classification prediction. In summary, the main work of this paper was to provide a relatively reliable model for rockburst prediction. To further enhance the accuracy of prediction models, the authors hope to fuse the results obtained from different empirical criteria and ML methods in future work with more rockburst case histories.
Contributors
WANG Shi-ming and ZHOU Jian provided the concept and wrote the original draft of manuscript. ZHOU Jian, LI Chuan-qi and Danial Jahed ARMAGHANI collected, visualized and analyzed dataset, conducted the models. LI Xi-bing and Hani S. MITRI edited the draft of manuscript.
Conflict of interest
The authors declare that they have no conflicts of interest.
References
[1] LI X, ZHOU J, WANG S, LIU B. Review and practice of deep mining for solid mineral resources [J]. Chinese Journal of Nonferrous Metals, 2017, 27(6): 1236-1262. DOI: 10.19476/j. ysxb.1004.0609.2017. 06.021. (in Chinese)
[2] ZHOU J, Li X, Mitri H S. Evaluation method of rockburst: State-of-the-art literature review [J]. Tunn Undergr Sp Tech, 2018, 81: 632-659. DOI: 10.1016/j.tust.2018.08.029.
[3] LI X, GONG F, TAO M, DONG L, DU K, MA C, ZHOU Z, YIN T. Failure mechanism and coupled static-dynamic loading theory in deep hard rock mining: A review [J]. Journal of Rock Mechanics and Geotechnical Engineering, 2017, 9(4): 767-782. DOI: 10.1016/j.jrmge.2017.04.004.
[4] Kaiser P K, McCreath D R, Tannant D D. Canadian rockburst research program 1990-1995, vols 1-6 [R]. Sudbury, Ontario: CAMIRO Mining Division, 1997.
[5] Zhou J, Li X B, Shi X Z. Long-term prediction model of rockburst in underground openings using heuristic algorithms and support vector machines [J]. Safety Science, 2012, 50(4): 629-644. DOI: 10.1016/j.ssci.2011.08.065.
[6] Gong F Q, Si X F, Li X B, Wang S Y. Experimental investigation of strain rockburst in circular caverns under deep three-dimensional high-stress conditions [J]. Rock Mechanics and Rock Engineering, 2019, 52(5): 1459-1474. DOI: 10.1007/s00603-018-1660-5.
[7] Si X, Gong F. Strength-weakening effect and shear-tension failure mode transformation mechanism of rockburst for fine-grained granite under triaxial unloading compression [J]. International Journal of Rock Mechanics and Mining Sciences, 2020, 131: 104347. DOI: 10.1016/j.ijrmms.2020. 104347.
[8] Shi X Z, Zhou J, Dong L, Hu H Y, Wang H Y, Chen S R. Application of unascertained measurement model to prediction of classification of rockburst intensity [J]. Chinese Journal of Rock Mechanics and Engineering, 2010, 29(s1): 2720-2727. (in Chinese)
[9] Ortlepp W D. RaSiM comes of age��A review of the contribution to the understanding and control of mine rockbursts [C]// POTVIN Y, HUDYMA M. Controlling Seismic Risk��Proceedings of Sixth International Symposium on Rockburst and Seismicity in Mines. Australian Centre for Geomechanics, 2005: 3-20.
[10] Weng L, Huang L Q, Taheri A, Li X B. Rockburst characteristics and numerical simulation based on a strain energy density index: A case study of a roadway in linglong gold mine, China [J]. Tunnelling & Underground Space Technology, 2017, 69: 223-232. DOI: 10.1016/j.tust.2017. 05.011.
[11] Jiang Q, Feng X T, XIang T B, Su G S. Rockburst characteristics and numerical simulation based on a new energy index: A case study of a tunnel at 2,500 m depth [J]. Bulletin of Engineering Geology and the Environment, 2010, 69(3): 381-388. DOI: 10.1007/s10064-010-0275-1.
[12] ZHU G a, DOU L M, CAO A y, CAI W, WANG C b, LIU Z g, LI J. Assessment and analysis of strata movement with special reference to rock burst mechanism in island longwall panel [J]. Journal of Central South University, 2017, 24(12): 2951-2960. DOI: 10.1007/s11771-017-3709-0.
[13] Zhou J, Li X, Mitri H S. Classification of rockburst in underground projects: Comparison of ten supervised learning methods [J]. Journal of Computing in Civil Engineering, 2016, 30(5): 04016003. DOI: 10.1061/(ASCE)CP.1943-5487. 0000553.
[14] Luo Y, Gong F Q, Li X B, Wang S Y. Experimental simulation investigation of influence of depth on spalling characteristics in circular hard rock tunnel [J]. Journal of Central South University, 2020, 27(3): 891-910. DOI: 10.1007/s11771-020-4 339-5.
[15] Mitri H S, Tang B, Simon R. FE modelling of mining-induced energy release and storage rates [J]. The Journal of the South African Institute of Mining and Metallurgy, 1999, 99(2): 103-110.
[16] GONG F, YAN J, LI X, LUO S. A peak-strength strain energy storage index for rock burst proneness of rock materials [J]. International Journal of Rock Mechanics and Mining Sciences, 2019, 117: 76-89. DOI: 10.1016/ j.ijrmms.2019.03.020
[17] Feng X T, Wang L N. Rockburst prediction based on neural networks [J]. Transactions of Nonferrous Metals Society of China, 1994, 4(1): 7-14.
[18] Gong F Q, Li X B. A distance discriminant analysis method for prediction of possibility and classification of rockburst and its application [J]. Chinese Journal of Rock Mechanics and Engineering, 2007, 26(5): 1012-1018. (in Chinese)
[19] Zhou J, Shi X Z, Dong L, Hu H Y, Wang H Y. Fisher discriminant analysis model and its application for prediction of classification of rockburst in deep buried long tunnel [J]. Journal of Coal Science and Engineering, 2010, 16(2): 144-149. (in Chinese)
[20] Liu Z, Shao J, Xu W, Meng Y. Prediction of rock burst classification using the technique of cloud models with attribution weight [J]. Natural Hazards, 2013, 2: 549-568. DOI: 10.1007/s11 069-013-0635-9.
[21] Adoko A C, Gokceoglu C, Wu L, Zuo Q J. Knowledge-based and data-driven fuzzy modeling for rockburst prediction [J]. International Journal of Rock Mechanics and Mining Sciences, 2013, 61: 86-95. DOI: 10.1016/j.ijrmms.2013.02.010.
[22] Zhou J, Shi X Z, Huang R D, Qiu X Y, Chen C. Feasibility of stochastic gradient boosting approach for predicting rockburst damage in burst-prone mines [J]. Trans Nonferrous Meterol Soc China, 2016, 26: 1938-1945. DOI: 10.1016 /S1003-6326(16)64312-1.
[23] Zhou J, Guo H, Koopialipoor M, Armaghani D J, Tahir M M. Investigating the effective parameters on the risk levels of rockburst phenomena by developing a hybrid heuristic algorithm [J]. Engineering with Computers, 2020: 1-16. DOI: 10.1007/s00366-019-00908-9.
[24] LE L T, NGUYEN H, DOU J, ZHOU J. A comparative study of PSO-ANN, GA-ANN, ICA-ANN, and ABC-ANN in estimating the heating load of buildings�� energy efficiency for smart city planning [J]. Applied Sciences, 2019, 9(13): 2630. DOI:10.3390/app9132630.
[25] ZHOU J, LI C, ARSLAN C A, HASANIPANAH M, AMNIEH H B. Performance evaluation of hybrid FFA-ANFIS and GA-ANFIS models to predict particle size distribution of a muck-pile after blasting [J]. Engineering with Computers, 2019. DOI: 10.1007/s00366-019-00822-0.
[26] ZHOU J, NEKOUIE A, ARSLAN C A, PHAM B T, HASANIPANAH M. Novel approach for forecasting the blast-induced AOp using a hybrid fuzzy system and firefly algorithm [J]. Engineering with Computers, 2020, 36(2): 703-712. DOI: 10. 1007/s00366-019-00725-0.
[27] Marzi H, Haj Darwish A, Helfawi H. Training ANFIS using the enhanced Bees Algorithm and least squares estimation [J]. Intelligent Automation & Soft Computing, 2017, 23(2): 227-234. DOI: 10.1080/10798587.2016.119 6880.
[28] YU Z, SHI X, ZHOU J, CHEN X, MIAO X, TENG B, IPANGELWA T. Prediction of blast-induced rock movement during bench blasting: Use of gray wolf optimizer and support vector regression [J]. Natural Resources Research, 2020, 29(2): 843-65. DOI: 10.1007/s11053- 019-09593-3.
[29] ZHANG S. Cost-sensitive KNN classification [J]. Neurocomputing, 2020, 391: 234-242. DOI: 10.1016/j.neuc om.2018.11.101.
[30] He M, Xia H, Jia X, Gong W, Zhao F, Liang K. Studies on classification, criteria and control of rockbursts [J]. Journal of Rock Mechanics and Geotechnical Engineering, 2012, 4(2): 97-114. DOI: 10.3724/SP.J. 1235.2012.00097.
[31] Cai W, Dou L, Zhang M, Cao W, Shi J Q, Feng L. A fuzzy comprehensive evaluation methodology for rock burst forecasting using microseismi monitoring [J]. Tunnelling and Underground Space Technology, 2018, 80: 232-245. DOI: 10.1016/j.tust.2018.06.029.
[32] Afraei S, Shahriar K, Madani S H. Developing intelligent classification models for rock burst prediction after recognizing significant predictor variables, Section 1: Literature review and data preprocessing procedure [J]. Tunnelling and Underground Space Technology, 2019, 83: 324-353.
[33] Gong F Q, Li X B, Zhang W. Rockburst prediction of underground engineering based on Bayes discriminant analysis method [J]. Rock and Soil Mechanics, 2010, 31(Suppl 1): 370-377. DOI: 10.1109/VETECS.2006. 1683241. (in Chinese)
[34] Li T Z, Li Y X, Yang X L. Rock burst prediction based on genetic algorithms and extreme learning machine [J]. Journal of Central South University, 2017, 24(9): 2105-2113. DOI: 10.1007/s 11771-017-3619-1.
[35] Zhou J, Koopialipoor M, Li E, ARMAGHANI D J. Prediction of rockburst risk in underground projects developing a neuro-bee intelligent system [J]. Bulletin of Engineering Geology and the Environment, 2020, 5: 1-15. DOI: 10.1007/s10064-020-01788-w.
[36] WANG C, WU A, LU H, BAO T, LIU X. Predicting rockburst tendency based on fuzzy matter�Celement model [J]. International Journal of Rock Mechanics and Mining Sciences, 2015, 75: 224-232. DOI: 10.1016/j.ijrmms.2015. 02.004.
[37] Hastie T, Tibshirani R, Friedman J. The elements of statistical learning: Data mining, inference, and prediction [M]. 2nd ed. New York: Springer-Verlag, 2009.
[38] Kim M J, Kang D K. Ensemble with neural networks for bankruptcy prediction [J]. Expert Systems with Applications, 2010, 37(4): 3373-3379. DOI: 10.1016/j.eswa.2009.10.012.
[39] Chou J S, Chieh L C. Predicting disputes in public- private partnership projects: Classification and ensemble models [J]. Journal of Computing in Civil Engineering, 2013, 27(1): 51-60. DOI: 10.1061/(ASCE)CP.1943-5487.0000197.
[40] Zhou J, Shi X, Du K, Qiu X, Li X, Mitri H S. Feasibility of random-forest approach for prediction of ground settlements induced by the construction of a shield-driven tunnel [J]. International Journal of Geomechanics, 2017, 17(6): 04016129. DOI: 10.1061/ (ASCE)GM.1943-5622.0000817.
[41] Breiman L. Bagging predictors [J]. Machine Learning, 1996, 24(2): 123-140. DOI: 10.1007 /BF00058655.
[42] Freund Y, Schapire R E. Experiments with a new boosting algorithm [C]// Proceedings of the Thirteenth International Conference on Machine Learning. Morgan Kaufmann, 1996: 148-156.
[43] Zhu J, Zou H, Rossez S, Hastie T. Multi-class AdaBoost [J]. Statistics and its Interface, 2009, 2: 349-360. DOI: 10.4310/SII.2009.v2.n3.a8.
[44] Breiman L, Friedman J H, Olshen R A, Stone C J. Classification and regression trees [M]. Wadsworth, Belmont, 1984.
[45] Alfaro E, Garcia N, Gamez M, Elizondo D. Bankruptcy forecasting: An empirical comparison of AdaBoost and neural networks [J]. Decision Support Systems, 2008, 45: 110-122. DOI: 10.1016/j.dss.2007.12. 002.
[46] Faradonbeh R S, Taheri A. Long-term prediction of rockburst hazard in deep underground openings using three robust data mining techniques [J]. Engineering with Computers, 2018, 35(2): 659-675. DOI: 10.1007/s00366- 018-0624-4.
[47] Ghasemi E, Gholizadeh H, Adoko A C. Evaluation of rockburst occurrence and intensity in underground structures using decision tree approach [J]. Engineering with Computers, 2020, 36(1): 213-225. DOI: 10.1007/s00366- 018-00695-9.
[48] Cleveland W S. LOWESS: A program for smoothing scatterplots by robust locally weighted regression [J]. The American Statistician, 1981, 35: 54.
[49] Russenes B F. Analysis of rock spalling for tunnels in steep valley sides (in Norwegian) [D]. Trondheim: Norwegian Institute of Technology, 1974.
[50] Kidybinski A. Bursting liability indices of coal [J]. International Journal of Rock Mechanics and Mining Sciences and Geomechanics Abstracts, 1981, 18(4): 295-304. DOI: 10.1016/0148-9062 (81) 91194-3.
[51] Wang Y H, Li W D, Li Q G, Xu Y, Tan G H. Method of fuzzy comprehensive evaluations for rockburst prediction [J]. Chinese Journal of Rock Mechanics and Engineering, 1998, 17(5): 493-501. (in Chinese)
[52] Zhang J J, Fu B J, Li Z K, Song S W, Shang Y J. Criterion and classification for strain mode rockbursts based on five-factor comprehensive method [C]// Proceedings of the 12th ISRM International Congress on Rock Mechanics, Harmonising Rock Engineering and the Environment. London: Taylor & Francis Group, 2011: 1435-1440.
[53] Zhang G C, Gao Q, Du J Q, Li K K. Rockburst criterion based on artificial neural networks and nonlinear regression [J]. Journal of Central South University (Science and Technology), 2013, 44(7): 2977-2981. (in Chinese)
[54] Peng Z, Wang Y H, Li T J. Griffith theory and rock burst of criterion [J]. Chinese Journal of Rock Mechanics and Engineering, 1996, 15(Suppl): 491-495. (in Chinese)
[55] Hothorn T, Kurt Hornik K, Zeileis A. Unbiased recursive partitioning: A conditional inference framework [J]. Journal of Computational and Graphical Statistics, 2006, 15(3): 651-674. DOI: 10.1198/106186006X133933.
[56] Venables W N, Ripley B D. Modern applied statistics with S [M]. Springer, 2002.
[57] GarzOn M B, Blazek R, Neteler M, de Dios R S, Ollero H S, Furlanello C. Predicting habitat suitability with machine learning models: The potential area of Pinus Sylvestris L. in the Iberian Peninsula [J]. Ecol Model, 2006, 97: 383-393. DOI: 10.1016/j.ecolmodel.2006. 03.015.
[58] Alfaro E, Gamez M, Garcia N. Adabag: An R package for classification with boosting and bagging [J]. Journal of Statistical Software, 2013, 54(2): 1-35. DOI: 10.18637/jss.v054.i02.
[59] Breiman L. Arcing classifiers [J]. The Annals of Statistics 1998, 26(3): 801-849. DOI: 10.1214 /aos/1024691079.
[60] Schapire R E, Freund Y, Bartlett P, Lee W S. Boosting the margin: A new explanation for the effectiveness of voting methods [J]. The Annals of Statistics, 1998, 26(5): 1651-1686.
[61] He H, Cao Y. SSC: A classifier combination method based on signal strength [J]. IEEE Transactions on Neural Networks & Learning Systems, 2012, 23(7): 1100. DOI: 10.1109/TNNL S.2012.2198227.
[62] Grinand C, Arrouays D, Laroche B, Martin MP. Extrapolating regional soil landscapes from an existing soil map: Sampling intensity, validation procedures, and integration of spatial context [J]. Geoderma, 2008, 143: 180-190. DOI: 10.1016/j.geoderma.2007.11.004.
[63] Gong F Q, Luo Y, Li X B, Si X F, Tao M. Experimental simulation investigation on rockburst induced by spalling failure in deep circular tunnels [J]. Tunnelling and Underground Space Technology, 2018, 81: 413-427. DOI: 10.1016/j.tust.2018.07.035.
[64] Tao M, Zhao H, Li X, Li X, Du K. Failure characteristics and stress distribution of pre-stressed rock specimen with circular cavity subjected to dynamic loading [J]. Tunnelling and Underground Space Technology, 2018, 81: 1-15. DOI: 10.1016/j.tust.2018.06.028.
[65] Singh S P. Classification of mine workings according to their rockburst proneness [J]. Mining Science and Technology, 1989, 8(3): 253-262. DOI: 10.1016/S0167- 9031(89)90404-0.
[66] Barton N, Lien R, Lunde J. Engineering classification of rock masses for the design of tunnel support [J]. Rock Mechanics and Rock Engineering, 1974, 6(4): 189-236. DOI: 10.1007/bf01239496.
[67] Hoek E, Brown E T. Underground excavation in rock [M]. London: The Institute of Mining and Metallurgy, 1980.
[68] Martin C, Kaiser P, McCreath D. Hoek-Brown parameters for predicting the depth of brittle failure around tunnels [J]. Canadian Geotechnical Journal, 1999, 36: 136-151. DOI: 10.1139/cgj-36-1-136.
[69] Singh S P. The influence of rock properties on the occurrence and control of rockbursts [J]. Mining Science and Technology, 1987(5): 11-18. DOI: 10.1016/S0167-9031(87) 90854-1.
[70] Xie H. Pariseau W G. Fractal character and the mechanism of rock bursts [J]. International Journal of Rock Mechanics and Mining Sciences & Geomechanics Abstracts, 1993, 30(4): 343-350. DOI: 10.1016/0148-9062(93)91 718-X.
[71] ZHOU J, QIU Y, ZHU S, ARMAGHANI DJ, LI C, NGUYEN H, YAGIZ S. Optimization of support vector machine through the use of metaheuristic algorithms in forecasting TBM advance rate [J]. Engineering Applications of Artificial Intelligence, 2021, 97: 104015.
[72] Therneau T, Atkinson E. An introduction to recursive partioning using the rpart routine [R]. Rochester: Section of Biostatistics, 1997.
[73] Ross I, Robert G. R: A language and environment for statistical computing. R foundation for statistical computing [J]. Journal of Computational and Graphical Statistics, 2008, 5: 299-314. DOI: 10.1890/0012-9658 (2002)083 [3097: CFHIWS]2.0.CO;2.
[74] Zhou J, Li X, Mitri H S. Comparative performance of six supervised learning methods for the development of models of hard rock pillar stability prediction [J]. Natural Hazards, 2015, 79(1): 291-316. DOI: 10.1007/s11069-015-1842-3.
[75] Kuncheva L I. Combining pattern classifiers: Methods and algorithms [M]. New York: Wiley, 2004.
[76] Mitri H S. Practitioner��s guide to destress blasting in hard rock mines [R]. Montreal: McGill University, 2000.
[77] JIANG Q, YANG B, YAN F, LIU C, SHI Y, LI L. New method for characterizing the shear damage of natural rock joint based on 3D engraving and 3D scanning [J]. International Journal of Geomechanics, 2020, 20(2): 06019022. DOI: 10.1061/(ASCE) GM.1943-5622.0001575.
(Edited by YANG Hua)
���ĵ���
�û�������Bagging��Boosting���ɼ���Ԥ��Ӳ�ҿ�ɽ�ұ�
ժҪ���ұ�Ԥ��Ե���Ӳ�ҿ�ɽ����ƺ�ʩ��������Ҫ��ʹ�����ֻ������ļ��ɷ���������102����ʷ����(��1998��2011���ڼ�14��Ӳ�ҿ�ɽ����)��ɵ��ұ����ݿ�����˼�飬���������ұ�������ұ�Ԥ�⡣���ұ����ݼ����������㷺���ܵ�������ָ�꣬�������ڱ߽���Χ���������Ӧ��(MTS)��������ʯ�ĵ��Όѹǿ��(UCS)�͵��Ό��ǿ��(UTS)��Ӧ������ϵ��(SCF)����ʯ����ָ��(BI)��Ӧ���ܴ���ָ��(EEI)���Է�������Ϊ��������������Boosting�㷨(AdaBoost.M1��SAMME)��Bagging�㷨����������������������ѧϰ�ұ������������������ݼ������Ϊѵ����(�������ݼ���2/3)�Ͳ��Լ�(�������ݼ�)�������ظ�10��������֤(CV)��Ϊ����ģ�ͳ���������֤�����������ñʷ����ͱ��������Ҫ�Է����˸�����ѧϰģ�������������ظ�10��������֤��������ұ����ݼ��ľ��ȷ�����������AdaBoost.M1��SAMME�㷨���ұ������о���ȣ�Bagging������Ԥ��Ӳ�ҿ�ɽ�ұ�����ѷ�����
�ؼ��ʣ��ұ���Ӳ�ң�Ԥ�⣻Bagging������Boosting����������ѧϰ
Foundation item: Projects(41807259, 51604109) supported by the National Natural Science Foundation of China; Project(2020CX040) supported by the Innovation-Driven Project of Central South University, China; Project(2018JJ3693) supported by the Natural Science Foundation of Hunan Province, China
Received date: 2020-07-13; Accepted date: 2020-09-04
Corresponding author: ZHOU Jian, PhD, Associate Professor; Tel: +86-18175162802; E-mail: csujzhou@hotmail.com; ORCID: https:// orcid.org/0000-0003-4769-4487

