铅锡合金的真空蒸馏深度脱铅
来源期刊:中国有色金属学报(英文版)2013年第6期
论文作者:贾国斌 杨 斌 刘大春
文章页码:1822 - 1831
关键词:铅锡合金;分子相互作用体积模型;真空蒸馏;活度系数
Key words:Pb-Sn alloy; molecular interaction volume model; vacuum distillation; activity coefficient
摘 要:采用分子相互作用体积模型计算在777 °C时不同Pb含量铅锡合金的活度系数,结果与实验值符合较好。对800~1300 °C全成分范围内铅锡合金的活度系数进行预测,为铅锡金真空蒸馏分离提供必要的热力学参数。对两种不同铅含量的铅锡合金进行小型和工业实验,将锡中的铅含量降至0.01%以下。设计全成分范围的铅锡合金真空蒸馏处理流程,对铅含量10%~90%的铅锡合金经真空蒸馏处理后可得到纯度为99.5%的粗铅和铅含量在0.01%以下的精锡。
Abstract: Activity coefficients of Pb-Sn alloy with different Pb contents at 777 °C were calculated with molecular interaction volume model, which agree well with the available experimental values. Activity coefficients at 800-1300 °C were predicted to supply valuable data for thermodynamic calculation of vacuum distillation. Small-scale and continuous industrialized experiments of vacuum distillation for two different components of Pb-Sn alloys were performed and the lead content in refined tin was decreased to less than 0.01% successfully. Vacuum distillation treatment of Pb-Sn alloy in which lead content fluctuated from 10% to 90% was put forward. The final product is crude lead with purity above 99.5% and refined tin with lead content less than 0.01%.
Trans. Nonferrous Met. Soc. China 23(2013) 1822-1831
Guo-bin JIA1,2, Bin YANG2, Da-chun LIU2
1. General Research Institute for Nonferrous Metals, Beijing 100088, China;
2. National Engineering Laboratory for Vacuum Metallurgy, Kunming University of Science and Technology, Kunming 650093, China
Received 18 April 2012; accepted 9 September 2012
Abstract: Activity coefficients of Pb-Sn alloy with different Pb contents at 777 °C were calculated with molecular interaction volume model, which agree well with the available experimental values. Activity coefficients at 800-1300 °C were predicted to supply valuable data for thermodynamic calculation of vacuum distillation. Small-scale and continuous industrialized experiments of vacuum distillation for two different components of Pb-Sn alloys were performed and the lead content in refined tin was decreased to less than 0.01% successfully. Vacuum distillation treatment of Pb-Sn alloy in which lead content fluctuated from 10% to 90% was put forward. The final product is crude lead with purity above 99.5% and refined tin with lead content less than 0.01%.
Key words: Pb-Sn alloy; molecular interaction volume model; vacuum distillation; activity coefficient
1 Introduction
Lead is a heavy and poisonous metal and can do harm to the environment and human health. Lead free of solder, printed circuits and electronic devices require us to deeply remove lead from tin. Traditional method of removing lead from crude tin includes electrolysis and crystallization. Electrolysis can reduce lead to 0.6%, and crystallization can lower the lead to 0.02% [1]. Adverse operation condition and environmental pollution are their shortcomings. Therefore, the vacuum distillation as a separating technology has a powerful competition ability compared with other metallurgical progresses due to the small space occupied, simple operation and no pollution to the environment. In this work, Pb-Sn alloys were separated successfully by the vacuum distillation in small- scale and continuous industrialized experiments, and lead content in refined tin decreased to less than 0.01%.
Activity coefficient is one of the key roles in thermodynamic calculation, with which we can predict the feasibility and separation degree of the alloy by vacuum distillation. However, the activity coefficient is quite scarce and it is obviously unrealistic to measure all the data experimentally. Therefore, a unique economic and effective method to predict multi-component systems from theories or from thermodynamic models which depend on less experimental data is required. The thermodynamic models suggested so far cannot make accurate prediction for liquid alloys over a wide range of concentration [2], namely, a linear chemical-physical theory model gives a good fit to binary liquid alloys [3], but it is difficult to extend it to ternary systems. The model reported by FAN and ZHOU [4] is only suitable for a dilute metals solution; WILSON’s [5] model cannot be used for liquid-liquid partial miscible systems and their model parameters lack physical understanding. The molecular interaction volume model (MIVM) is a two-parameter model able to predict the component activity coefficients in solid solution, binary, ternary or even multi-component alloys [6,7]. Thus, the MIVM was chosen to predict activity coefficients of Pb-Sn binary alloys to provide valuable data for theoretical calculations in this work.
2 Calculation of activity coefficient of Pb-Sn alloy
The MIVM has a certain physical meaning from the viewpoint of statistical thermodynamics and requires only two binary infinite dilute activity coefficients of each system for the prediction of component activities [8,9]. It is an alternative for the estimation interaction parameters which are absent or whose accuracy is questionable. In MIVM, the activity coefficient (γ) can be calculated by Eq. (1) and Eq. (2).


 (1)
(1)


 (2)
(2)
where xi and xj are the molar fractions; Zi and Zj are the coordination numbers of pure matters; Vm,i and Vm,j are the molar space volumes; Bij and Bji are the pair-potential energy interaction parameters.
The activity coefficients of i-j binary system can be obtained, only using the pair-potential energy interaction parameters Bij and Bji, and they are defined as
 (3)
(3)
 (4)
(4)
where  ,
, and
and are pair-potential energies of i-i, j-j and i-j systems, respectively; k is the Boltzmann constant; T is the thermodynamic temperature.
The average relative error is used to test the MIVM’s validity.
 (5)
(5)
where  and
and  are the experimental data and the predicted values of activity for component i in the liquid alloy, and n is the number of experimental data.
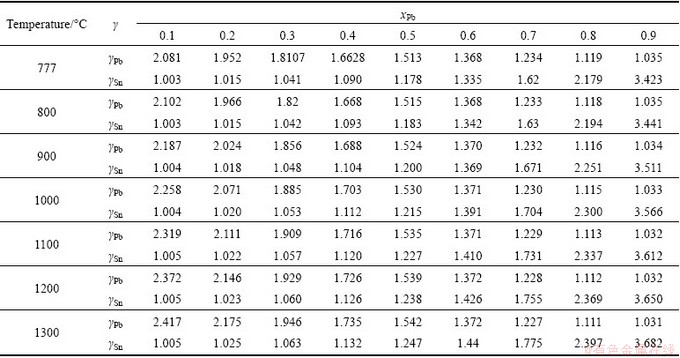
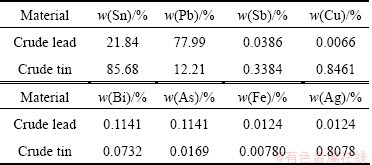
The available experimental activity coefficients [10] of Pb-Sn alloy are listed in Table 1, and the calculated values are listed in Table 2. The calculated activity coefficients with MIVM at 777 °C agree well with the available experimental ones. The average relative errors of Pb and Sn are 1.234% and 1.284%, respectively. Moreover, the predicted activity coefficients in 800-1300 °C are also calculated and shown in Table 2.
Table 1 Experimental activity coefficients of Pb-Sn alloy at 777 °C
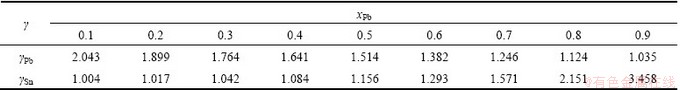
Table 2 Predicted activity coefficients of Pb-Sn alloy
3 Thermodynamic analysis of vacuum distillation
3.1 Saturated vapor pressure
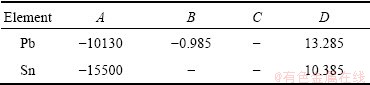
The difference in vapor pressure of different metals at the same temperature is the basic principle of vacuum distillation and the element which has a higher vapor pressure will evaporate first from the alloy. Relationship between the saturated vapor pressure and temperature can be calculated by Eq. (6). The coefficients A, B, C and D for different substances can be found from Ref. [11] and the values of lead and tin are presented in Table 3.
 (6)
(6)
Table 3 Values of A, B, C and D for elements Pb and Sn
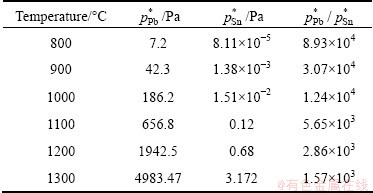
According to Eq. (6), the saturated pressure of different liquid substances can be worked out at a given temperature. Calculated saturated vapor pressures for Pb and Sn are listed in Table 4. As shown in Table 4, lead has a high saturated vapor pressure and is easy to evaporate into vapor phase. However, tin has a low saturated vapor pressure and keeps in the liquid phase. As a result, lead and tin can be theoretically separated with vacuum distillation.
Table 4 Vapor pressures and vapor pressure ratios of Pb and Sn
3.2 Separation coefficient
As the mixing effect of A-B binary alloy, the actual vapor pressures of A and B are not equal to their saturated vapor pressures. It must take the activity a and molar concentration x in binary alloy into account to know the actual vapor pressure. The actual vapor pressures of A and B in binary alloys are deduced as [12]
 (7)
(7)
 (8)
(8)
where ai and aj are the activities;  and
and  are the saturated vapor pressures; xi and xj are the molar concentration; γi and γj are the activity coefficients of i and j, respectively, and the values were chosen from the calculated data with MIVM, mentioned above.
According to Eq.(7) and Eq.(8), the following equation can be deduce as
 (9)
(9)
If
 (10)
(10)
Then
 (11)
(11)
where βi is the separation coefficient of i, which can be used to determine whether element i can be separated from i-j binary alloy by vacuum distillation [13].
As expressed in Fig. 1, for Pb-Sn binary alloy, βPb>1, the content of Pb in vapor phase is more than that in liquid phase. Pb is enriched in vapor phase and Sn is concentrated in liquid phase, thus the binary alloy is separated into lead and tin.

Fig. 1 Separation coefficient of Pb-Sn alloy
3.3 Vapor-liquid phase equilibrium diagram
It is important to estimate the separation effect and the product composition quantitatively. These data can be obtained by vapor-liquid phase equilibrium diagram, which was put forward in 1982 [14,15]. For i-j binary alloy, ig and jg are the vapor contents, il and jl are the liquid content, respectively, then
in vapor phase:
ig+jg=1 (12)
in liquid phase:
il+jl=1 (13)
The contents of i and j in the vapor phase are presented as
 (14)
(14)
 (15)
(15)
where wi, wj, γi, γj, and are the mass fraction, activity coefficient, and saturated vapor pressure of pure matters i and j, respectively. The activity coefficients were chosen from the calculated data with MIVM mentioned above.
With the calculation of ig, we can get the vapor-liquid phase equilibrium diagram and use it to calculate separation degree of the alloy.
Figure 2 shows the calculated vapor-liquid phase equilibrium diagram of Pb-Sn alloy in 800-1300 °C. As shown in Fig. 2(a), when tin content is 0.2 in liquid alloy at 1000 °C, tin content in vapor phase is only 1.7×10⁻⁴. Tin content in the vapor has a large difference from that in liquid phase, so the alloy can be separated drastically. With the temperature and tin content increasing, tin content in the vapor increases correspondingly because vapor pressure of tin increases obviously at high temperatures and tin also starts volatilizing. The goal is to remove the lead in tin to less than 0.01%, so the theoretical feasibility must be calculated at first. Figure 2(b) presents the vapor-liquid equilibrium of the alloy with the lead content of 10-2-10-6, and the detailed values are listed in Table 5.
To remove the lead from 10-3 to 10-4 at 1200 °C in 100 kg alloy, as lead content in the alloy is only 10-4, the vapor pressure of lead at 1200 °C is
 Pa
Pa
where a is the activity; p* is the saturated vapor pressure; x is the molar concentration; γ is the activity coefficient.
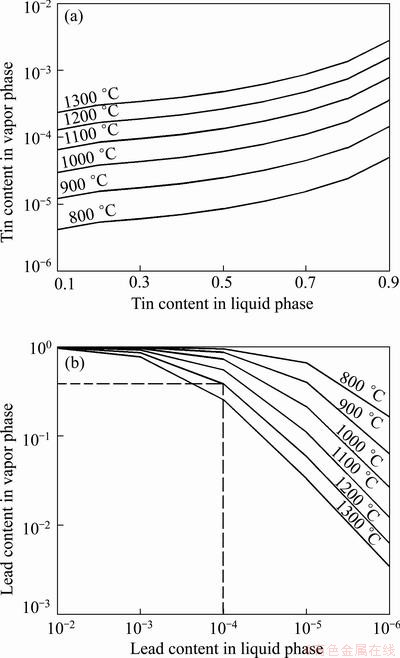
Fig. 2 Vapor-liquid equilibrium diagram of Pb-Sn alloy
To ensure the residual pressure in the furnace less than 0.43 Pa or the temperature over 1200 °C, the 10-4 lead (or even less) should be evaporated from the alloy. The evaporation of the lead is 100×(10-3-10-4)=0.09 kg.
According to Table 4, if w(Pbl)=10-4 at 1200 °C, then w(Sng)/w(Pbg)=(1-0.39)/0.39, and the evaporation of the tin is 0.09×(1-0.39)/0.39=0.14 kg.
Table 5 Fluctuation of Pb content in vapor phase with Pb content in liquid phase between 10-2 and 10-6 in alloy
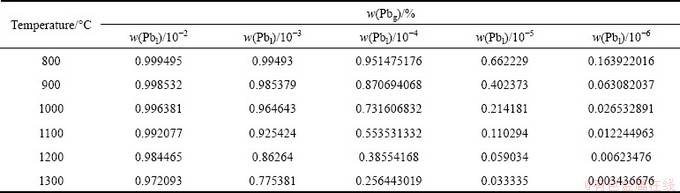
Thus, the lead content in tin can be decreased from 10-3 to 10-4 with vacuum distillation, the total alloy evaporated is 0.09+0.14=0.23 kg, and the compositions are 39.1% Pb and 60.9% Sn.
Similarly, to reduce the lead content from 10-4 to 10-5 at 1200 °C in 100 kg alloy, the evaporation of the lead is 100×(10-4-10-5)=0.009 kg.
If w(Pbl)=10-5 at 1200 °C, then w(Sng)/w(Pbg)= (1-0.06)/0.06, and the evaporation of the tin is 9×10-3× (1-0.06)/0.06=0.149 kg.
Namely, removing the lead from 10-4 to 10-5, the total alloy evaporation is 0.149 kg, and the components are 6% Pb and 94% Sn.
By the calculation above, lowering the lead content to below 10-4 is feasible, and even to 10-5 is possible. The higher the lead removing degree is, the higher the distillation temperature will be required, and the more the tin will be evaporated. The amount of the evaporated alloy is small and it can be collected and refined further.
4 Experimental
4.1 Raw materials
Two raw materials, crude lead and crude tin, were used in the experiments, whose detail compositions are listed in Table 6. Lead content in crude lead material is 77.99%, and 12.21% in crude tin. Lead contents in the two materials have a large difference. The separation law of the Pb-Sn alloy is over a large lead content ranging from 10% to 90%.
Table 6 Raw material composition
4.2 Equipments
Small-scale and industrialized equipments are both developed independently by the National Engineering Laboratory for Vacuum Metallurgy of Kunming University of Science and Technology. Figure 3 shows the internal structure schematic diagram of the vacuum furnace used in small-scale experiment. In the furnace, crude material placed in graphite crucible is heated and melted. As the temperature rises to a certain degree, the lead in liquid alloy will be evaporated from the melt and solidified rapidly on the condenser. Due to the low vapor pressure, tin remained in the crucible, thus the alloy is divided into lead and tin. Vacuum degree in the furnace keeps at 7 Pa during the experiments.
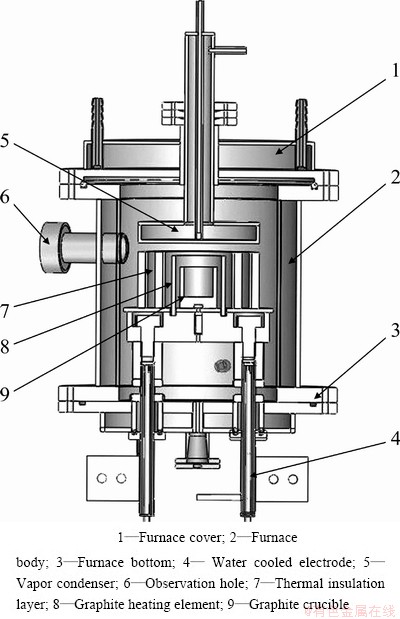
Fig. 3 Internal structure schematic diagram of vacuum furnace used in small-scale experiment
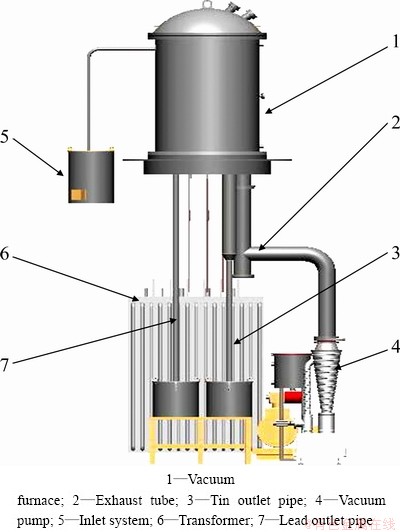
Fig. 4 Diagram of industrialized vacuum furnace
Figure 4 shows the diagram of industrialized vacuum furnace, in which the molten alloy is pressed into vacuum furnace by atmospheric pressure and is heated to a high temperature in the furnace. The lead in the alloy will be first vaporized and condensed into liquid on the condenser; the liquid lead will flow out of the furnace through outlet pipe and be collected at last. Owing to the low vapor pressure, tin keeps at liquid state and flows out of the furnace and is collected finally. Thus, the Pb-Sn alloy is separated into the lead and the tin. The equipment can continuously run over 30 d; fragile components and parts would be maintained or replaced in about 20 h. Daily treatment capacity is above 10 t and the average electricity consumption is 600 kW・h/t. Vacuum degree in the furnace keeps at about 0.5 Pa.
4.3 Conditional experiments
4.3.1 Small-scale experiments
1) Crude lead material
Figure 5 shows temperature and time dependence of the product component. From Fig. 5(a), it can be seen that, after being distilled at 900 °C, lead purity in the volatile keeps over 99%. After being distilled at 950 °C, lead purity in the volatile keeps over 98% in Fig. 5(c). Lead purity decreases with the increase of the temperature. In Fig. 5(b) and Fig. 5(d), as the distillation temperature increases and distillation time lengthens, the lead content in the residue decreases and the tin content increases. The lead content in crude tin (residue) decreases to 6.37% at 900 °C and to 1.29% at 950 °C, after being distilled for 60 min. The residue obtained here can be mixed with crude tin material and purified with another distillation.
Lead and tin contents of all experiments were analyzed by atomic absorption spectrometry, and analysis precision was limited to 0.01%. Therefore, lead content in refined tin can only guarantee to be less than 0.01%, and the value can satisfy the demand and is acceptable.
2) Crude tin material
Due to a lower lead content in crude tin material, it must be distilled at a higher temperature to guarantee the vapor pressure of the lead which is higher than the residue pressure in the furnace. Crude tin material was distilled at 1000 °C and 1100 °C, respectively. Figure 6 shows temperature and time dependence of the product component for crude tin material. As shown in Fig. 6(d), after being distilled at 1100 °C for 40 min, lead contend in tin decreased to less than 0.01%, the expected target was reached successfully. Lead purity is below 99% as a result of higher distillation temperature, as shown in Figs. 6(a) and (c).
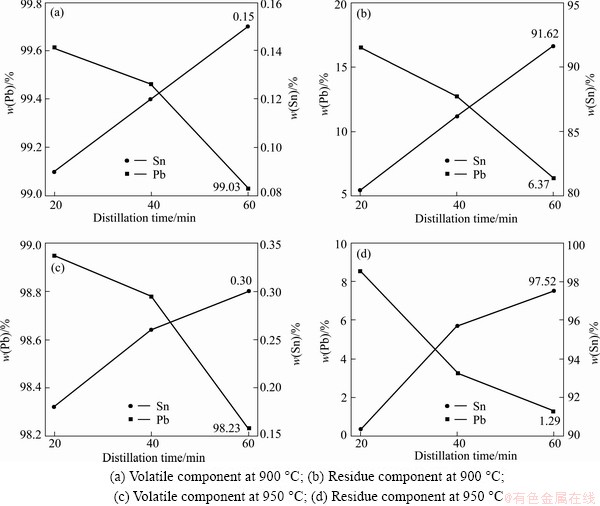
Fig. 5 Time and temperature dependence of product component
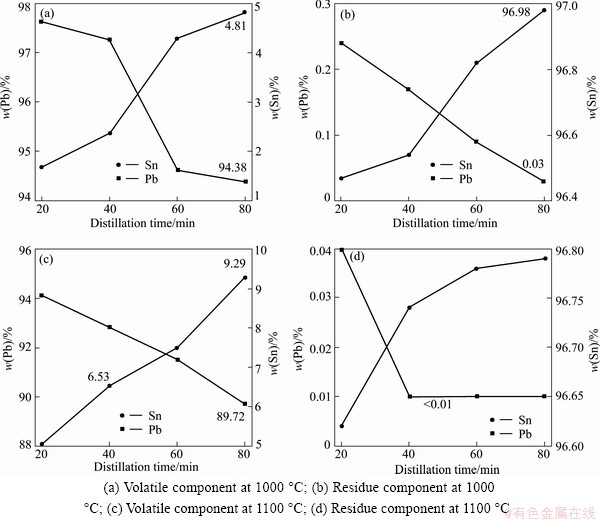
Fig. 6 Time and temperature dependence of product component
4.3.2 Industrialized experiments
1) Crude lead material
On the basis of the small-scale experiment, the continuous industrialized experiments for crude lead were chosen at 950 °C, and the feeding rate was about 410 kg/h, treatment capacity was 10 t/d. Fluctuation of product compontent in 5 randomly selected experiments is shown in Fig. 7.
Figure 7 shows the fluctuation of product compon- tent. As shown in Fig. 7(a), the lead purity in the volatile keeps over 99.5%, and tin content keeps at 0.05%. This illuminates large evaporation in the lead and almost no evaporation in tin. In Fig. 7(b), lead content in the residue decreases from 77.99% to 8%, and tin purity is around 91%. The residue obtained here can be mixed with crude tin material and purified with another distillation.
2) Crude tin material
For crude tin material, the lead cannot be removed from 12.21% to 0.01% directly by only once distillation, and it must be distilled two times.
In the first distillation, crude tin material was distilled at 1100 °C. Feeding rate was around 350 kg/h, and daily treatment capacity was 8 t. Fluctuation of product component in 5 randomly selected experiments is shown in Fig. 8.
Figure 8 shows the fluctuation of product compontent through first distillation. As shown in Fig. 8(b), the lead content in crude tin material can be reduced from 12% to 0.2%. In Fig. 8(a), because of the high distillation temperature, a certain degree of evaporation occurs on the tin, and this leads to the lead purity in the volatile decreasing to around 88%. As the distillation temperature is very high, partial tin in the alloy will evaporate and the purity of the volatile (crude lead) will decrease. But the amount of the volatile is very small, only accounts for 14% (experimental data) of the material. The volatile can be collected and mixed with crude lead material and can be refined further.
The residue (crude tin) produced from the first distillation was collected and dealt by the second distillation; the lead in the tin was removed to less than 0.01%. It was distillated at 1200 °C, feeding rate was ~350 kg/h, and daily treatment capacity was 8 t. The composition of the volatile (crude lead) is 70% Pb and 30% Sn. It can also be collected and mixed with the crude lead material and can be refined further. Fluctuation of product component in 5 randomly selected experiments is shown in Fig. 9.
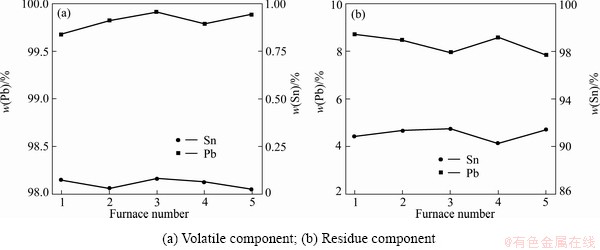
Fig. 7 Fluctuation of product component in small-scale experiment
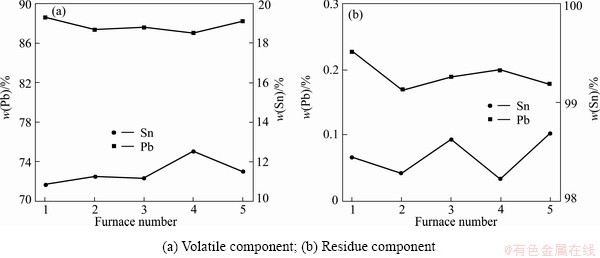
Fig. 8 Fluctuation of product component after the fist distillation
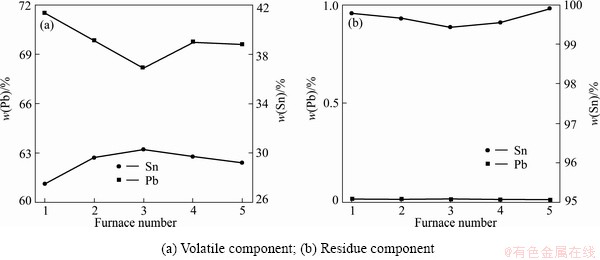
Fig. 9 Fluctuation of product component after the second distillation
5 Results and discussion
Based on the detailed small-scale and industrialized experiments above, the vacuum distillation treatment of Pb-Sn alloys over a large component range (Pb 10%-90%) was designed. As shown in Fig. 10, the crude lead material (30%-90% Pb) can be distilled at 900 °C, lead purity in the volatile keeps over 99.5%, and the residue can be mixed with crude tin material in which the lead content is 10%-30%. The lead content in the residue or crude tin (10%-30% Pb) can be finally reduced to less than 0.01% after two times of distillation, at 1050 °C and 1150 °C, respectively. The volatiles after two times of distillation both can be mixed with crude lead (30%-90% Pb) and be purified repeatedly. Thus, the Pb-Sn alloy with lead content of 10%-90% can be treated by only vacuum distillation. Lead and tin will both be recovered, and the final product is above 99.5% crude lead and refined tin with lead content less than 0.01%. This treatment progress can replace the old crystallizer refining progress. Refining progress of Pb-Sn alloy has been simplified. This progress has been popularized and applied in some large or middle enterprises home and abroad, and certain economic benefit has been achieved.
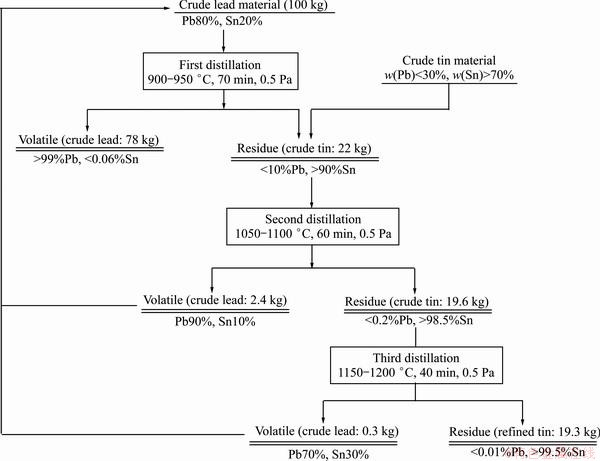
Fig. 10 Flow chart of distilling Pb-Sn alloy
6 Conclusions
1) Activity coefficients of Pb-Sn alloy were predicted with MIVM, and the agreement with the available experimental value was acceptable. The key parameters were provided to thermodynamic calculation.
2) Small scale and industrialized experiments were done with crude lead and crude tin materials, respectively. Lead content in refined tin was successfully reduced to less than 0.01% and separation raw of total component Pb-Sn alloy with vacuum distillation was summarized.
3) Vacuum distillation treatment progress of total component Pb-Sn alloy was put forward and the final product was above 99.5% crude lead and refined tin with lead content less than 0.01%. The feasibility and economic benefit of this progress were tested in practice.
References
[1] PENG Rong-qiu. Tin metallurgy [M]. Changsha: Central South University Press, 2005: 128-135. (in Chinese)
[2] PRAUSNITZ J M, LICHTENTHALER R N, AZEVEDO E G D. Molecular thermodynamics of fluid-phase equilibria [M]. 2nd ed. NJ: Prentice-Hall, Englewood Cliffs, 1986: 117-123.
[3] HOWELL W J, LIRA C T, ECKERT C A. A linear chemical-physical theory model for liquid metal solution thermodynamics [J]. AIChE Journal, 1988, 34: 1477-1485.
[4] FAN Peng, ZHOU Guo-zhi. A model for predicting thermodynamic properties of metallic solutions from fundmental physical quantities of constituent elements [J]. Acta Metallurgica Sinica, 1999, 35: 421-433. (in Chinese)
[5] WILSON G M. Vapor-liquid equilibrium XI. A new expression for the excess free energy of mixing [J]. Journal of the American Chemical Society, 1964, 86: 127-134.
[6] TAO D P, CHEN Z, LI D F. Comparison of the molecular interaction volume model with Wagner formulae in the Zn-Sn-Cd-Pb dilute solutions [J]. Journal of Materials Science and Technology, 2004, 20(3): 279-284.
[7] TAO D P. A new model of thermodynamics of liquid mixtures and its application to liquid alloys [J]. Thermochimica Acta, 2000, 363: 105-113.
[8] TAO D P. Prediction of thermodynamic properties of the C-Fe-Co-Ni solid solutions by binary infinite dilute activity coefficients [J]. Materials Science and Engineering A, 2005, 390: 70-75.
[9] TAO D P, LI D F, YANG B. Prediction of thermodynamic properties of quaternary liquid alloys by modified coordination equation [J]. Thermochimica Acta, 2002, 383: 45-51.
[10] HULTGREN R, DESSAI P D, HAWKINS D T, GLEISER M, KELLEY K K. Selected of the thermodynamic properties of binary alloy [M]. Ohio: Metal Park, ASM, 1973: 425-430.
[11] KUBASCHEWSKI O, ALCOCK C B. Metallurgical thermochemistry [M]. Beijing: Metallurgical Industry Press, 1985: 486-513. (in Chinese)
[12] DAI Yong-nian, ZHAO Zhong. Vacuum metallurgy [M]. Beijing: Metallurgical Industry Press, 1988: 114-115. (in Chinese)
[13] WEI K X, MA W H, DAI Y N, YANG B, LIU D C, WANG J F. Vacuum distillation refining of metallurgical grade silicon (I)―Thermodynamics on removal of phosphorus from metallurgical grade silicon [J]. Transactions of Nonferrous Metals Society of China, 2007, 17(10): 1022-1025.
[14] DAI Yong-nian, YANG Bin. Vacuum metallurgy of non-ferrous metals [M]. Beijing: Metallurgical Industry Press, 2000: 55-57. (in Chinese)
[15] MA W H, WEI K X, YANG B, LIU D C, DAI Y N. Vacuum distillation refining of metallurgical grade silicon (II)―Kinetics on removal of phosphorus from metallurgical grade silicon [J]. Transactions of Nonferrous Metals Society of China, 2007, 17: 1026-1029.
贾国斌1,2,杨 斌2,刘大春2
1. 北京有色金属研究总院,北京 100088;
2. 昆明理工大学 真空冶金国家工程实验室,昆明 650093
摘 要:采用分子相互作用体积模型计算在777 °C时不同Pb含量铅锡合金的活度系数,结果与实验值符合较好。对800~1300 °C全成分范围内铅锡合金的活度系数进行预测,为铅锡金真空蒸馏分离提供必要的热力学参数。对两种不同铅含量的铅锡合金进行小型和工业实验,将锡中的铅含量降至0.01%以下。设计全成分范围的铅锡合金真空蒸馏处理流程,对铅含量10%~90%的铅锡合金经真空蒸馏处理后可得到纯度为99.5%的粗铅和铅含量在0.01%以下的精锡。
关键词:铅锡合金;分子相互作用体积模型;真空蒸馏;活度系数
(Edited by Xiang-qun LI)
Corresponding author: Bin YANG; Tel: +86-871-5114017; E-mail: kgyb2005@126.com
DOI: 10.1016/S1003-6326(13)62666-7

