Multi-objective planning model for simultaneous reconfiguration of power distribution network and allocation of renewable energy resources and capacitors with considering uncertainties
��Դ�ڿ������ϴ�ѧѧ��(Ӣ�İ�)2017���8��
�������ߣ�Sajad Najafi Ravadanegh Mohammad Reza Jannati Oskuee Masoumeh Karimi
����ҳ�룺1837 - 1849
Key words��optimal reconfiguration; renewable energy resources sitting and sizing; capacitor allocation; electric distribution system; uncertainty modeling; scenario based-stochastic programming; multi-objective; genetic algorithm
Abstract: This research develops a comprehensive method to solve a combinatorial problem consisting of distribution system reconfiguration, capacitor allocation, and renewable energy resources sizing and siting simultaneously and to improve power system��s accountability and system performance parameters. Due to finding solution which is closer to realistic characteristics, load forecasting, market price errors and the uncertainties related to the variable output power of wind based DG units are put in consideration. This work employs NSGA-II accompanied by the fuzzy set theory to solve the aforementioned multi-objective problem. The proposed scheme finally leads to a solution with a minimum voltage deviation, a maximum voltage stability, lower amount of pollutant and lower cost. The cost includes the installation costs of new equipment, reconfiguration costs, power loss cost, reliability cost, cost of energy purchased from power market, upgrade costs of lines and operation and maintenance costs of DGs. Therefore, the proposed methodology improves power quality, reliability and security in lower costs besides its preserve, with the operational indices of power distribution networks in acceptable level. To validate the proposed methodology��s usefulness, it was applied on the IEEE 33-bus distribution system then the outcomes were compared with initial configuration.
Cite this article as: Sajad Najafi Ravadanegh, Mohammad Reza Jannati Oskuee, Masoumeh Karimi. Multi-objective planning model for simultaneous reconfiguration of power distribution network and allocation of renewable energy resources and capacitors with considering uncertainties [J]. Journal of Central South University, 2017, 24(8): 1837-1849. DOI: https://doi.org/10.1007/s11771-017-3592-8.
J. Cent. South Univ. (2017) 24: 1837-1849
DOI: https://doi.org/10.1007/s11771-017-3592-8

Sajad Najafi Ravadanegh, Mohammad Reza Jannati Oskuee, Masoumeh Karimi
Smart Distribution Grid Research Lab., Electrical Engineering Department,
Azarbaijan Shahid Madani University, Tabriz 5375171379, Iran
 Central South University Press and Springer-Verlag GmbH Germany 2017
Abstract: This research develops a comprehensive method to solve a combinatorial problem consisting of distribution system reconfiguration, capacitor allocation, and renewable energy resources sizing and siting simultaneously and to improve power system��s accountability and system performance parameters. Due to finding solution which is closer to realistic characteristics, load forecasting, market price errors and the uncertainties related to the variable output power of wind based DG units are put in consideration. This work employs NSGA-II accompanied by the fuzzy set theory to solve the aforementioned multi-objective problem. The proposed scheme finally leads to a solution with a minimum voltage deviation, a maximum voltage stability, lower amount of pollutant and lower cost. The cost includes the installation costs of new equipment, reconfiguration costs, power loss cost, reliability cost, cost of energy purchased from power market, upgrade costs of lines and operation and maintenance costs of DGs. Therefore, the proposed methodology improves power quality, reliability and security in lower costs besides its preserve, with the operational indices of power distribution networks in acceptable level. To validate the proposed methodology��s usefulness, it was applied on the IEEE 33-bus distribution system then the outcomes were compared with initial configuration.
Key words: optimal reconfiguration; renewable energy resources sitting and sizing; capacitor allocation; electric distribution system; uncertainty modeling; scenario based-stochastic programming; multi-objective; genetic algorithm
1 Introduction
Lately, distribution automation (DA) has attracted attention which is widely used in smart grids environment. So it has been widely grown as an important issue [1]. One of the most important DA functions, is the distribution system reconfiguration (DSR) process. Distribution feeders include sectionalizing switches and the tie switches. Main goal of DSR is to find the best and optimal configuration of the distribution network and modify its topological structure with varying the status of sectionalizing and tie switches in order to achieve; several goals. These goals are: 1) obtaining the minimum active power losses, 2) meeting the energy demand, 3) solving overload's problems (load balancing), 4) volt/Var support (maximizing load-ability), 5) system restoration and 6) maintaining system reliability [2]. Significant amount of the energy that is generated in power plants is wasted in generation, transmission and distribution levels where distribution networks play more important role regards causing power losses about 5%�C13% of the total power generated [3]. In this regard, effective methods to reduce power losses in the distribution network have been studied in Refs. [4, 5]. The DSR is a multi-objective problem that it is non-linear, combinatorial optimization problem with numerous constraints, including topology constraints, electrical and operating constraints as well. There are several publications solving this problem via different techniques. DSR was firstly proposed by MERLIN and BACK [6] as an efficient method for reducing power losses. As well as, many publications have presented application of optimization algorithms to solve DSR problem [7-15] which were focused on the optimization algorithms�� efficiency that were selected as an optimization tool to find the best switching combination in the network leads loss minimization. According to review of research works, it is obvious that the existence of RESs and/or capacitors plays an important role in distribution network and is really beneficial for distribution network. Their benefits are: economics, environmental and technical. The economic benefits include reduction of transmission and distribution costs, electricity price and saving of fuel. The environmental benefits are reducing sound pollution and emission of greenhouse gases; and the technical viewpoints are reducing line loss, peak shaving, improving voltage profile of system and load factors and increasing power quality [16-19]. In other words, optimization problem of DSR with considering different kinds of DG��s and/or capacitors placement improves integrity, reliability and efficiency of the system. There are papers which consider DG or/and capacitor placemen besides DSR problem. A technique presented in Ref. [20], to solve both DSR and DG placement problems, simultaneously, studies critical system condition in distribution systems as well. FAZEL and HOSSEINI [21] show that the influence of network configuration and location plus size of DG should be taken into account in the planning process at the same time. In this work, DSR problem, for taking network configuration effect into account that runs in offline mode with constant loads, and optimal DG allocation and sizing problems are studied at the same time. In order to realize power loss minimization an optimum switching operation plan for DSR and DG size at the same time was presented in Ref. [22]. The DSR problem is solved considering various optimum switching operation plan for DSR and DG size simultaneously [23]. A multi-objective function considering mixture of power loss saving, voltage profile, voltage unbalance and current unbalance of the system has been proposed in Ref. [24] to figure out an optimal solution for DSR and DG allocation in both balanced and unbalanced networks. A novel method had been proposed in Ref. [25] in order to find an optimum DSR and DG placement in distribution system for obtaining power loss minimization and voltage stability improvement. Both the DSR and capacitor placements are considered at the same time to reduce power loss in Refs. [26, 27]. A literature review pointed out some study efforts to solving DSR problem, and somewhat, simultaneous DSR with allocation of DG units and capacitor siting and sizing; however, most of the work presented, has focused on loss minimization and there is no paper covering all aspects of power distribution network, and also almost all the papers assume that the load demand and/or market price is constant in time horizon in planning period with no associated uncertainties. Therefore, it seems that the planning of power system by considering uncertainties is the most important challenge for the decision makers. Generation and consumption balance must maintain in real time and the power grid must be capable of transferring the required energy of consumers to them. Due to several factors, e.g. economical, geographical, climate change and stuff, it is not able to provide a high accurate load forecasting for future load demand. Next, the electric system is highly capital intensive, and the investments have long lead times and multi-decade economic lifetimes. Thus, power grids planning and managements are higher valuable, which leads to high power quality at relatively low costs. It gives the impression, existence of a methodology to solve the optimal DSR and sitting and sizing of renewable energy resources (RESs) with constant and variable output power besides capacitor placement at the same time in an uncertain environment that considering the DisCo��s perspective is necessary. This research work offers a novel approach from the DisCo��s perspectives to solve the multi-objective problem which consists of DSR problem and allocation RESs that have constant and variable output power respectively beside capacitor placement, all at the same time. Note that all the uncertainties in future load demand and market price and the output power of wind-based DGs which are not constant are considered to solve the mentioned multi-objective problem. In this research work, problem formulation with various uncertainties, such as wind power generation, load demand and market price is introduced into a novel model for tree and objective function and its constraints present in section 2.
2 Problem formulation
The objective of applying optimal DSR and allocation of RERs and capacitor placement all at the same time is maximizing/minimizing defined objective functions subjected to the operating constraints via detecting the optimal radial configuration of distribution network and optimal allocation of RERs and capacitor at the same time. For this propose, implementing a multi-objective optimization framework is capable to offer flexible implement for who are the decision makers. In order to solve multi-objective problem, several traditional methods scalarize the objective vector into a single objective but, the solution which is funded extremely depends on the weight vectors which were used in the scalarization process and users should have knowledge about the underlying problem and set these weights correctly. Also, solving these kinds of problems whose objective function is made up of several terms via weighted approach is not able to guarantee finding the best and optimal value for all terms and it may be with improving one term, the others get worse. What is more is that designers may be interested in a set of Pareto-optimal points, instead of a single solution. Since genetic algorithm uses a population of points, hence they may be able to discover multiple Pareto-optimal solutions at the same time. In Fact, if all of objective functions need to be minimized, a feasible solution x is supposed to overcome an additional feasible solution y (x>y); if and only if, zi(x)��zi(y) for i=1, ��, k and zj(x)
2.1 Uncertainty modeling of wind power generation, load demand and market price
2.1.1 Modeling of wind power generation��s uncertainty
As known, wind has an intermittent nature and its speed is not constant. In other words, the output power of wind turbines depends on the wind speed at the site besides the parameters of the power performance curve. The wind turbine power generation��s uncertainty is able to be modeled probabilistically applying recorded historical data of wind speed [29]. A remarkable expression that was suggested for modeling the wind speed��s behavior is Rayleigh probability distribution function (PDF) that is expressed as Eq. (1). Weibull PDF with the shape index equal to 2 is a Rayleigh PDF.
 (1)
(1)
With the purpose of incorporating the wind turbines output power as a multi-state variable in the planning formulation, the continuous PDF is divided into some states in which every has its own limits. Probability of each state is:
 (2)
(2)
The Rayleigh PDF is generated heading for a specific time segment and then by using Eq. (3), the output power during the different states is determined for this segment.
 (3)
(3)
Figure 1 illustrates probabilities of wind power.
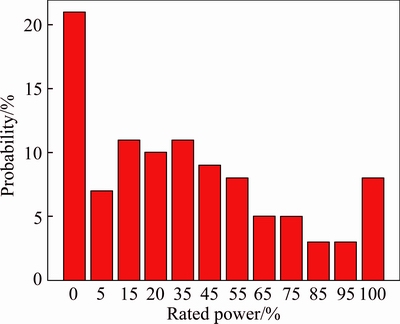
Fig. 1 Wind power probabilities in different states
2.1.2 Uncertainty modeling of electricity prices and load demands
The probable factors which are modeled in deregulated environment are electricity prices and load. Note that they have direct relation to each other, strongly, in this way that increase/decrease of each one leads to the increase/decrease of the other one. In order to model the uncertainty of the load and price parameters, the waveforms of these parameters are divided into Ndl stages in every year shown in Fig. 2. The vertical axis in Fig. 2 demonstrates the demand/price level factors. Note that as clearly seen from Fig. 2 the load and price level factors are supposed to be normally distributed close to their chosen expected values and each normal distribution is separated into 5 areas in which every area��s probability is determined. Although, the expected price and demand values are dependent in each demand level, the variations of these two parameter around their expected values can be assumed independently.
It is supposed that the amount of �� in each demand is 1% of estimated amount of it. By means of the performance of the electricity market members, the cost of electricity is determined.
Equation (4) determines the electricity cost in state S and demand level dl.
 (4)
(4)
Equation (5) shows the load demand in bus i, in year y, demand level dl and state s:
 (5)
(5)
The aforementioned modeling of the output power of wind turbines, the load and the market price is utilized to generate the combined wind, load and price model. In this work, the wind speed and load-price pattern are supposed to be independent. The states of each demand level are independent (the correlation between load and price is already considered in their mean value of Ddl and ��dl). Based on this statement, the probability of any combination of load, price and wind turbines output  can be achieved by convolving these probabilities as given in the following equation:
 (6)
(6)
 (7)
(7)
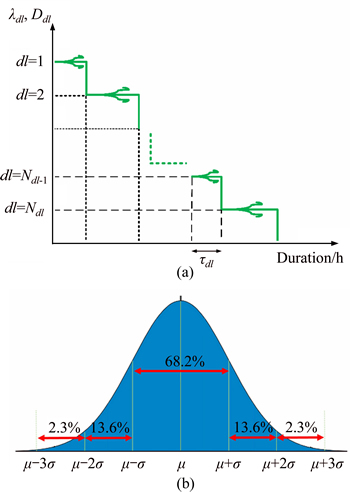
Fig. 2 Demand and price level factor uncertainty modeling
2.2 Novel technique for tree
In order to find a best radial topology of distribution network this research work, a novel algorithm is used to solve the spanning tree problem which check radial structure of the distribution network over simulation [30, 31]. Actually, it checks two structures of a graph to find out the graph is tree or not. These features of tree with n vertices are: The number of edges in the tree is n-1. The tree is a connected graph.
This method is used to find out the connectivity or dis-connectivity of the graph. Now suppose that Laplacian matrix and incidence matrix are defined as L and E respectively, therefore:
 (8)
(8)
It can be seen that:
 (9)
(9)
If the graph is connected, then:
 (10)
(10)
 (11)
(11)
Otherwise, it is disconnected.
Though, matrix L is able to obtain over this method: Let G be a graph with n vertices and its Laplacian matrix L is defined as the difference of the graph��s degree matrix D (a diagonal matrix with vertex degrees on the diagonals) and its adjacency matrix A (a (0,1)-matrix with 1��s at places corresponding to entries where the vertices are adjacent and 0��s otherwise) :
 (12)
(12)
where elements of L are:
 (13)
(13)
where deg(vi) is the degree of the vertex i.
2.3 Objective functions
This research proposes a multi-objective function to optimize by means of NSGA II. It considers DisCo��s economical, technical and environmental viewpoints. The extraction multi-objective function by taking mentioned viewpoints into account is used to minimize the DisCo��s cost and improve system performance parameters, simultaneously and dependently. Proposed multi-objective function and its terms are described in detail in the following and meanwhile, the uncertainties in future load demand, market price and wind power generation are incorporated into the mathematical formulations.
2.3.1 Cost minimization of DisCo
Offering the cost effective service to consumers within standard ranges is the main goal of distribution system company. Therefore, the proposed cost function is incorporated by means of some criteria: Installation of wind-based DG units and distpachable DG units, operation and maintenance costs, capacitor installation cost, cost of network reconfiguration, cost of power loss, cost of purchased active power from power market, cost of upgraded lines and reliability cost. The proposed cost function is expressed in Eq. (14) and its details are described by


 (14)
(14)
This cost function requires to be minimized by considering DisCo��s economic viewpoints.
1) RERs installation, operation and maintenance costs
It is assumed that the cost of RERs includes the installation, operation and maintenance costs.
The cost functions of RERs are well-defined as follows:
 (15)
(15)

 (16)
(16)
where


 (17)
(17)
 (18)
(18)
2) Capacitor installation costs
The capacitors which are commercially available are discrete. Choosing integer capacitor sizes, rounding the continuous optimal values, may not guarantee a best or an optimal solution. Thus, it is probably best to look on optimal capacitor placement as an integer programming problem. Consequently, this research work considers discrete capacitors. In practical capacitors, there are a specified number of standard sizes and are integer multiples of the size  The maximum fixed capacitor size is:
 (19)
(19)
where  is 150 kVar.
The total cost of capacitor placement is expressed as
 (20)
(20)
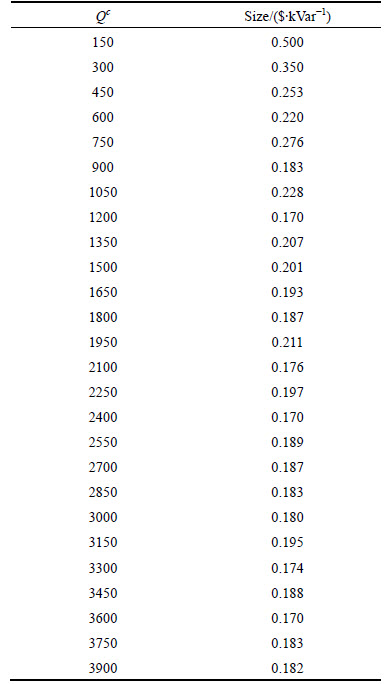
Table 1 shows some commercially available capacitor sizes with $/kVar which are used in the analysis. Note that just fixed capacitors are used and the marginal cost of capacitors  are used to calculate the total yearly cost which are given in Table 1. The fixed cost of the capacitor, Kcf, is selected as $1000 (the maintenance and running costs are neglected) [32].
Table 1 Possible sizes of capacitors and sizes
3) Cost of reconfiguration
In DSR problem with maintaining the radial structure of the network, the network topology ischanged to improve the system performance parameters. Principles need to be considered in the reconfiguration of network are: First, the radial structure of the network must be held; Second, maintain the constraints of distribution network, e.g. bus voltages and thermal limits of feeders
Here, the DSR cost is supposed as
 (21)
(21)
4) Line upgrades cost
For load growth and voltage security the overloaded lines must be upgraded:
 (22)
(22)
 (23)
(23)
 (24)
(24)
5) Power loss cost
Distribution systems are well known for a higher R/X ratio compared to transmission systems and significant voltage drops can result in substantial power and energy losses along distribution feeders. As a result, loss reduction in distribution systems is one of the greatest challenges to many utilities around the world. So, minimizing power losses of system is a good objective and is commonly aimed in literatures. The total electricity cost will decreased when major amount of losses in all levels of the power system is reduced, thus accelerate the economic growth of utilities by reducing the total cost of producing electricity. Also, in the electricity market viewpoint, less power losses leads improving the efficiency and flexibility of distribution companies. Following equation is used to compute the cost of losses:
 (25)
(25)

 (26)
(26)
6) Cost of purchased active power from power market by DisCo
The ending process in transfer of the electricity from generation towards consumers is the Electricity purchasing from power market via transmission lines by DisCo.
Portion of this power demand is for distribution system customers and the rest is spent in line and equipment as power losses. This purchased power demand is evaluated by:

 (27)
(27)
Equation (28) indicates the cost of exchanging active power among each distribution network and power market over upstream network.
 (28)
(28)
7) Reliability cost
Distribution networks are the main prominent infrastructure in directly or indirectly integrated to power demand. In power grids, failures due to human or natural factors and outage occurrences are common. Distribution companies have a responsibility to satisfy their consumptions even in such cases. Estimating the energy not being supplied(ENS) due to interruptions is a momentous topic to be calculated for all consumers. The CENS can be defined by considering the failure rate in each branch and the amount of the interrupted loads in failure happenings. In case of failures, the lower quantity of this index that is indicated as below, guarantees stable operation of electrical grids.
 (29)
(29)
2.3.2 Minimizing voltage deviation
The voltage deviation from the desired values is an important parameter in security and power quality indices of the system. The objective function for minimization of voltage deviation is proposed as
 (30)
(30)
2.3.3 Maximizing voltage stability
Voltage stability is defined as the ability of a system to keep voltage in satisfactory level where the system can control both power and voltage when the load increases [33]. Equation (31) is used to formulate voltage stability factor. In Fig. 3, supposing two-bus section of distribution system, voltage stability factor for any bus ��m+1�� is accessibility as follows:
 (31)
(31)
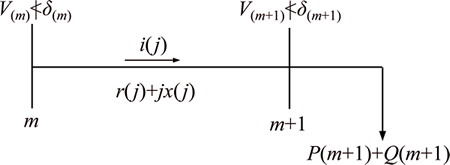
Fig. 3 Two-bus section of radial distribution system
Distribution system voltage stability situation can be justified aggregating the values of VSFm+1 for all the buses.
 (32)
(32)
The higher value of VSFtotal indicates more voltage stable operation.
 (33)
(33)
where fVSI is the objective function related to voltage stability factor of power system and it must be maximized to develop the voltage stability.
2.3.4 Environmental impacts
Current global trends in energy supply are patently unsustainable-environmentally, economically, socially. Without crucial operation to system, increased fossil fuel energy consumption and energy related emissions of carbon dioxide will be more than double by 2050. So, the current path must be changed, but this will take an energy revolution and low carbon energy technologies will have a crucial role to play. Hence, in planning and operation contexts, minimization of the emission amount is treated as a significant purpose. If the fuel consumption rate is decreased, the amount of producing carbon dioxide and other air pollutant emissions will be reduced and then environmental conservation progress is achieved. The formula for calculating an emission from network is as follows:
 (34)
(34)
 (35)
(35)
A carbon footprints in a system and the emission can be calculated respectively, as follows:
 (36)
(36)
2.4 Constraints
In this research work, finding the optimal plane of distribution network is set as an optimization manner formulated as hard-limit constrained:
Mentioned constraint needs to be stratified in the all states and all demand levels as well.
1) Power flow equation:
 (37)
(37)
 (38)
(38)
where i is the Bus number.
2) Slack bus voltage and angle (Substation Bus):
 (39)
(39)
��1=0 (40)
3) Voltage limits at other buses:
 (41)
(41)
 (42)
(42)
4) Line thermal limits:
 (43)
(43)
5) Maximum penetration of DGs units in the system:
 (44)
(44)
3 Simulation and result
This section is devoted to present result and outcomes of proposed robust multi-objective approach solved from the DisCo��s techno-economic and environmental perspectives with consideration of all uncertainties. All this actions have done by means of MATLAB software. Note that the proposed method has been applied on a 33-bus radial distribution system. Its scheme is illustrated in Fig. 4.
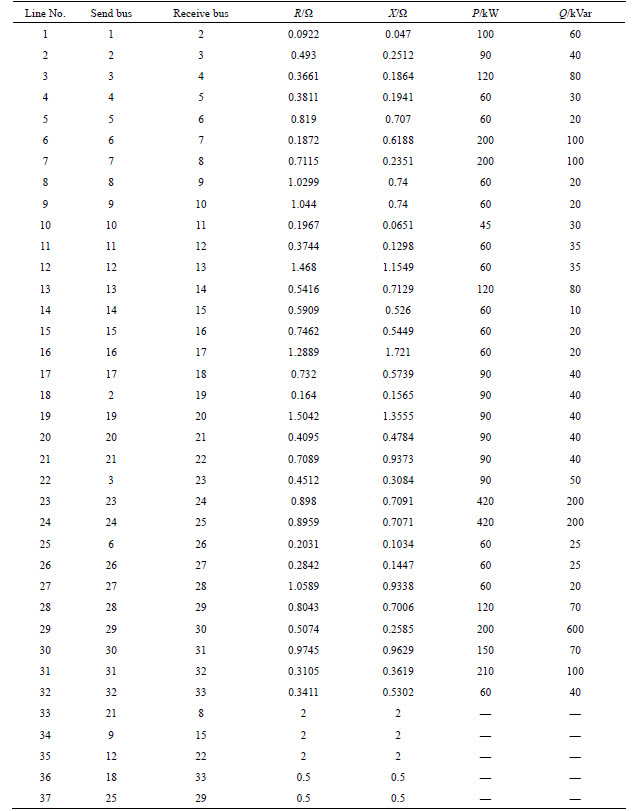
The network information containing branches�� resistance and reactance as well as the amounts of the real and reactive load demand are stated in Table 2.
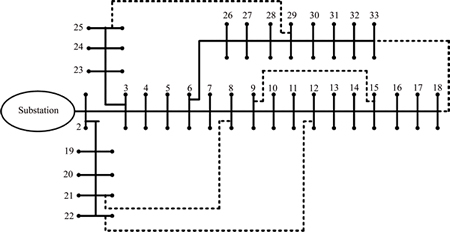
Fig. 4 33-bus radial distribution network
Table 2 33-bus radial distribution network
Solving considered multi-objective function by means of NSGA II results in several non-dominated solutions which all these obtained Pareto fronts satisfy all networks�� constraints. Every single of these solutions is capable to select for setting as the final strategy. Because of various switching combination and size and site of RERs and capacitors in Pareto fronts the objective functions�� amounts are different. The probability of selection for each feeder consideration all non-dominated solutions is presented in Fig. 5.
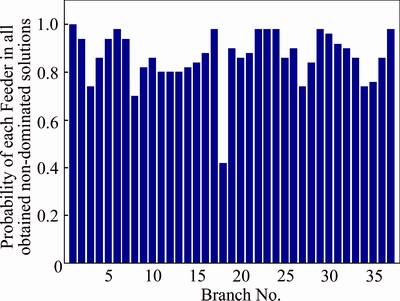
Fig. 5 Probability for every feeder of optimal networks
Likewise, the probability distribution functions for each of the objective functions are gained to show the variation of these parameters and they are shown in Fig. 6.
To study on the efficiency of the obtained optimal solutions with consideration of uncertainties related to load demand, market price and wind turbines output power, a statistical investigate on the non-dominatedsolutions has been accomplished. It is obvious that, DisCo benefits from optimal DSR and simultaneously the existence of RERs and capacitors in distribution system. As a result, voltage stability is improved and both the voltage deviation and Emission are reduced.
4 Best compromise solution
A designer or decision maker must select best solution from Pareto optimal sets which have gotten, in a reasonable way. The probably best manner is using fuzzy set theory that has capability to specify the best compromised solution [34]. Fuzzy membership function is capable to describe the corresponding satisfaction degree of every single objective function of each Pareto optimal, as well. It should be note that; all objective functions in following formulation is for a case that all of them should be minimized. Consequently, considering this formulation needs several modification where both cost function and fitness function are in mind.
 (45)
(45)
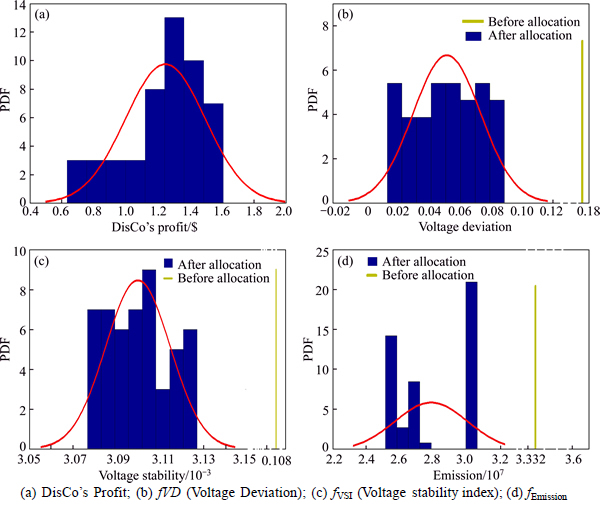
Fig. 6 Probability density function for non-dominated solutions:
 (46)
(46)
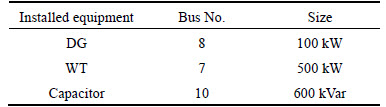
hi is able to be either 0 or 1 , that 0 shows full dissatisfaction and 1 satisfaction to the i-th value of objective function. To obtain each solution's standard satisfaction degree Eq. (46) is used, and with comparison, the Pareto that has a maximum amount of h is identified as the best compromise solution. Applying fuzzy set theory to non-dominated solutions obtained from NSGA II in order to find the best compromise solution leads to the following result. The optimal solution containing the distribution network structure, site and size of RERs and capacitors are indicated in Fig. 6 and Table 3.
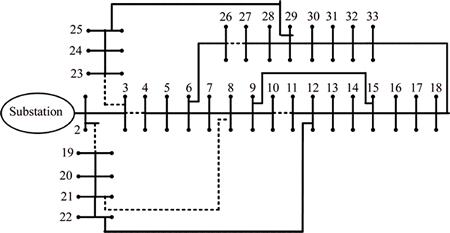
Fig. 7 Optimal 33-bus radial distribution network
Table 3 Optimum site and size of DGs and capacitors
Voltage amplitude is capable to be assumed as a main index that has an effect on power flow, power losses, power quality, voltage stability and etc. Hence, it has taken into account as a hard limit constraints which all solutions have had to keep the voltage of buses in a standard range.
Figure 8 shows the buses voltage after optimum DSR and installation of new equipment. It shows that voltage amplitude has been well-kept in suitable range.
In order to have a comprehensive looking into power system parameters such as voltage deviation, voltage stability index, power losses and energy not supplied, by taking all the states in the planning period into account the probability distribution functions are provided. The probability density functions for operational indices are shown in Fig. 9. As it is clear, the voltage deviation, power losses and energy not supplied are decreased and the voltage stability index is maximized.
Improvements in the operational features of the power system with considerable reduction in the cost ofDisCo are the results of robust approach that has proposed and implemented in this paper. The NSGA II and fuzzy set theory together, have made a strategy of which detail has been given before. The results validate the effectiveness of the proposed approach in solving the simultaneous distribution network reconfiguration and siting and sizing of renewable energy resources and capacitors. It is clearly seen that this approach has improved the operational features of power system and has guaranteed that the Disco benefits from DSR and adding new generation capacities and capacitors in the distribution network.
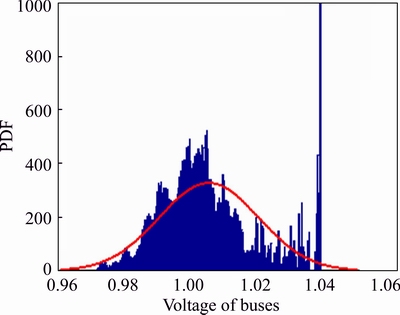
Fig. 8 Buses�� voltage after allocation
5 Conclusions
This research work has offered an approach to figure out the optimum switching combination of power distribution network, optimum sites and sizes of renewable energy resource and capacitors simultaneously with consideration the uncertainties of load, price and output power of wind turbines. The NSGA II and fuzzy set theory have used in turn to solve proposed multi-objective functions. The NSGA II has provided non-dominated solutions allowing the DisCo��s to exercise his/her personal preferences in choosing each of those solutions based on the operating conditions of the system and the costs, and the fuzzy set theory has been used to find the optimum compromise solution among non-dominated solutions. The proposed scheme is solved from the DisCo��s point of view. As a result of the proposed multi objective approach, DisCo benefits from cost minimization and the operational aspects of distribution network are improved. It should be noted that, the distribution system��s operational features have been taken into account as hard limit constraint. Finally, the provided results have validated the effectiveness of the proposed methodology.
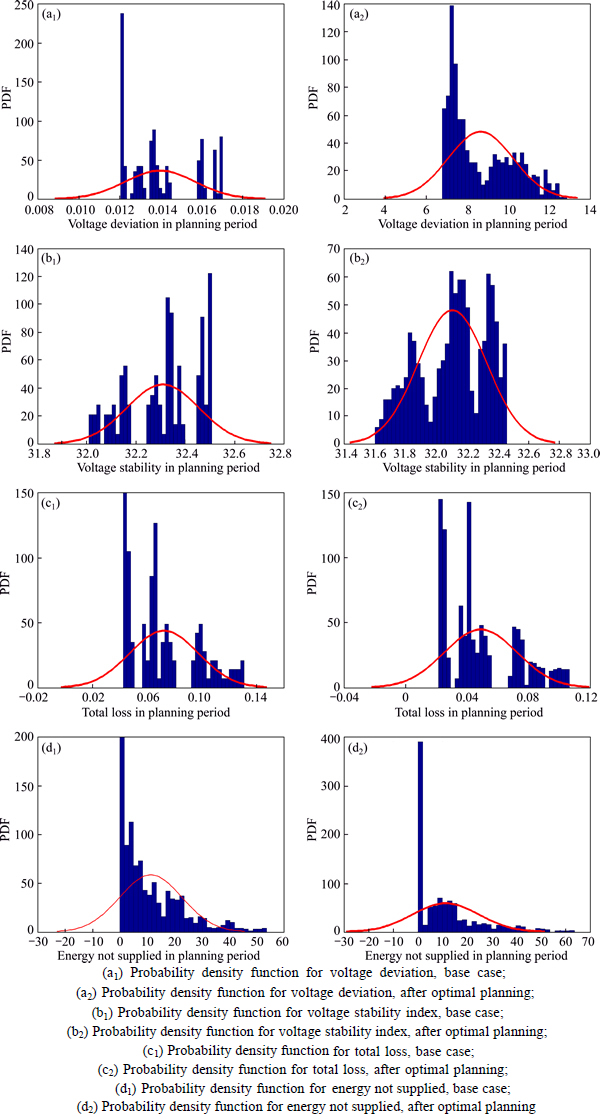
Fig. 9 Probability density function for operational indices:
Nomenclature
n
Bus number
v
Wind speed
Pvw
Output power of wind turbine during state w
vci
Cut-in speed of wind turbine
vr
Rated speed of wind turbine
vco
Cut-off speed of wind turbine
vaw
Average wind speed in state w
��dl
Time interval of each demand/price level
Ddl
Load level factor
��dl
Price level factor
��
Peak electricity price

Peak load of bus i in base year
��
Load growth rate

Load demand of bus i, in year y, demand level dl and state s

Probability of each combined state

Probability of load in each state

Probability of price in each state

Probability of wind speed in each state
RIR
Real interest rate
WTCap
Capital costs of wind turbine
PWT(n)
Capacity of the connected wind turbine unit on bus n
DGcap
Capital costs of dispatchable DG units
PDG(n)
Capacity of connected dispatchable DG unit on bus n
CSW
Cost of switching
Kcf
Feed cost for capacitor placement

Annual capacitor installation cost for each compensated bus
|I(k, s, y)|
Magnitude of current for state s and year y flowing in line k
KGrid
Carbon footprint for energy purchased from grid, in equivalent kg/(kW��h)
KDT
Carbon footprint for energy purchased from DG��s, in equivalent kg/(kW��h)
KCO2-GRID
CO2 emissions from the grid, in kg/(kW��h)
k
Line number
Imax(k,y)
Maximum allowed current to flow in line k in year y
Mk
Factor by which the line can be upgraded
ICAP(k)
Current capacity of line k in the base year
YUP(k)
Year when upgrade of line k is essential
KM(k)
Length of line k in km
Ploss(dl,s)
Active power loss corresponding to state s and load level dl
Qloss(dl,s)
Reactive power loss corresponding to state s and load level dl
R(k)+jX(k)
Impedance of line k
CP-loss
Cost of active loses
CQ-loss
Cost of reactive losses
PM(dl,s)
Purchased active power from power market through transmission line in state s and load level
PD(dl,s)
Load demand in state s and load level dl
��k
Failure rate of feeder k (fail/km/year)
rk
Repair time of feeder k (h)
fVD
Voltage deviation
Vn
Real voltage of the n-th bus
Vrated
Nominal voltage (1 per unit)
WTOM
Operation and maintenance costs of wind turbine
CFWT
Capacity factor of wind turbine unit

Maximum apparent power flow established in line that connected bus i and bus j
yij
Admittance of line that connected bus i and bus j
MPL
Maximum penetration limit as a percentage of the peak load
obj
Objective function
Nobj
Number of objective function
fVSI
Voltage stability factor of power system
KCO2-DT
CO2 emissions from the distpachable DG��s in kg/(kW��h)
MCO2/NO2
Carbon dioxide equivalency factor
KNO2-DT
NO2 emissions from the distpachable DG��s in kg/(kW��h)
KNO2-GRID
NO2 emissions from the grid in kg/(kW��h)
References
[1] KAZEMI S, FOTUHI-FIRUZABAD M, BILLINTON R. Reliability assessment of an automated distribution system [J].IET Generation, Transmission & Distribution, 2007, 1(2): 223-233.
[2] DIMITRIJEVIC S, RAJAKOVIC N. An innovative approach for solving the restoration problem in distribution networks [J]. Electric Power Systems Research, 2011, 81: 1961-1972.
[3] BABAZADEH E, OSKUEE M R J, POURMAHMOUD J, NAJAFI-RAVADANEGH S. Multi-stage planning of distribution networks with application of multi-objective algorithm accompanied by dea considering economical, environmental and technical improvements [J].Journal of Circuits, Systems and Computers, 2016, 25(4): 1650025.
[4] BARAN M E, WU F F. Network reconfiguration in distribution for loss reduction and load balancing [J]. IEEE Transaction Power Systems, 1989, 4(3): 1401-1407.
[5] DEVI A L, SUBRAMANYAM B. Optimal DG unit placement of loss reduction in radial distribution system-a case study [J]. ARPN Journal of Engineering and Applied Sciences, 2007, 2(6): 57-61.
[6] MERLIN A, BACK H. Search for a minimal-loss operating spanning tree configuration in an urban power distribution system [C]// Proc 5th Power Syst Comput Conf (PSCC). Cambridge, UK: PSCC, 1975: 1-18.
[7] KHODR H M, MARTINEZ-CRESPO J. Integral methodology for distribution systems reconfiguration based on optimal power flow using Benders decomposition technique [J]. IET generation, transmission & Distribution, 2009, 3(6): 521-534.
[8] HUANG Y C. Enhanced-genetic-algorithm-based fuzzy multi- objective approach to distribution network reconfiguration [J].IEE Proceedings-Generation, Transmission and Distribution, 2002,149(5): 615-620.
[9] RAYAPUDI SRINIVASA RAO, SADHU VENKATA LAKSHMI NARASIMHAM, MANYALA RAMALINGA RAJU, RAO S A. Optimal network reconfiguration of large-scale distribution system using harmony search algorithm [J]. IEEE Transactions on Power Systems, 2011, 26(3):
[10] GUPTA N, SWARNKAR A, NIAZI K R. Reconfiguration of distribution systems for real power loss minimization using adaptive particle swarm optimization [J]. Electric Power Components and Systems, 2011, 39: 317-330.
[11] SATHISH KUMAR K, JAYABARATHI T. Power system reconfiguration and loss minimization for an distribution systems using bacterial foraging optimization algorithm [J]. Electrical Power and Energy Systems, 2012, 36: 13-17.
[12] SATHISH KUMAR K, NAVEEN S. Power system reconfiguration and loss minimization for a distribution systems using ��Catfish PSO�� algorithm [J]. Frontiers in Energy December, 2012, 8(4): 434-442.
[13] CHANG H C, KUO C C. Network reconfiguration in distribution system using simulated annealing [J]. Electr Power Syst Res, 1994, 29: 227-238.
[14] GHASEMI S, MOSHTAGH J. Radial distribution systems reconfiguration considering power losses cost and damage cost due to power supply interruption of consumers [J]. International Journal on Electrical Engineering and Informatics, 2013, 5(3): 297-315.
[15] ABABEI C, KAVASSERI R. Efficient network reconfiguration using minimum cost maximum flow-based branch exchanges and random walks-based loss estimations [J]. IEEE Transactions on Power Systems, 2011, 26(1): 30-37.
[16] BABAZADEH E, OSKUEE M R J, POURMAHMOUD J, NAJAFI-RAVADANEGH S. Optimal planning of smart distribution network based on efficiency evaluation using data envelopment analysis [J]. International Journal on Electrical Engineering and Informatics,2016, 8(1): 1-45.
[17] BARKER P P, de MELLO R W. Determining the impact of distributed generation on power systems [C]// I Radial distribution systems, in Power Engineering Society Summer Meeting, :IEEE, 2000, 3: 1645-1656
[18] MASOUMEH K, OSKUEE M R J, BOUSHEHRY M J A, RAVADANEGH S N. Optimal planning of distributed generation with application of multi-objective algorithm including economical, environmental and technical issues with considering uncertainties [J]. International Journal of Ambient Energy, 2016: 1-9.
[19] REZA S, BADE M G. A global harmony search algorithm for finding optimal capacitor location and size in distribution networks [J].Journal of Central South University, 2015, 22(5): 1748-1761.
[20] MIRAZIMI S J, NEMATOLLAHI M, ASHOURIAN M H, MIRAHMADI S H. Reconfiguration and DG placement considering critical system condition [C]// IEEE 7th International Power Engineering and Optimization Conference (PEOCO2013), Langkawi, Malaysia: IEEE, 2013, 3-4.
[21] FAZEL A, HOSSEINI S M. Optimal DG allocation and sizing in presence of storage systems considering network configuration effects in distribution systems [J].IET Generation, Transmission & Distribution(2015).
[22] Dahalan W M, Mokhlis H, Ahmad R, Bakar A, Musirin I. Simultaneous network reconfiguration and DG sizing using evolutionary programming and genetic algorithm to minimize power losses [J]. Arab J Sci Eng, 2014, 39: 6327-6338.
[23] GUAN Wan-lin, TAN Yang-hong, ZHANG Hai-xia, SONG Jian-li, Distribution system feeder reconfiguration considering different model of DG sources [J]. Electrical Power and Energy Systems, 2015, 68: 210-221.
[24] Seyed Abbas Taher, Mohammad Hossein Karimi. Optimal reconfiguration and DG allocation in balanced and unbalanced distribution systems [J]. Ain Shams Engineering Journal, 2014
[25] MOHAMED IMRAN A, KOWSALYA M, KOTHARI D P. A novel integration technique for optimal network reconfiguration and distributed generation placement in power distribution networks [J]. Electrical Power and Energy Systems, 2014, 63: 461-472.
[26] GUIMARAES M A N, CASTRO C A, ROMERO R. Distribution systems operation optimization through reconfiguration and capacitor allocation by a dedicated genetic algorithm [J].IET Generation, Transmission & Distribution, 2010, 4(11): 1213-1222.
[27] MOHAMED I A, KOWSALYA M, KOTHARI D P. A novel integration technique for optimal network reconfiguration and distributed generation placement in power distribution networks [J]. Electrical Power and Energy Systems, 2014, 63: 461-472.
[28] SRINIVAS N, DEB K. Multi-objective optimization using non-dominated sorting in genetic algorithms [J]. Evolut Comput, 1994, 2(3): 221-248.
[29] ATWA Y M, EL-SAADANY E F, SALAMA M M A, SEETHAPATHY R. Optimal renewable resources mix for distribution system energy loss minimization [J]. IEEE Transactions on Power Systems, 2010, 25(1): 360-370.
[30] BIGGS N. Algebraic graph theory [M]. Cambridge: Cambridge University Press, 1993.
[31] GODSIL C, ROYLE G. Algebraic graph theory, volume 207 of Graduate Texts in Mathematics [M]. New York: Springer Verlag, 2001.
[32] RAO R S, NARASIMHAM S V L, RAMALINGARAJU M. Optimal capacitor placement in a radial distribution system using plant growth simulation algorithm [J]. International Journal of Electrical Power & Energy Systems, 2011, 33(5): 1133-1139.
[33] KAYAL P, CHANDA C K. Placement of wind and solar based DGs in distribution system for power loss minimization and voltage stability improvement [J]. International Journal of Electrical Power & Energy Systems, 2013, 53: 795-809.
[34] FARINA M, AMATO P. A fuzzy definition of ����optimality�� for many-criteria optimization problems [J]. IEEE Trans Syst, ManCybern, Part A, 2011, 34(3): 315-326.
(Edited by DENG L��-xiang)
Cite this article as: Sajad Najafi Ravadanegh, Mohammad Reza Jannati Oskuee, Masoumeh Karimi. Multi-objective planning model for simultaneous reconfiguration of power distribution network and allocation of renewable energy resources and capacitors with considering uncertainties [J]. Journal of Central South University, 2017, 24(8): 1837-1849. DOI: https://doi.org/10.1007/s11771-017-3592-8.
Received date: 2016-03-08; Accepted date: 2017-03-13
Corresponding author: Sajad Najafi Ravadanegh, PhD, Assistant Professor; Tel: +984124327500; E-mail: s.najafi@azaruniv.edu

